. 2022 Jan 31;18(4):1594-1611.
doi: 10.7150/ijbs.68873. eCollection 2022.

Atractylenolide III ameliorates Non-Alcoholic Fatty Liver Disease by activating Hepatic Adiponectin Receptor 1-Mediated AMPK Pathway

Affiliations

Atractylenolide III ameliorates Non-Alcoholic Fatty Liver Disease by activating Hepatic Adiponectin Receptor 1-Mediated AMPK Pathway

Qian Li et al. Int J Biol Sci. .

Abstract

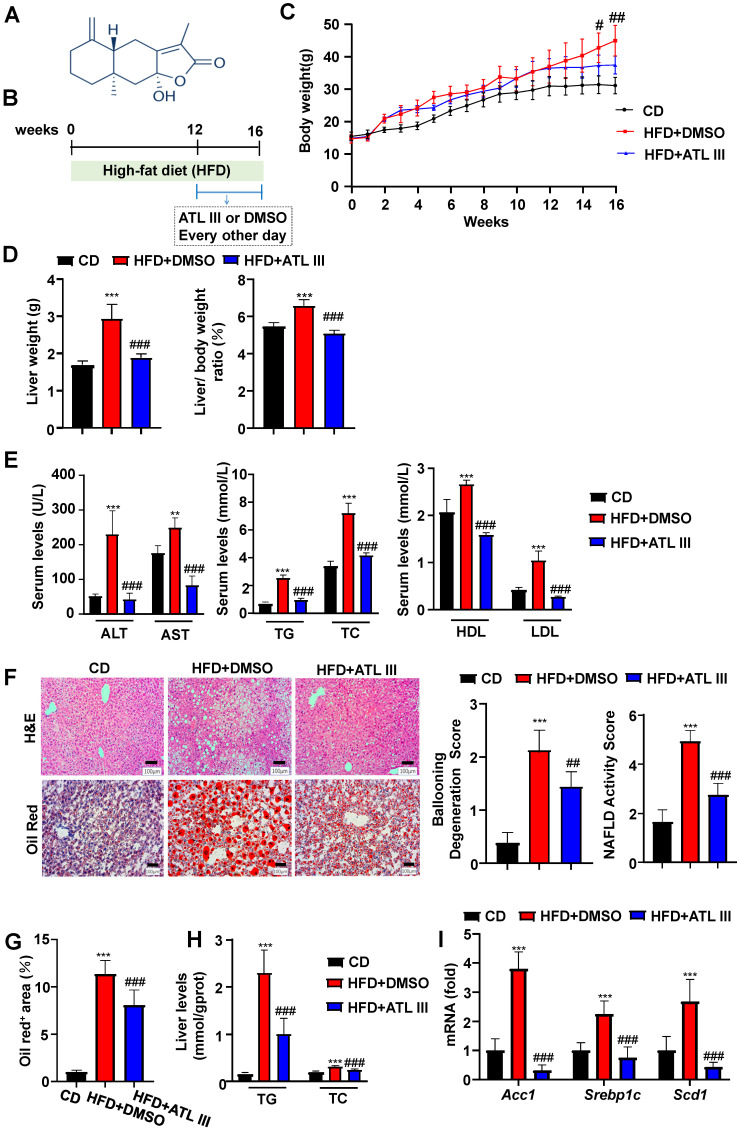
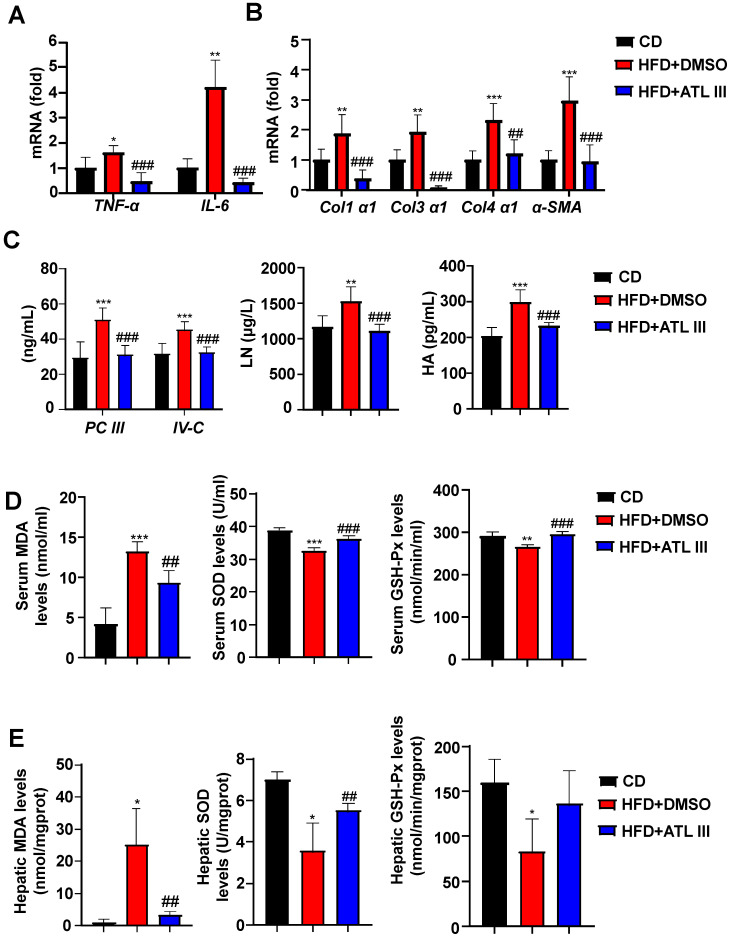
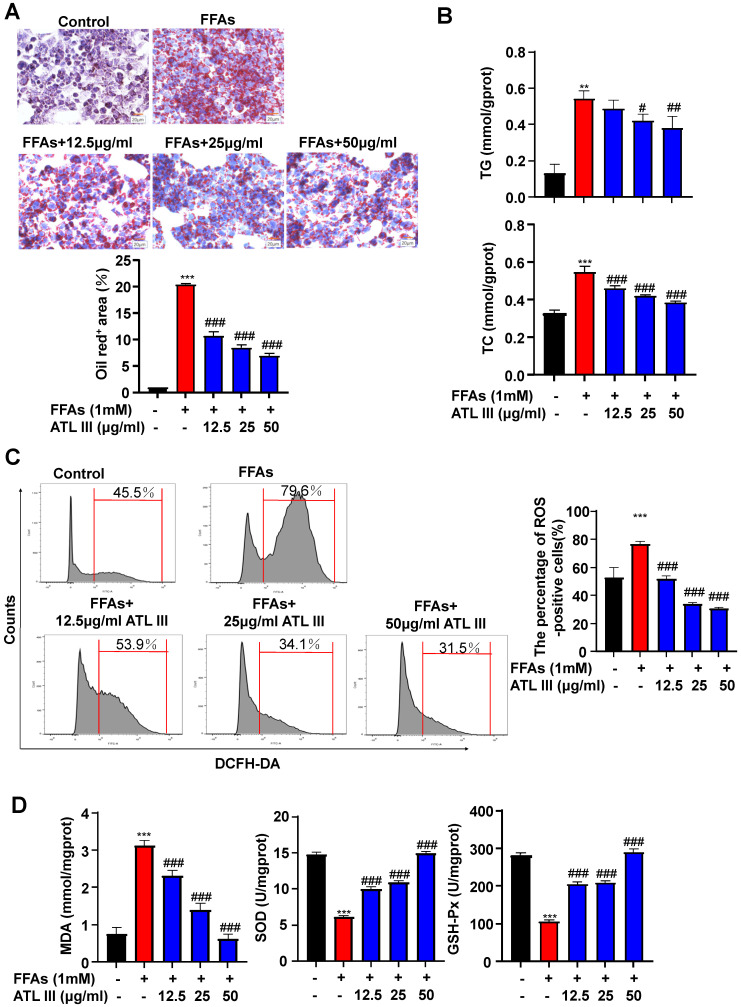
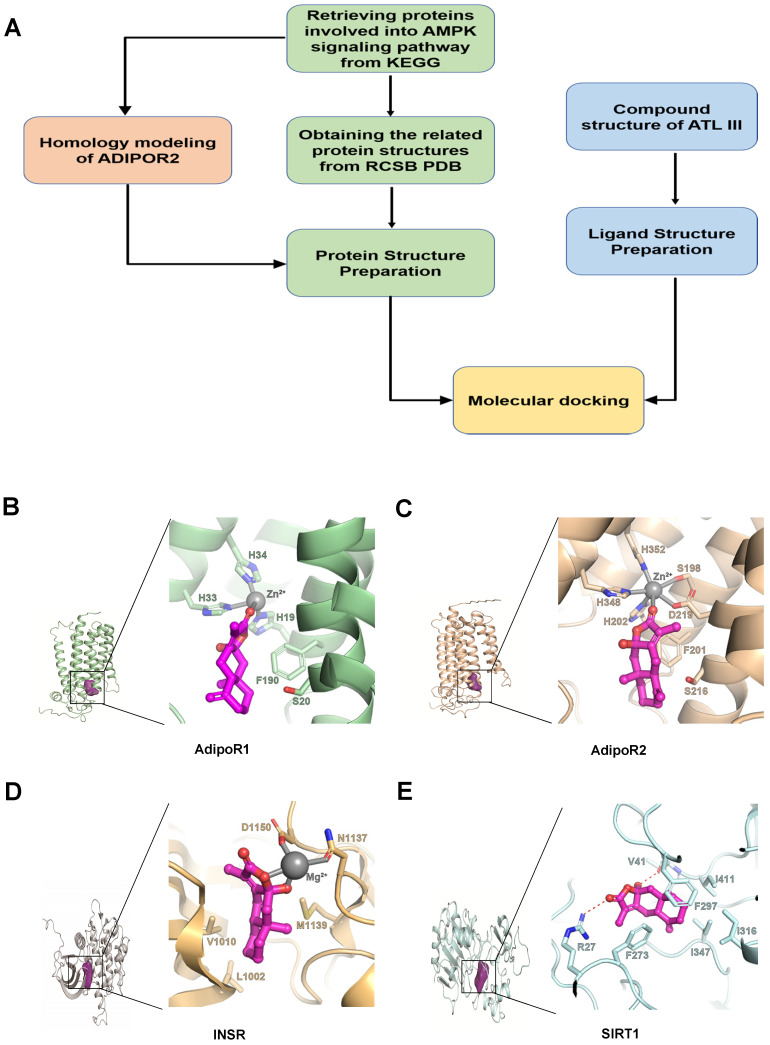
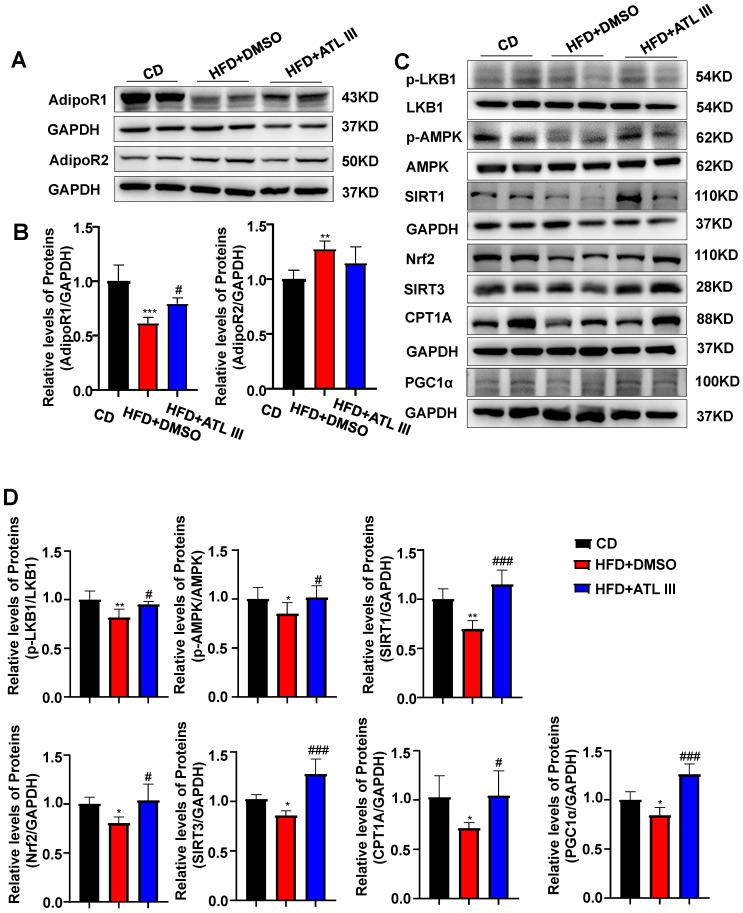
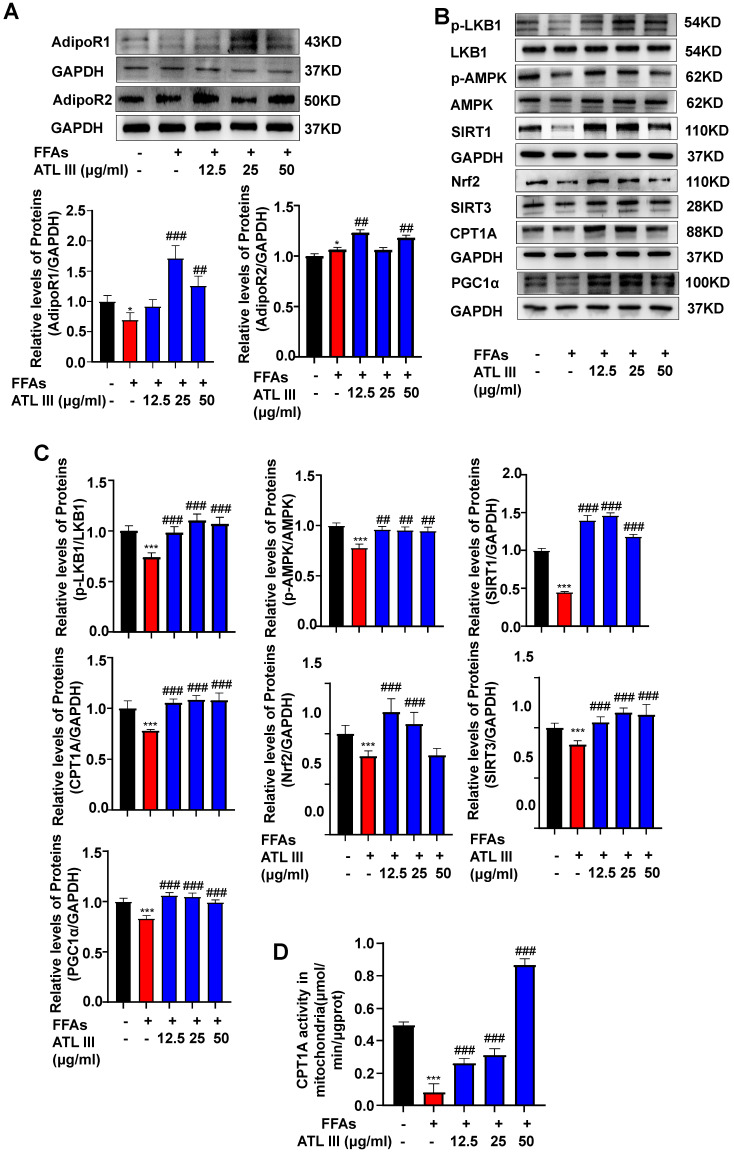
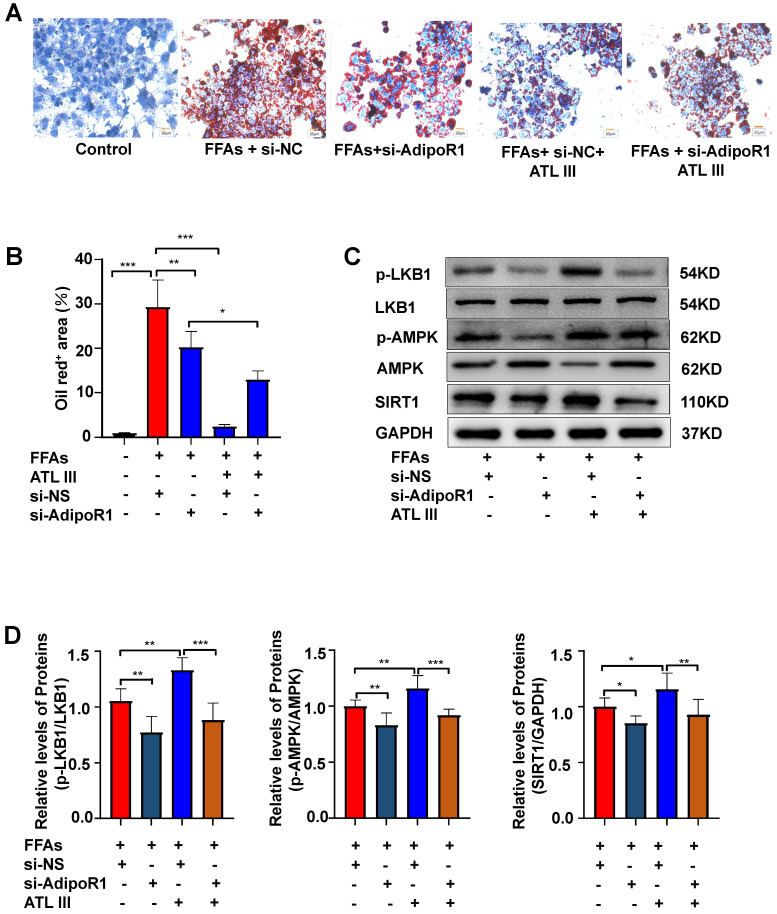
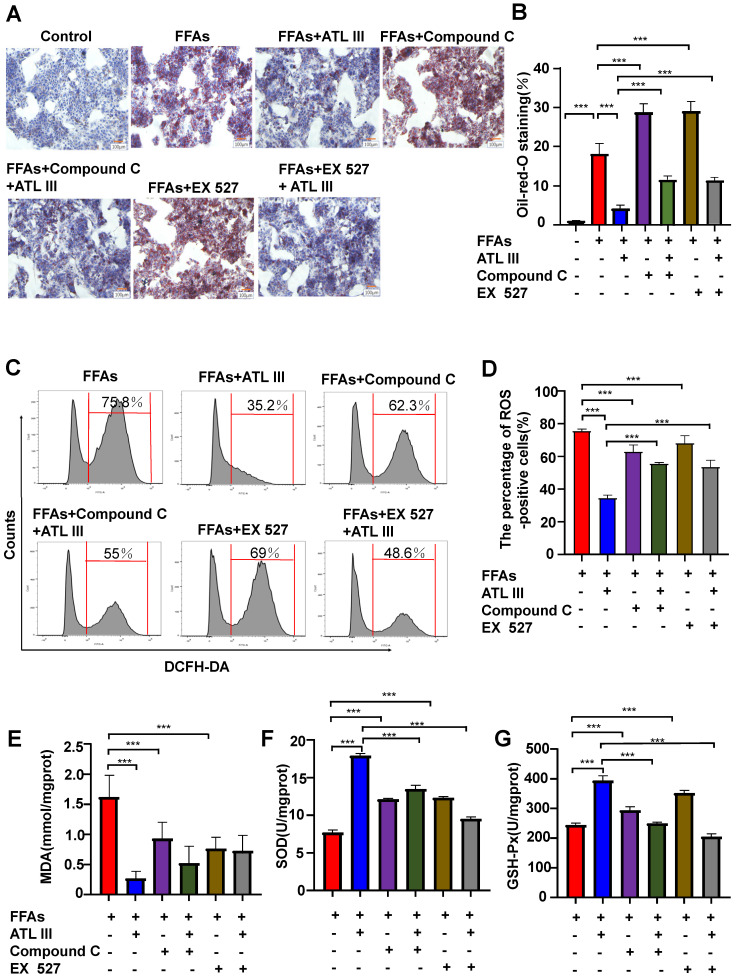
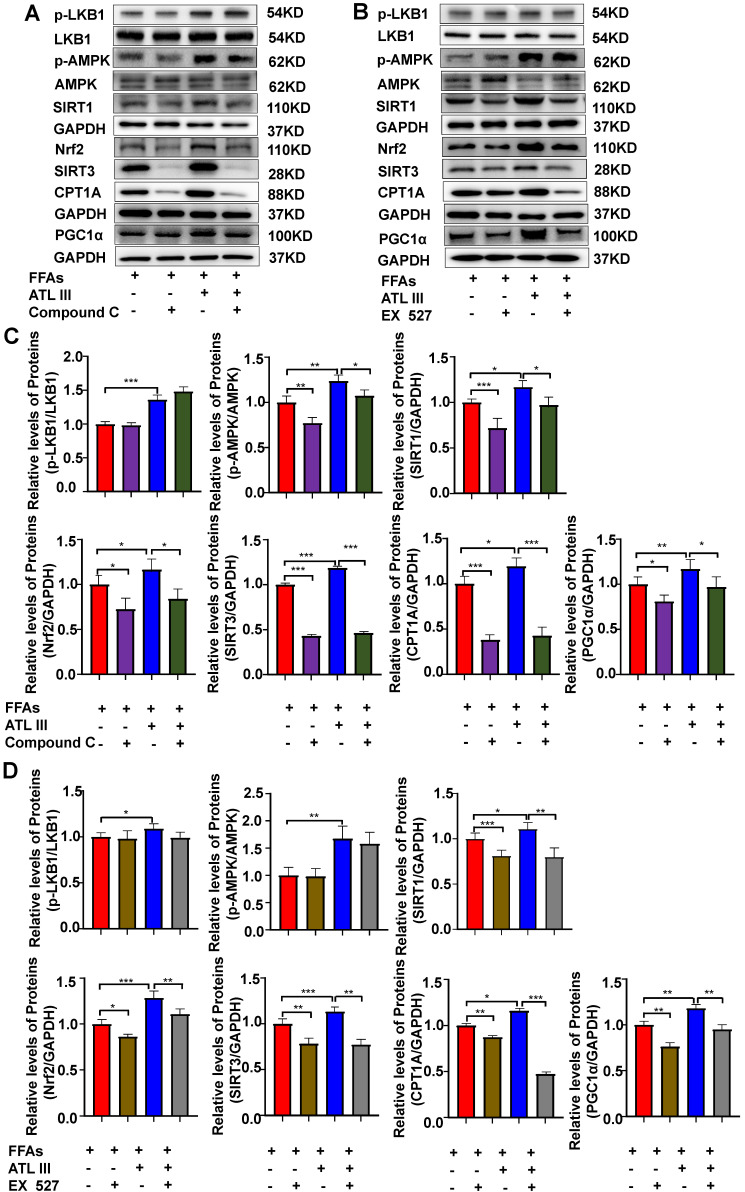
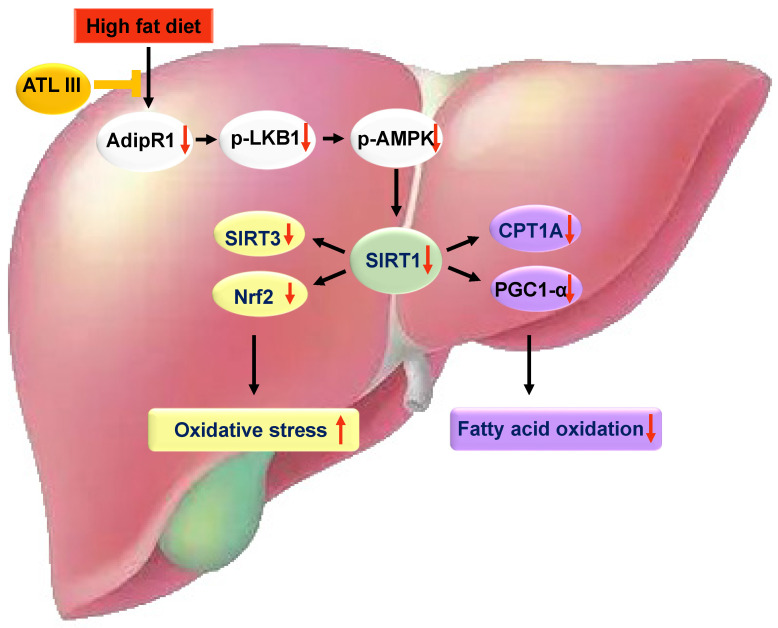
Background: Nonalcoholic fatty liver disease (NAFLD) is the most frequent cause of chronic liver diseases worldwide. At present, there are no effective pharmacological therapies for NAFLD except lifestyle intervention-mediated weight loss. Atractylenolide III (ATL III), the major bioactive component found in Atractylode smacrocephala Koidz, has been shown to exert anti-oxidant, anti-tumor, anti-allergic response, anti-bacterial effects and cognitive protection. Here we investigate the therapeutic potential and underlying mechanisms of ATL III for the treatment of NAFLD. Methods: Male C57BL/6J mice were fed a high-fat diet (HFD) and treated with ATL III. Lipid accumulation was analyzed by Oil Red O staining in liver tissues and free fatty acids (FFAs)-treated hepatocytes. AMP-activated protein (AMPK) and sirtuin 1(SIRT1) signaling pathways were inhibited by Compound C and EX527 in vitro, respectively. Small-interfering RNA (siRNA) was used to knockdown adiponectin receptor 1 (AdipoR1) expression in HepG2 cells. Results: ATL III treatment ameliorated liver injury and hepatic lipid accumulation in the HFD-induced NAFLD mouse model as demonstrated by that ATL III administration significantly reduced serum levels of alanine aminotransferase, glutamic oxaloacetic transaminase, triglycerides, total cholesterol and low-density lipoprotein. Furthermore, treatment with ATL III alleviated hepatic oxidative stress, inflammation and fibrosis in the HFD feeding model. To study the underlying mechanisms, we performed Computer Aided Design assay and found that open-formed AdipoR1 and adiponectin receptor 2 were the potential receptors targeted by ATL III. Interestingly, HFD feeding or FFAs treatment only reduced hepatic AdipoR1 expression, while such reduction was abolished by ATL III administration. In addition, in vitro treatment with ATL III activated the AdipoR1 downstream AMPK /SIRT1 signaling pathway and reduced lipid deposition in HepG2 cells, which was diminished by silencing AdipoR1. Finally, inhibition of AMPK or SIRT1, the AdipoR1 downstream signaling, abolished the protective effects of ATL III on lipid deposition and oxidative stress in FFAs-treated HepG2 cells. Conclusion: Our findings suggest that ATL III is a therapeutic drug for the treatment of NAFLD and such protective effect is mediated by activating hepatic AdipoR1-mediated AMPK/SIRT1 signaling pathway.

Keywords: AMPK; ATL III; AdipoR1; SIRT1; inflammation; oxidative stress.


Conflict of interest statement

Competing Interests: The authors have declared that no competing interest exists.

Figures

Figure 1
Figure 1
ATL III administration ameliorates liver steatosis in HFD-fed mice. Mice were categorized into three groups including control diet group (CD), the HFD-fed induced NAFLD group (HFD+DMSO) and the HFD-fed induced NAFLD group administrated with ATL III (HFD+ATL III). A. The structure of ATL III is shown. B. Mice were fed with an HFD for 16 weeks to induce NAFLD and administered DMSO or ATL III by tail intravenous injection in the last 4 weeks. C. Dynamic changes of weight during the experiment stage were recorded. D. Liver weight and liver/body weight ratio (%) were analyzed. E. Alanine aminotransferase (ALT), Aspartate aminotransferase (AST), Triglycerides (TG), Total Cholesterol (TC), High-density lipoprotein (HDL) and Low-density lipoprotein (LDL). Serum ALT, AST, TG, TC, HDL and LDL levels were tested. F. H&E and Oil Red O-stained slices of liver tissues were shown. Ballooning Degeneration Score and NAFLD Activity Score were calculated. G. The quantitation analyses of Oil Red O-stained slices of liver tissues were shown. H. TG and TC levels in liver tissues were examined. The 'mmol/gprot' means that the protein content of tissue extracts was calculated as mmols per gram protein of the tissue. I. The levels of some lipogenesis-related key genes including Acc1, Srebp1c and Scd1 in the livers of HFD-fed mice were tested by RT-qPCR. Values represent means±SD. (n=12 mice in each group). **, compared with CD P<0.01, ***, compared with CD P<0.001; #, compared with HFD+DMSO P<0.05; ##, compared with HFD+DMSO P<0.01, ###, compared with HFD+DMSO P<0.001.
Figure 2
Figure 2
ATL III administration mitigates liver inflammation, fibrosis, and oxidative stress after HFD feeding. A. The levels of inflammatory factors including TNF-α and IL-6 in the livers of HFD-fed mice were tested by RT-qPCR. B. The levels of fibrogenic genes including Col1α1, Col3α1, Col4α1 and α-SMA were examined by RT-qPCR. C. Procollagen type III (PC III), Collage type VI (IV-C), Laminin (LN), Hyaluronic acid (HA). The expression levels of serum fibrosis-related proteins including PC III, IV-C, LN and HA were examined by ELISA. D. Malondialdehyde (MDA), Superoxide Dismutase (SOD), Glutathione peroxidase (GSH-Px). Serum MDA, SOD and GSH-Px levels were measured by chemocolorimetry. E. The expression levels of MDA, SOD and GSH-Px in liver tissues were examined by chemocolorimetry. The 'mgprot' mean that the protein content of tissue extracts and enzymatic activities were calculated as nmols and units per milligram protein of the tissue. Values represent means ± SD (n=12 mice in each group). *, Compared with CD P<0.05, **, compared with CD P<0.01, ***, compared with CD P<0.001; ##, compared with HFD+DMSO P<0.01, ###, compared with HFD+DMSO P<0.001.
Figure 3
Figure 3
ATL III administration reduces FFAs-induced lipid accumulation in HepG2 cells. HepG2 cells were categorized into five groups including the control group, FFAs group, 12.5 µg/ml ATL III group, 25 µg/ml ATL III group and 50 µg/ml ATL III group. A. Lipids in HepG2 cells were stained by Oil Red O. Representative Oil Red O staining images were shown. The quantification of intracellular lipid content by Oil Red O staining was analyzed by calculating the area of intracellular lipid droplets. B. Intracellular TG and TC levels were measured by biochemical test kits. C. ROS expression levels in HepG2 cells were tested by flow cytometry. Representative flow cytometry analysis of ROS levels in HepG2 cells were shown. The analyses of ROS levels expressed by HepG2 cells were shown. D. MDA, SOD and GSH-Px levels expressed by HepG2 cells were measured. The above experiments were performed three times independently, and the results were displayed as mean±SD. **, Compared with Control group P<0.01 ***, compared with Control group P<0.001; #, compared with FFAs group P<0.05; ##, compared with FFAs group P<0.01; ###, compared with FFAs group P<0.001.
Figure 4
Figure 4
The potential binding target of ATL III was identified by Computer Aided Design assay. A. The designed workflow for identifying potential drug targets of ATL III from the genes being involved in the AMPK pathway was shown. B. AdipoR1: Zoomed potential binding pattern of AdipoR1 and ATL III. ATL III formed hydrophobic interaction with F190 and coordinate bond with zinc ion of AdipoR1 (GlideScore:-3.266). C. AdipoR2: Zoomed potential binding pattern of AdipoR2 and ATL III. ATL III formed hydrophobic interaction with F201 and coordinate bond with zinc ion of AdipoR2 as a part of hexa-coordinated complex (Glidescore:-3.478). D. INSR: Zoomed potential binding pattern of INSR and ATL III. ATL III formed two coordinate bond with magnesium ion and hydrophobic interaction with L1002, V1010 and M1139 of INSR (GlideScore; -3.478). E. SIRT1: Zoomed potential binding pattern of SIRT1 and ATL III. ATL III formed hydrogen bond with V41, R27 and stable hydrophobic interaction with five residues: F273, F297, I316, I347, I411 of SIRT1 (GlideScore:-5.969). GlideScore was the docking score for estimating the binding affinity between a ligand and a protein. In this work, the contribution of the metal ions to the binding affinity was not considered.
Figure 5
Figure 5
ATL III treatment restores the down-regulation of hepatic AdipoR1 expression and AdipoR1 signaling induced by HFD feeding in mice. A. Expression levels of hepatic AdipoR1 and AdipoR2 were examined in HFD mice. B. Relative levels of hepatic AdipoR1 and AdipoR2 were analyzed. C. AdipoR1 downstream signaling molecules including p-LKB1, p-AMPK, SIRT1, Nrf2, SIRT3, CPT1A and PGC1α were tested in HFD mice. D. Relative levels of p-LKB1, p-AMPK, SIRT1, Nrf2, SIRT3, CPT1A and PGC1α were analyzed. The experiments were performed three times independently, and values represent means ± SD.*, compared with CD P<0.05; **, compared with CD P<0.01; ***, compared with CD P<0.001; #, compared with HFD+DMSO P<0.05; ##, compared with HFD+DMSO P<0.01; ###, compared with HFD+DMSO P<0.001.
Figure 6
Figure 6
ATL III restores the down-regulated expression of AdipoR1-mediated AMPK-SIRT1 signaling molecules in HepG2 cells. A. HepG2 cells were categorized into five groups including the control group, FFAs group, 12.5 µg/ml ATL III group, 25 µg/ml ATL III group and 50 µg/ml ATL III group. AdipoR1 and AdipoR2 protein levels were examined by western-blot. Relative levels of hepatic AdipoR1 and AdipoR2 were analyzed. B. The expression levels of a number of key components of AdipoR1-mediated downstream signaling molecules were assessed by western blot. C. Relative levels of p-LKB1, p-AMPK, SIRT1, Nrf2, SIRT3, CPT1A and PGC1α were analyzed. D. The CPT1A activity was examined by using a CPT1A activity detection kit. The experiments were performed three times independently, and values represent means±SD. *, Compared with Control group P<0.05; ***, compared with Control group P<0.001; ##, compared with FFAs group P<0.01; ###, compared with FFAs group P<0.001.
Figure 7
Figure 7
Silencing AdipoR1 abolishes ATL III-mediated amelioration of lipid accumulation and AdipoR1 downstream signaling in HepG2 cells. A. The expression of AdipoR1 was silenced by transfecting AdipoR1 siRNA into HepG2 cells. Lipids in HepG2 cells were stained by Oil Red O. Representative Oil Red O staining images were shown. B. The quantification of intracellular lipid content by Oil Red O staining was analyzed by calculating the area of intracellular lipid droplets. C. The expression levels of p-LKB1, p-AMPK and SIRT1 were examined by western blot. D. Relative levels of p-LKB1, p-AMPK and SIRT1 were analyzed. The experiments were performed four times independently, and values represent means±SD.*, P<0.05; **, P<0.01; ***, P<0.001.
Figure 8
Figure 8
Inhibition of AMPK or SIRT1 represses the inhibitory effects of ATL III on hepatic lipid deposition in FFAs-induced HepG2 cells. HepG2 cells were categorized into seven groups including the control group, FFAs group, ATL III group, Compound C group, EX527 group, Compound C combined with ATL III group and EX527 combined with ATL III group. HepG2 cells were pre-incubated with Compound C (AMPK inhibitor) or EX527 (SITR1 inhibitor) for 1h, and then were incubated with FFAs for 24h, and were incubated with ATL III for another 24h. A. Lipids in HepG2 cells were stained by Oil Red O. Representative Oil Red O staining images were shown. B. The quantification of intracellular lipid content by Oil Red O staining was shown in the panel. C. ROS expression levels in HepG2 cells were tested by flow cytometry. Representative flow cytometry analysis of ROS levels in HepG2 cells were shown. D. The analysis of ROS levels expressed by HepG2 cells was shown. E-G. MDA, SOD and GSH-Px levels were measured. The experiments were performed three times independently, and the results were displayed as mean ± SD. *, P<0.05; **, P<0.01; ***, P<0.001.
Figure 9
Figure 9
Inhibition of AMPK or SIRT1 abolishes the ATL III-mediated activation of the SIRT1 downstream signaling in FFAs-treated HepG2 cells. A-B. Levels of p-LKB1, p-AMPK, SIRT1, Nrf2, SIRT3, CPT1A and PGC1α protein were examined by western-blot. C-D. Relative levels of p-LKB1, p-AMPK, SIRT1, Nrf2, SIRT3, CPT1A and PGC1α were analyzed. The experiments were performed three times independently, and the results were displayed as mean±SD. *, P<0.05; **, P<0.01; ***, P<0.001.
Figure 10
Figure 10
A schematic overview depicting ATL III ameliorates NAFLD by activating the AdipoR1-mediated AMPK/SIRT1 pathway. In both HFD-induced NAFLD mouse model and FFAs-induced HepG2 steatosis model, AdipoR1-mediated signaling pathway takes part in the protection roles of ATL III ameliorating NAFLD. Fatty liver induced by 3-month HFD feeding has prominent lipid accumulation with high levels of oxidative stress and fibrosis, which is inhibited by ATL III administration. In FFAs-induced HepG2 steatosis model, ATL III treatment activates AdipoR1-mediated AMPK/SIRT1 pathway. In one hand, ATL III increases SIRT3 and Nrf2 levels, which decreases oxidative stress. In another hand, ATL III increases PGC1 α and CPT1A levels, which contributes to fatty acid oxidation.

References

    1. Hong M, Li S, Tan HY, Wang N, Tsao SW, Feng Y. Current Status of Herbal Medicines in Chronic Liver Disease Therapy: The Biological Effects, Molecular Targets and Future Prospects. International journal of molecular sciences. 2015;16:28705–45. - PMC - PubMed
    1. Jin X, Yang YD, Chen K, Lv ZY, Zheng L, Liu YP. et al. HDMCP uncouples yeast mitochondrial respiration and alleviates steatosis in L02 and hepG2 cells by decreasing ATP and H2O2 levels: a novel mechanism for NAFLD. Journal of hepatology. 2009;50:1019–28. - PubMed
    1. Zhu X, Xiong T, Liu P, Guo X, Xiao L, Zhou F. et al. Quercetin ameliorates HFD-induced NAFLD by promoting hepatic VLDL assembly and lipophagy via the IRE1a/XBP1s pathway. Food and chemical toxicology: an international journal published for the British Industrial Biological Research Association. 2018;114:52–60. - PubMed
    1. Younossi Z, Anstee QM, Marietti M, Hardy T, Henry L, Eslam M. et al. Global burden of NAFLD and NASH: trends, predictions, risk factors and prevention. Nature reviews Gastroenterology & hepatology. 2018;15:11–20. - PubMed
    1. Ratziu V, Bellentani S, Cortez-Pinto H, Day C, Marchesini G. A position statement on NAFLD/NASH based on the EASL 2009 special conference. Journal of hepatology. 2010;53:372–84. - PubMed

Publication types