. 2022 Feb 25:13:835879.
doi: 10.3389/fimmu.2022.835879. eCollection 2022.

Excessive Activation of Notch Signaling in Macrophages Promote Kidney Inflammation, Fibrosis, and Necroptosis

Affiliations

Excessive Activation of Notch Signaling in Macrophages Promote Kidney Inflammation, Fibrosis, and Necroptosis

Tiankui Ma et al. Front Immunol. .

Abstract

Diabetic nephropathy (DN) is one of the main causes of end-stage renal disease (ESRD). Existing treatments cannot control the progression of diabetic nephropathy very well. In diabetic nephropathy, Many monocytes and macrophages infiltrate kidney tissue. However, the role of these cells in the pathogenesis of diabetic nephropathy has not been fully elucidated. In this study, we analyzed patient kidney biopsy specimens, diabetic nephropathy model animals. Meanwhile, we cocultured cells and found that in diabetic nephropathy, damaged intrinsic renal cells (glomerular mesangial cells and renal tubular epithelial cells) recruited monocytes/macrophages to the area of tissue damage to defend against and clear cell damage. This process often involved the activation of different types of macrophages. Interestingly, the infiltrating macrophages were mainly M1 (CD68+iNOS+) macrophages. In diabetic nephropathy, crosstalk between the Notch pathway and NF-κB signaling in macrophages contributed to the polarization of macrophages. Hyperpolarized macrophages secreted large amounts of inflammatory cytokines and exacerbated the inflammatory response, extracellular matrix secretion, fibrosis, and necroptosis of intrinsic kidney cells. Additionally, macrophage depletion therapy with clodronate liposomes and inhibition of the Notch pathway in macrophages alleviated the pathological changes in kidney cells. This study provides new information regarding diabetic nephropathy-related renal inflammation, the causes of macrophage polarization, and therapeutic targets for diabetic nephropathy.

Keywords: NF-κB; Notch; diabetic kidney disease; diabetic nephropathy; kidney inflammation; macrophages; necroptosis; renal fibrosis.


Conflict of interest statement

The authors declare that the research was conducted in the absence of any commercial or financial relationships that could be construed as a potential conflict of interest.

Figures

Graphical Abstract
Graphical Abstract
Figure 1
Figure 1
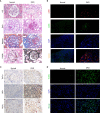
Macrophages infiltrate the kidneys of patients with diabetic kidney disease and are closely related to cell death. (A) Staining of kidney specimens included hematoxylin-eosin staining (H-E), periodic acid-Schiff staining (PAS), Masson’s trichrome staining (Masson), and periodic acid-silver methenamine staining (PASM). Magnification: ×400 (B) CD68/iNOS double immunofluorescence staining. Magnification: ×200 (C) Immunohistochemistry of kidney samples. Magnification: ×400. (D) TUNEL method to detect cell death in the kidney. Magnification: ×400.Normal, normal control; DKD, diabetic kidney disease.
Figure 2
Figure 2
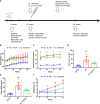
Macrophage depletion alleviates blood glucose, improves kidney function and relieves albuminuria in diabetic mice. (A) Schematic of the mouse experimental protocol. (B) Body weight of the mice. (C) Blood glucose levels of the mice. (D) Serum creatinine levels of the mice. (E) Blood urea nitrogen (BUN) levels of the mice. (F) Urine albumin-creatinine ratios of the mice. NC, normal control group (db/m); DN, DN group (db/db); CL, CL treatment (db/db+CL treatment). #p < 0.05 vs. the normal group (db/m), ##p < 0.01 vs. the normal group (db/m), *p < 0.05 vs. the DN group (db/db), **p < 0.01 vs. the DN group (db/db) ns, no significance.
Figure 3
Figure 3
Macrophage depletion improves kidney damages and reduces M1 macrophage infiltration in diabetic mice. (A) Histopathologic Staining and transmission electron microscopy (TEM) of mouse kidney tissue. Hematoxylin-eosin (H-E) staining (magnification: 200×); periodic acid-Schiff (PAS) staining (magnification: 400×); Masson’s trichrome (Masson) staining (magnification: 200×); periodic acid-silver methenamine (PASM) staining (magnification: 400×); transmission electron microscopy images (magnification: 4000×). (B) F4/80 immunohistochemical staining of the mouse kidney. Original magnification: 200×. (C) CD68/iNOS coimmunofluorescence staining of mouse kidney tissue. Original magnification: 400×. Normal: db/m group, DN: db/db group, CL Treatment: db/db + clodronate liposome treatment.
Figure 4
Figure 4
Macrophage depletion significantly reduces the levels of chemokines in blood serum and tissues. (A) MCP-1 level in mouse serum. (B) mRNA expression of various chemokines in mouse kidney tissue. NC, normal control group (db/m); DN, diabetic nephropathy group (db/db), CL treatment: db/db + clodronate liposome treatment. #p < 0.05 vs. the normal group, ##p < 0.01 vs. the normal group, *p < 0.05 vs. the DN group, **p < 0.01 vs. the DN group.
Figure 5
Figure 5
Macrophage depletion reduces the necroptosis of renal tubular cells in diabetic mice. (A) TUNEL assay to detect cell death in renal tubulointerstitium of mouse, with counterstaining of cell nuclei (DAPI, blue). Original image magnification: 200×. (B) Immunohistochemical staining shows the levels of TNF-α in kidney tissue. Original image magnification: 200×. (C) Immunohistochemistry score of TNF-α. (D, E) Necroptosis pathway proteins RIP-1, RIP-3, and MLKL in the tissue were detected using western blotting, and GAPDH was used as the loading control. NC: normal control group (db/m), DN: diabetic nephropathy group (db/db), CL treatment: db/db + clodronate liposome treatment. #p < 0.05 vs. the normal group (db/m), ##p < 0.05 vs. the normal group (db/m), *p < 0.05 vs. the DN group (db/db), **p < 0.01 vs. the DN group (db/db).
Figure 6
Figure 6
Macrophage depletion reduces the level of inflammation and fibrosis in the kidneys of diabetic mice. (A, B) Immunohistochemistry and Immunohistochemistry score were used to evaluate the levels of the inflammation and fibrosis indicators IL-1β, TGF-β, and FN in mouse kidney tissue. (C, D) Western blot and semiquantitative analyses of the levels of inflammation and fibrosis indicators in the kidney tissue of mice. NC, normal control group (db/m); DN, diabetic nephropathy group (db/db), CL treatment: db/db + clodronate liposome treatment. ##p < 0.01 vs. the normal group (db/m), **p < 0.01 vs. the DN group (db/db).
Figure 7
Figure 7
Activation of the Notch signaling pathway plays a crucial role in the M1 polarization of macrophages in HG stimulation. (A) Immunofluorescence (IF) of inducible nitric oxide synthase (iNOS). (B) Western blot and semiquantitative analyses. (C) Confocal microscopy analysis of Notch1 and NF-κB p65 co-IF staining, magnification: 1000×. (D) Luciferase Activity of NF-κB-responsive luciferase reporter gene in HG stimulated Raw 264.7 cells. NG, normal glucose; HG, high glucose; Notch KD/si, Notch1 Knockdown; NICD-OE, NICD over expression. #p < 0.05 vs. the normal glucose (NG) group, ##p < 0.05 vs. the normal glucose (NG) group. *p < 0.05 vs. the high-glucose (HG) group, **p < 0.01 vs. the high-glucose (HG) group. ns, no significance.
Figure 8
Figure 8
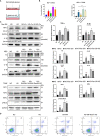
Coculture of macrophages and intrinsic renal cells under high glucose condition significantly aggravates inflammation, fibrosis, and necroptosis of intrinsic renal cells. (A) Schematic of the coculture experiments. (B) The concentration of MCP-1 in the supernatants of different group cells was determined by ELISA. (C) Western blot and semiquantitative analyses. (D) Cell death was assessed by Annexin V-FITC/PI staining and analyzed by flow cytometry. NG, normal glucose; HG, high glucose; KD, knockdown; OE, over expression; Co, coculture. #p < 0.05 vs. the normal glucose (NG) group, ##p < 0.01 vs. the normal glucose (NG) group, **p < 0.01 vs. the high-glucose (HG) group, &p < 0.05 vs. the high-glucose coculture group, &&p < 0.01 vs. the high-glucose coculture group. ns, no significance.

Similar articles

Cited by

References

    1. International Diabetes Federation (IDF) . IDF Diabetes Atlas. 9th ed. Brussels, Belgium: International Diabetes Federation; (2019).
    1. Cole JB, Florez JC. Genetics of Diabetes Mellitus and Diabetes Complications. Nat Rev Nephrol (2020) 16(Suppl. 2):377–90. doi: 10.1038/s41581-020-0278-5 - DOI - PMC - PubMed
    1. Zheng Y, Ley S, Hu F. Global Aetiology and Epidemiology of Type 2 Diabetes Mellitus and Its Complications. Nat Rev Endocrinol (2018) 14(2):88–98. doi: 10.1038/nrendo.2017.151 - DOI - PubMed
    1. United States Renal Data System . 2020 USRDS Annual Data Report: Epidemiology of Kidney Disease in the United States. Bethesda, MD: National Institutes of Health, National Institute of Diabetes and Digestive and Kidney Diseases; (2020).
    1. Reidy K, Kang HM, Hostetter T, Susztak K. Molecular Mechanisms of Diabetic Kidney Disease. J Clin Invest (2014) 124(6):2333–40. doi: 10.1172/JCI72271 - DOI - PMC - PubMed

Publication types