. 2022 Feb 24:13:794006.
doi: 10.3389/fimmu.2022.794006. eCollection 2022.

Multi-Cellular Immunological Interactions Associated With COVID-19 Infections

Affiliations

Multi-Cellular Immunological Interactions Associated With COVID-19 Infections

Jitender S Verma et al. Front Immunol. .

Abstract

To rapidly prognosticate and generate hypotheses on pathogenesis, leukocyte multi-cellularity was evaluated in SARS-CoV-2 infected patients treated in India or the United States (152 individuals, 384 temporal observations). Within hospital (<90-day) death or discharge were retrospectively predicted based on the admission complete blood cell counts (CBC). Two methods were applied: (i) a "reductionist" one, which analyzes each cell type separately, and (ii) a "non-reductionist" method, which estimates multi-cellularity. The second approach uses a proprietary software package that detects distinct data patterns generated by complex and hypothetical indicators and reveals each data pattern's immunological content and associated outcome(s). In the Indian population, the analysis of isolated cell types did not separate survivors from non-survivors. In contrast, multi-cellular data patterns differentiated six groups of patients, including, in two groups, 95.5% of all survivors. Some data structures revealed one data point-wide line of observations, which informed at a personalized level and identified 97.8% of all non-survivors. Discovery was also fostered: some non-survivors were characterized by low monocyte/lymphocyte ratio levels. When both populations were analyzed with the non-reductionist method, they displayed results that suggested survivors and non-survivors differed immunologically as early as hospitalization day 1.

Keywords: COVID-19; biological complexity; cutoff-free; error prevention; multi-cellularity; pattern recognition; personalized medicine; personalized methods.


Conflict of interest statement

Author AA was employed by the company Stremble Ventures, LTD. Author AR is a co-inventor of the temporary guides used to recognize data patterns (European Union patent number 2959295, US patent number 10,429,389 B2). The remaining authors declare that the research was conducted in the absence of any commercial or financial relationships that could be construed as a potential conflict of interest.

Figures

Figure 1
Figure 1
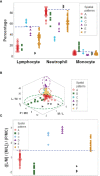
Leukocyte-demographic summary of the New Delhi population. Survivor- and nonsurvivor-related overlapping observations were observed when the total leukocyte counts (TLC) and relative percentages of blood neutrophils (N), monocytes (M) or lymphocytes (L) were analyzed (rectangles, (A). Three-dimensional (3D) analysis of the data did not remove data overlapping even after age was considered (rectangles, (B, C). Age did not differ significantly between female and male participants (D). While the median age was significantly lower in survivors than non-survivors, most observations of both outcomes displayed overlapping values (E). Lack of statistically significant differences between the gender of participants and disease outcomes were further demonstrated when the unit of data analysis was the individual (n=51 observations) and also when all 98 temporal data points were considered (F, G).
Figure 2
Figure 2
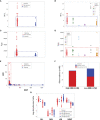
Continuous distributions of New Delhi leukocyte data. Overlapping data distributions were also observed when data points ‒which, inherently, are discrete or discontinuous‒ were assumed to be continuous (A–D). Considering that the highest value of each line represents the cutoff that separates survivors from non-survivors and projecting these lines over a histogram, non-survivor observations are depicted as dark pink bars and survivor observations are displayed as sky blue bars. Assuming that survivors are “positive” results and non-survivors are “negative” results, purple bars display the magnitude of false-negative and false-positive results, i.e., survivors that show observations within the non-survivor side of the plot (“false-positives”) and non-survivors that show observations within the survivor side of the plot (“false-negatives”). It is shown that misclassifications (purple bars) cover a substantial if not the whole range of the data.
Figure 3
Figure 3
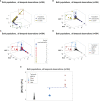
Three-dimensional pattern recognition of the New Delhi leukocyte data. Fifteen 3D data structures derived from the blood leukocyte data were explored for the presence of distinct (non-random) patterns. Each axis of each plot describes hypothetical and dimensionless indicators designed to express multi-cellular relationships, which are identified with two or three letters in italics (A–O). By reporting outcomes, this construct can simultaneously (i) show distinct patterns, if they exist (e.g., a perpendicular data inflection) and (ii) reveal whether one (or both) outcome(s) is/are clustered. To prevent artifacts, this process depends on redundancy: inferences are based on, at least, two separate data structures. This set of figures includes data structures showing: (i) a single (and perpendicular) data inflection (A); (ii) a data bifurcation (B); (iii) a perpendicular data inflection with some survivors clustered in one data segment (C); (iv) a rendundant expression (D); (v) a perpendicular data inflection with most survivors clustered in one data segment (E); (vi) a data bifurcation with a cluster that includes most survivors (F); (vii) a perpendicular data inflection that includes a data segment only composed of survivors (G); (viii-xi) four structures that reveal three data segments, perpendicular to one another (H–K); (xii) a partially redundant structure (spatially similar to B), which shows a cluster of survivors (L); (xiii) three perpendicular data inflections that include two data segments only composed of non-survivors (M); (xiv) a partially redundant structure (spatially similar to G), which differs in two aspects: it identifies a data segment only composed by non-survivors, which is perpendicular to the remaining observations (N); and (xv) a partially redundant structure (similar to N) which provides an additional indicator that separates non-survivors (high values of the verticql axis) from survivors and displays very low values in the vertical axis (O).
Figure 4
Figure 4
Data partitioning (labeling) of the New Delhi leukocyte data. After a substantial number of distinct patterns was observed (Figure 3), the patient identity of each data segment was identified. When at least two data structures identified the same group of patients, each patient group is identified with a unique identifier. This process identified six data groups (identified as ‘A, B,…F’). For instance, group ‘C’ included observations that were easily identified: they were a separate (non-overlapping) cluster, recognized by, at least, four data structures (A–D). Two other patient groups (‘D’ and ‘E’) were also identified by the spatial patterns shown by five data structures (E–I). A third patient group (‘B’) was unambiguously detected by five data structures (J–N). The two remaining patient groups (‘A’ and ‘F’) were differentiated by a double process: (i) from one another, they were distinguished by a perpendicular data inflection (H, J) and (ii) from the remaining patient groups, by default. Patient group ‘E’ was also identified by the data structure (O).
Figure 5
Figure 5
Immunological content of patient groups. Non-overlapping percentages of lymphocytes and neutrophils distinguished two data groups ('C' and 'E') from all the remaining patient groups, while non-overlapping intervals of at least one cell type differentiated group ‘B’ from four of the five remaining groups (A). A complex ratio that captured five multi-cellular relationships (L/M, M/L, [L/M/M/L], P/MC, and [[L/M/M/L]/P/MC]) differentiated, with non-overlapping data intervals, patient groups ‘A’, ‘D’, and ‘F’ from one another (B). Discrimination was not due to any one (single or complex) variable but to interactions: when the three constitutive elements displayed in (B) were analyzed individually (the L/M, M/L and P/MC ratios), confounding was observed: five of the six immune profiles were mixed. This means that the emergent information that discriminates only occurs when the most complex (system-level) interaction is assembled in 3D space (C). L, lymphocytes; N, neutrophils; M, monocytes; P, phagocytes (N and M); MC, mononuclear cells (L and M).
Figure 6
Figure 6
Evaluation of hypotheses and discovery (I). A subset of non-survivors showed very low values of the M/L ratio (A). This finding seemed to disprove the hypothesis that only high M/L values are associated with disease severity. Instead, at least two subtypes of non-survivors were discovered, which displayed high and low M/L values, respectively. Because another data subset included other non-survivors and all survivors, three subtypes of non-survivors were found (B). The monocyte percentage did not distinguish high from low M/L non-survivors (box, (C). Discrimination of these two subtypes of non-survivors was due to a lower percentage of lymphocytes, which are observed in the high M/L groups (horizontal lines, C). The hypothesis that lymphopenia is always associated with disease severity was not supported: five non-survivors did not show lymphopenia (D).
Figure 7
Figure 7
Evaluation of hypotheses and discovery (II). The hypotheses that claim high values of the neutrophil/lymphocyte (N/L) ratio or the total leukocycte count (TLC) are associated with disease severity were also tested. Neither hypothesis was supported: both the N/L ratio and the TLC confounded different outcomes and immune profile-defined patient groups (A–D). However, when two dimensionless indicators (named ‘BBI’ and ‘BBK’) were explored, a one data point-wide line of observations (1dpwlo) exhibited a perpendicular inflection that distinguished two data subsets (E). One of the data subsets (named ‘high BBI’) was predominantly (97.8% or 45/46) composed by non-survivors (p<0.01, χ2 test, (F). Most high BBI non-survivors displayed a higher ratio of neutrophils over mononuclear cells (N/MC ratio) than most non-survivors (G). Therefore, the analysis of complex but hypothetical immunological relationships discovered a prognosticator: high values of the N/MC ratio may predict non-survival.
Figure 8
Figure 8
Population-level prognosis. The proportion of survivor-related observations differed statistically among the six immunological groups (p<0.01, χ2 test). Most (92% or 23 out of 25) survivor-related observations were clustered into the ‘D’ or ‘F’ patient groups; in contrast, 68.5% (50 out of 73) nonsurvivor-related observations were found within the remaining four groups (A). Similar proportions were observed when patients –not observations− were the unit of analysis: 95.5% (21 out of 22) survivors were classified as either ‘D’ or ‘F’ patients, while 68.9% (20 out of 29) non-survivors were clustered within the remaining groups (B).
Figure 9
Figure 9
Assessment of potential errors patterns and additional discovery The data collected in the New Delhi study exhibited circular patterns. Data circularity was deduced because: (i) the same data cluster included observations from two periods (between 1 and 3, and 8 and 12 days post-admission), and (ii) two clusters only included data reported between 3 and 7 days (A). While such expressions might suggest ambiguity ‒and, consequently, lack of discrimination‒, pattern recognition detected actionable information: two of the three clusters only included non-survivors (B).
Figure 10
Figure 10
Temporal patterns. No survivor was reported in the Indian population after six in-hospital days (A, B). Day-1 post-admission observations differed from later observations: two subsets of later observations were detected, which only involved non-survivors (C, D). Patient groups were predominantly explained by temporal patterns, e.g., one pattern was only explained by group ‘C’ and a second pattern was mainly explained by group ‘B’ (E).
Figure 11
Figure 11
Reductionist and non-reductionist analysis of co-morbidities. A method meant to reduce dimensions (Principal Component Analysis or PCA) was applied to explore outcomes and co-morbidities. The PCA did not distinguish survivors from non-survivors (A). While the PCA discriminated two sets of co-morbidities (namely, (i) pneumonitis (B/L pneu), acute renal distress syndrome (ARDS) and septic shock (SS) (green squares) as well as (ii) B/L pneu, ARDS and diabetes mellitus type 1 (DM) (blue circles, B), such sets were also detected by the non-reductionist method, which, in addition, differentiated (iii) travel history (purple triangles) and (iv) two subsets of sepsis (red diamonds and yellow triangles, C–E).
Figure 12
Figure 12
Personalized, directionality-based prognostics. Data structures designed to remove data variability from all dimensions except one facilitated personalized assessments (A–F). For example, the data of 13 patients that reported a travel history displayed a one data point-wide line of observations (1dpwlo, (A, B). This data structure removes variability from all dimensions except one (along the line). Consequently, temporal changes can only occur along the line, and they will be detected even with a single observation (inferences are based on the directionality shown by arrows, not numerical values). Panel (C) shows the temporal data patterns generated by three patients, which expressed both a top-down flow (two individuals) and a bottom-up temporal directionality (one individual, (C). Applications of temporal 1dpwlo are depicted in panels (D, E) they describe one 1dpwlo with different outcomes clustered at each end of the line of data (D). When time is considered, non-survival is predicted when, over time, observations move from the right to the left (D, E). Therefore, a single change in temporal data directionality (an arrow that changes directions) is sufficient to predict, at a personalized level. For instance, patient #16 was showing a left-to-right, top-down temporal flow between day 1 and 4 (a survival prediction, panel (F). However, by day 5 the directionality of the data reversed, which predicted non-survival (F). Panel (D) confirms such a prediction.
Figure 13
Figure 13
Statistical significance and biomedical discrimination across populations. Some complex and dimensionless indicators (named BBF, AAT, and BBT) were explored at the first hospitalization day, both in the Indian dataset and in data collected from patients treated in Jacksonville, Florida, United States (A–F). To validate these indicators, the mononuclear cell/neutrophil ratio was used (G, H). Supporting the hypothesis that the dimensionless indicators were biologically valid, both populations reported similar findings: the dimensionless indicators and the M/CN ratio approached statistical significance when survivors and non-survivors were compared or were statistically significantly higher in survivors than in non-survivors. While differences between non-survivors and survivors reached statistical significance in the New Delhi population, they displayed overlapping data distributions that did not facilitate discrimination. In contrast, the Jacksonville population approached (but did not reach) statistical significance and many survivors displayed a substantial number of observations clearly above the upper limit of non-survivors (rectangles, (B, D, F, H). Consequently, two inferences were supported by the data: (1) the non-reductionist method appears to possess external validity (it is robust to population-related variability), and (2) statistical significance is not synonymous with biomedical discrimination ‒one may occur without the other.
Figure 14
Figure 14
Survivor- and nonsurvivor-related temporal immunological trends. When time was considered, the three complex indicators reported in Figure 13 displayed similar magnitudes in both populations (A–F). The ratio between survivors (S) and non-survivors (NS) was higher than 1 at all time points. Immunological differences between survivors and non-survivors were not explained by demographic factors: the median age was much lower in the New Delhi than in the Jacksonville group (G). Note I: given the few temporal data points available in the Indian dataset, all observations collected at day 2 or later were merged; i.e., day-2 values for the Jacksonville dataset do not necessarily correspond to day-2 values of the New Delhi dataset. Note II: while a total of 152 patients were investigated (51 from New Delhi and 101 from Jacksonville), day 1 observations only included 145 of such individuals. The difference is due to 6 N. Delhi patients whose first test was not conducted on hospitalization day 1.
Figure 15
Figure 15
Temporal and population-specific patterns. Supporting both the generalizability and the informative potential of the non-reductionist approach, both similar and different inferences were found across populations (A, B). Integration of immuno-pathology with pattern recognition and temporal assessments was also documented. For instance, two distinct data clusters observed when chronological data (hospitalization days) were observed (C) could be postulated to represent early or late inflammation (D). The presumptive inflammatory phase was biologically supported when a biologically explicit (although complex) ratio was analyzed: early inflammatory processes are consistent with increased phagocyte/lymphocyte ratios and late or recovery processes tend to be characterized by higher mononuclear cell/neutrophil ratios, that is, lower values of the [MC/N]/[P/L] complex ratio are expected in early inflammation and higher values of the same indicator may be found in later stages (E).

References

    1. Spitzer MH, Nolan GP. Mass Cytometry: Single Cells, Many Features. Cell (2016) 165:780–91. doi: 10.1016/j.cell.2016.04.019 - DOI - PMC - PubMed
    1. Kazer SW, Aicher TP, Muema DM, Carroll SL, Ordovas-Montanes J, Miao VN, et al. . Integrated Single-Cell Analysis of Multicellular Immune Dynamics During Hyperacute HIV-1 Infection. Nat Med (2020) 26:511–8. doi: 10.1038/s41591-020-0799-2 - DOI - PMC - PubMed
    1. Matthew D, Giles JR, Baxter AE, Oldridge DA, Greenplate AR, Wu JE, et al. . Deep Immune Profiling of COVID-19 Patients Reveals Distinct Immunotypes With Therapeutic Implications. Science (2020) 369:1209. doi: 10.1126/science.abc8511 - DOI - PMC - PubMed
    1. Auffray C, Noble D, Nottale L, Turner P. Progress in Integrative Systems Biology, Physiology and Medicine: Towards a Scale-Relative Biology. Eur Phys J A (2020) 56:88. doi: 10.1140/epja/s10050-020-00090-3 - DOI
    1. Gorban AN, Tyukin IY. Blessing of Dimensionality: Mathematical Foundations of the Statistical Physics of Data. Phil Trans R Soc A (2018) 376:20170237. doi: 10.1098/rsta.2017.0237 - DOI - PMC - PubMed

Publication types