Randomized Controlled Trial
. 2022 Feb 24:13:790444.
doi: 10.3389/fimmu.2022.790444. eCollection 2022.

Vitamins D2 and D3 Have Overlapping But Different Effects on the Human Immune System Revealed Through Analysis of the Blood Transcriptome

Affiliations
Randomized Controlled Trial

Vitamins D2 and D3 Have Overlapping But Different Effects on the Human Immune System Revealed Through Analysis of the Blood Transcriptome

Louise R Durrant et al. Front Immunol. .

Abstract

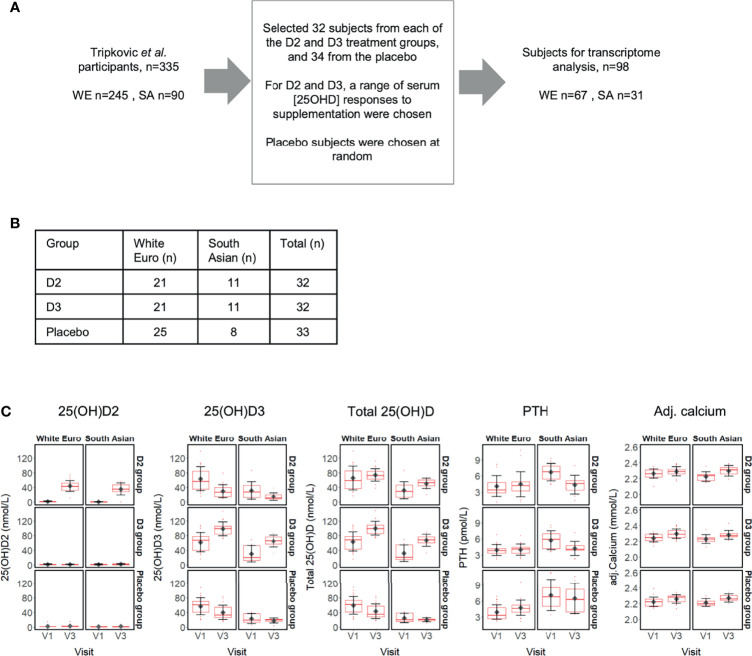
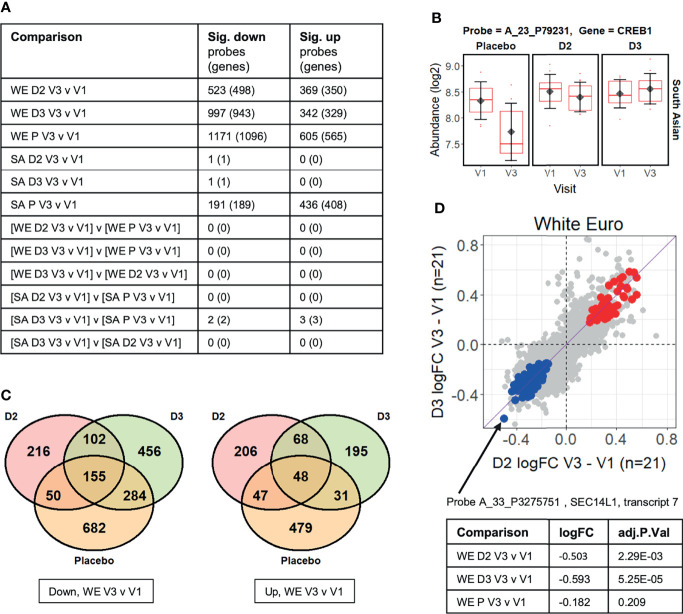
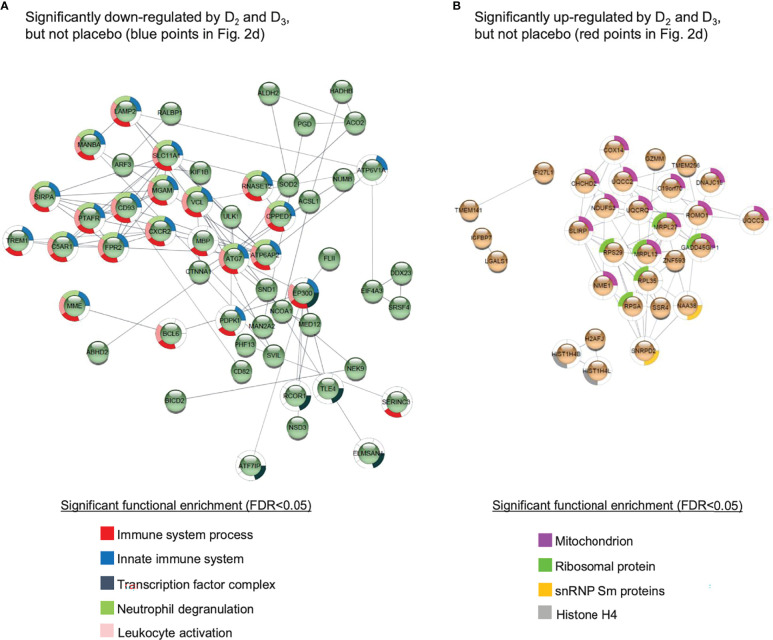
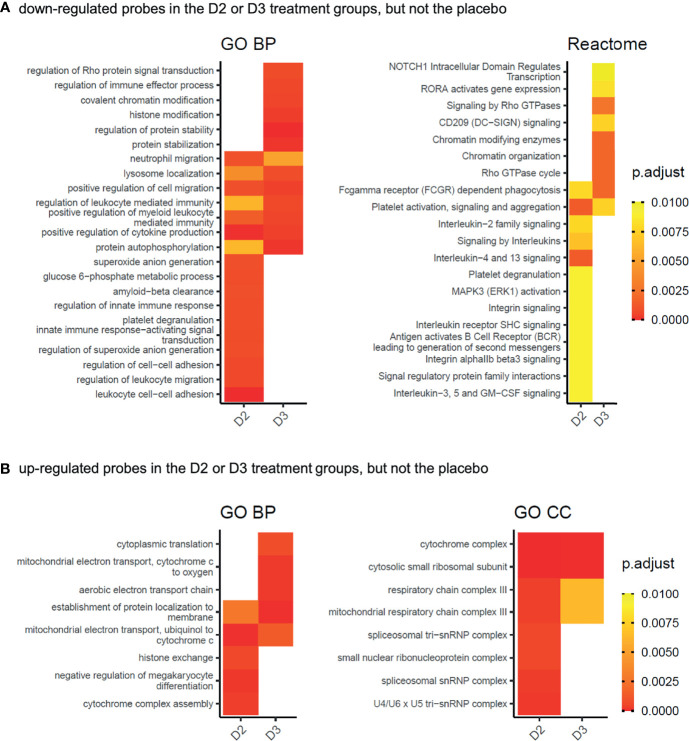
Vitamin D is best known for its role in maintaining bone health and calcium homeostasis. However, it also exerts a broad range of extra-skeletal effects on cellular physiology and on the immune system. Vitamins D2 and D3 share a high degree of structural similarity. Functional equivalence in their vitamin D-dependent effects on human physiology is usually assumed but has in fact not been well defined experimentally. In this study we seek to redress the gap in knowledge by undertaking an in-depth examination of changes in the human blood transcriptome following supplementation with physiological doses of vitamin D2 and D3. Our work extends a previously published randomized placebo-controlled trial that recruited healthy white European and South Asian women who were given 15 µg of vitamin D2 or D3 daily over 12 weeks in wintertime in the UK (Nov-Mar) by additionally determining changes in the blood transcriptome over the intervention period using microarrays. An integrated comparison of the results defines both the effect of vitamin D3 or D2 on gene expression, and any influence of ethnic background. An important aspect of this analysis was the focus on the changes in expression from baseline to the 12-week endpoint of treatment within each individual, harnessing the longitudinal design of the study. Whilst overlap in the repertoire of differentially expressed genes was present in the D2 or D3-dependent effects identified, most changes were specific to either one vitamin or the other. The data also pointed to the possibility of ethnic differences in the responses. Notably, following vitamin D3 supplementation, the majority of changes in gene expression reflected a down-regulation in the activity of genes, many encoding pathways of the innate and adaptive immune systems, potentially shifting the immune system to a more tolerogenic status. Surprisingly, gene expression associated with type I and type II interferon activity, critical to the innate response to bacterial and viral infections, differed following supplementation with either vitamin D2 or vitamin D3, with only vitamin D3 having a stimulatory effect. This study suggests that further investigation of the respective physiological roles of vitamin D2 and vitamin D3 is warranted.

Keywords: adaptive immunity; ethnicity; human transcriptome; immunomodulation; innate immunity; vitamin D supplementation; vitamin D2; vitamin D3.


Conflict of interest statement

The authors declare that the research was conducted in the absence of any commercial or financial relationships that could be construed as a potential conflict of interest.

Figures

Figure 1
Figure 1
(A) Selection of 98 subject participants from the Tripkovic et al. (2017) study (28) for transcriptomic analysis of their V1 (baseline) and V3 (12-week) samples in the present study; (B) Ethnicity and treatment group membership for the 97 subjects for which transcriptomic data was obtained (data for one South Asian subject from the placebo group did not pass quality control); (C) Metadata on serum concentrations of 25(OH)D2, 25(OH)D3, total 25(OH)D, PTH and calcium (albumin-adjusted) for the 97 subjects (see Supplementary Data File 1 for details). Participants were selected to provide comparable numbers between the placebo and the two vitamin D treatment groups, covering the full range of serum responses to supplementation within the D2 and D3 treatment groups, as judged from the measured changes in serum 25(OH)D2 or 25(OH)D3 concentrations between V1 and V3.
Figure 2
Figure 2
(A) Summary of limma differential expression test results identifying significant changes (adj.P.Val ≤ 0.05) in transcript probe abundance within and between the experimental groups (see Supplementary Data File 2 for full details). Both the number of unique microarray probes, and the number of unique genome loci they represent, are indicated. WE = “white European”; SA = “South Asian”; D2 = vitamin D2 treatment group; D3 = vitamin D3 treatment group; P = placebo group. (B) The CREB1 gene probe signal is significantly different (adj.P.Val=0.021) between the vitamin D3-treated group and the placebo group over the course of the V1 to V3 study period in the South Asian cohort (i.e. [SA D3 V3 v V1] v [SA P V3 v V1] comparison from Figure 2A ). (C) Venn diagrams showing the numbers of probes in the white European (WE) cohort that are specifically significantly (adj.P.Val ≤ 0.05) down- or up-regulated in V3 compared to V1 in each treatment group. (D) Comparison of the log2 fold-changes (FC) in abundance occurring from V1 to V3 in the WE cohort in the D2 and D3 treatment groups. Probes significantly up-regulated in both D2 and D3 groups but not the placebo are coloured red, while those similarly down-regulated are shown in blue (see Supplementary Data File 3 ). A probe detecting SEC14L1 shows the largest decreases in abundance in those down-regulated by D2 and D3 but not placebo.
Figure 3
Figure 3
Protein-protein interaction networks for gene products corresponding to the probes (A) significantly down-regulated or (B) significantly up-regulated in both the D2 and D3 treatment groups of the WE cohort, but not the placebo group. Details given in Supplementary Data File 3 . The networks were generated using the STRING database of Homo sapiens medium confidence (0.4) interactions, and only connected nodes are shown. Networks for both (A, B) are significantly enriched for interactions compared to randomised sets, yielding p-values of 1.98 × 10⁻⁶ and 4.99 ×10⁻⁹, respectively.
Figure 4
Figure 4
Gene Ontology biological process (GO BP), cellular compartment (GO CC), or Reactome pathway functional categories significantly enriched in the gene products represented by the probes (A) significantly down-regulated (adj.P.Val ≤ 0.05) in the D2 or D3 treatment groups of the WE cohort, but not in the placebo group, and (B) significantly up-regulated (adj.P.Val ≤ 0.05) in the D2 or D3 treatment groups of the WE cohort, but not in the placebo group. Gene products represented by the significantly down-regulated probes in the comparisons WE D2 V3 v V1, WE D3 V3 v V1 and WE P V3 v V1 from Figure 2A , and possessing ENTREZ identifiers, were subjected separately to functional enrichment analysis using compareCluster (38). The details for each group are given in Supplementary Data File 4 . Significantly enriched categories (p.adjust ≤ 0.01) from all groups were processed as described in the Methods section to visualise categories identified from the D2 or D3 treatment groups but not by the placebo. Heatmap tiles that are blank correspond to categories that did not meet the significance criteria applied during the processing. The complete networks for each differentially expressed group of genes are shown in Supplementary Data File 5 .
Figure 5
Figure 5
Gene co-expression networks for the WE (A) and SA (B) ethnic groups. For each group of subjects, signed scale-free networks were constructed from the expression data using WGCNA to cluster probes with similar expression characteristics across all samples into discrete modules (colours on the y-axis: colours in (A, B) are independent). Module membership for the modules of genes identified in the WGCNA analysis of the data from the South Asian and white European cohorts are detailed in Supplementary Data File 6 . The colour scale to the right of each panel represents the Pearson correlation (from -1 to +1) between the expression profile for each module’s eigengene and the respective serum 25(OH)D2, 25(OH)D3, total 25(OH)D and PTH concentrations (x-axis). The Pearson correlation coefficients are also provided in each box, followed in brackets by an adjusted p-value, testing for the significance of each correlation. Statistically significant correlations (adjusted p-value ≤ 0.05) are indicated in red. A headline significant GO functional enrichment category (p.adjust ≤ 0.01) for each significant module is shown to the right; GO test results for each module are summarised in Supplementary Data Files 7 , 8 ).
Figure 6
Figure 6
Gene Set Enrichment Analysis using the MSigDB hallmark gene sets indicates divergent behaviour for the interferon alpha and gamma response gene sets following supplementation with vitamin D2 and D3 in the WE cohort. Coloured tiles in the heatmap correspond to gene sets exhibiting a statistically significant (padjust≤ 0.05), concordant change between the V3 and V1 sampling times for the placebo (P), vitamin D2 (D2) or vitamin D3 (D3) treatment groups in the SA or WE cohorts. Grey tiles indicate non-significance. A positive normalised enrichment score (NES) indicates up-regulation of a gene set in V3 relative to V1, and conversely down-regulation is indicated by a negative NES score. Full results are provided in Supplementary Data File 9 , and the behavior of the leading edge, core genes accounting for the significant enrichment signals in the interferon alpha and gamma response sets are illustrated in Supplementary Figures 4 6 .
Figure 7
Figure 7
A schematic diagram of this study in the context of genetic and seasonal factors that can influence physiological vitamin D status and the whole blood transcriptome. Dietary supplementation with vitamin D2 or D3 boosts the native levels of the active forms of these vitamins in the blood, and generates overlapping but different effects on the seasonal trends in gene expression. Non-supplemented placebo subjects remain on their natural trajectories for levels of active D2 and D3, and for their seasonal expression profile. Selected differentially expressed pathways from this study are indicated on the Venn diagram.

Similar articles

Cited by

References

    1. Prietl B, Treiber G, Pieber TR, Amrein K. Vitamin D and Immune Function. Nutrients (2013) 5(7):2502–21. doi: 10.3390/nu5072502 - DOI - PMC - PubMed
    1. Martens PJ, Gysemans C, Verstuyf A, Mathieu AC. Vitamin D’s Effect on Immune Function. Nutrients (2020) 12(5):1248. doi: 10.3390/nu12051248 - DOI - PMC - PubMed
    1. Pilz S, Zittermann A, Trummer C, Theiler-Schwetz V, Lerchbaum E, Keppel MH, et al. . Vitamin D Testing and Treatment: A Narrative Review of Current Evidence. Endocr Connect (2019) 8(2):R27–43. doi: 10.1530/EC-18-0432 - DOI - PMC - PubMed
    1. Schwalfenberg GK. A Review of the Critical Role of Vitamin D in the Functioning of the Immune System and the Clinical Implications of Vitamin D Deficiency. Mol Nutr Food Res (2011) 55(1):96–108. doi: 10.1002/mnfr.201000174 - DOI - PubMed
    1. Christakos S, Dhawan P, Verstuyf A, Verlinden L, Carmeliet G. Vitamin D: Metabolism, Molecular Mechanism of Action, and Pleiotropic Effects. Physiol Rev (2016) 96(1):365–408. doi: 10.1152/physrev.00014.2015 - DOI - PMC - PubMed

Publication types