. 2022 Feb 24:9:759792.
doi: 10.3389/fmolb.2022.759792. eCollection 2022.

Determining the Prognostic Value of Spliceosome-Related Genes in Hepatocellular Carcinoma Patients

Affiliations

Determining the Prognostic Value of Spliceosome-Related Genes in Hepatocellular Carcinoma Patients

Jun Liu et al. Front Mol Biosci. .

Abstract

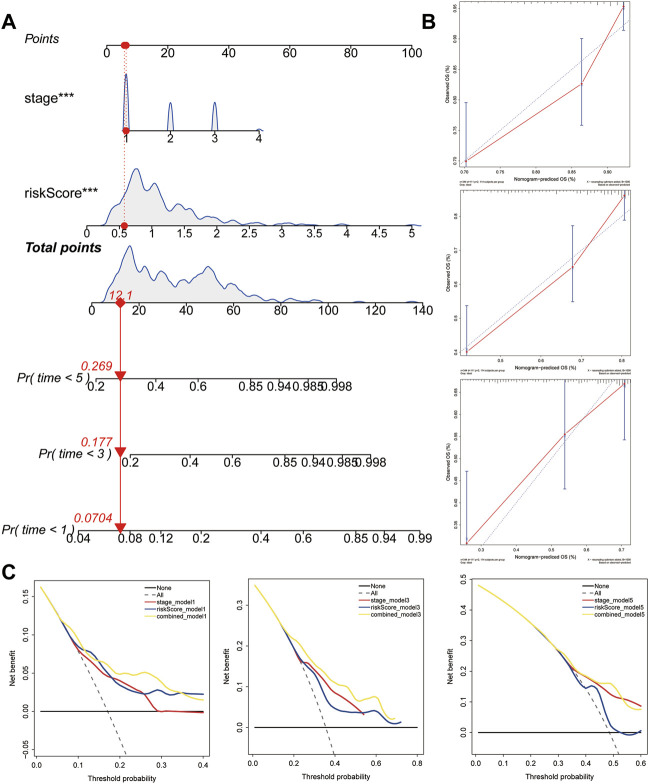
Background: The spliceosome plays an important role in mRNA alternative splicing and is aberrantly expressed in several tumors. However, the potential roles of spliceosome-related genes in the progression of hepatocellular carcinoma (HCC) remain poorly understood. Materials and Methods: Patient data were acquired from public databases. Expression differences and survival analyses were used to assess the importance of spliceosome-related genes in HCC prognosis. To explore the potential regulatory mechanisms of these genes, a protein-protein interaction network was constructed and screened using univariate and multivariate Cox regression and random forest analyses. This was used to create a five-gene prognostic model. The prognostic value and predictive power of the five-gene signature were assessed using the Kaplan-Meier and time-dependent receiver operating characteristic analyses in the training set. These results were further validated in an independent external set. To facilitate clinical application, a nomogram was prepared to predict the overall survival of HCC patients. The relative expression of five genes was detected using real-time quantitative polymerase chain reaction. Results: The analysis revealed that LSM1-7, SNRPB, SNRPD1-3, SNRPE, SNRPF, SNRPG, and SNRPN could be used as prognostic biomarkers in HCC patients. Moreover, the five-gene risk model could clearly distinguish between the high-and low-risk groups. Furthermore, the risk model was associated with the tumor mutation burden, immune cell infiltration of CD8+ T cells, natural killer T cells, M2 macrophages, and immune checkpoint inhibitors, which also demonstrated the predictive efficacy of this risk model in HCC immunotherapy. Conclusion: Spliceosome-related genes and the five-gene signature could serve as novel prognostic biomarkers for HCC patients, aiding clinical patient monitoring and follow-up.

Keywords: HCC; TMB; immune cell; prognostic genes; snRNP.


Conflict of interest statement

The authors declare that the research was conducted in the absence of any commercial or financial relationships that could be construed as a potential conflict of interest.

Figures

FIGURE 1
FIGURE 1
Comparison of spliceosome-related genes in the TCGA and ICGC cohort. Expression difference of LSM1-7, SNRPB, SNRPD1-3, SNRPE, SNRPF, SNRPG, and SNRPN between HCC tumor and non-tumor tissues in TCGA (A) and ICGC (B) cohort. tumor and paired tumor-adjacent tissues from the TCGA cohort. Comparison of spliceosome-related genes expression of patients with different clinical stages (C) and histologic grade (D) from the TCGA cohort. (E) Comparison of spliceosome-related genes expression of patients with different clinical stages from the ICGC cohort. (G) means histological grade, and stage means pathologic TNM staging. *p < 0.05, **p < 0.01, ***p < 0.001.
FIGURE 2
FIGURE 2
Survival analysis of spliceosome-related genes for HCC patients in TCGA cohort. Overall survival of LSM1 (A), LSM2 (B), LSM3 (C), LSM4 (D), LSM5 (E), LSM7 (F), SNRPB (G), SNRPD1 (H), SNRPD2 (I), SNRPE (J), SNRPF (K), and SNRPG (L) were performed by Kaplan-Meier plotter.
FIGURE 3
FIGURE 3
Survival analysis of spliceosome-related genes for HCC patients in ICGC cohort. Overall survival of LSM2 (A), LSM3 (B), LSM4 (C), LSM5 (D), LSM7 (E), SNRPB (F), SNRPD1 (G), SNRPD2 (H), SNRPD3 (I) SNRPE (J), SNRPF (K), and SNRPG (L) were performed by Kaplan-Meier plotter.
FIGURE 4
FIGURE 4
| Expression correlation among spliceosome-related genes and construction of protein-protein interaction (PPI) network. Expression correlation among spliceosome-related genes in the TCGA (A) and (B) cohort. (C) The location of spliceosome-related genes on chromosomes. (D) The PPI network of spliceosome-related genes was built based on the GeneMANIA database. (E) Gene ontology enrichment analysis of spliceosome-related genes. (F) KEGG enrichment analysis of spliceosome-related genes.
FIGURE 5
FIGURE 5
Generation of the prognostic signature. (A) The univariate Cox regression was applied to filter spliceosome-related genes related to overall survival. (B) The random forest was used to screen and rank the relative important gene for overall survival. (C) The Kaplan-Meier (K–M) plotter was employed to evaluate the prognostic value of 1,023 combinations, the top 20 was identified and sorted according to the p value of (K-M). (D) Kaplan-Meier curves stratified by the five-gene prognostic signature in the TCGA cohort (E) Risk score distribution and survival overview in the TCGA cohort. (F) Principal component analysis (PCA) indicated the risk model has high discriminatory accuracy in distinguishing low-risk group from high-risk groups. (G) Pie charts showing the Chi-squared test of clinicopathologic factors for risk model in HCC. (H) Univariate and multivariate association of the prognostic model and clinicopathological characteristics with overall survival in the TCGA cohort. (I) Time‐dependent ROC curves of the signature and clinical stage in the TCGA cohort.
FIGURE 6
FIGURE 6
Validation of the gene signature in ICGC cohort. (A) The Kaplan-Meier analysis of the signature in ICGC cohort. (B) Risk score distribution and survival overview in the ICGC cohort. (C) Principal component analysis showed that the high- and low-risk groups exhibited distinct layout modes. (D) Pie charts showing the Chi-squared test of clinicopathologic factors for risk model in HCC. (E) Univariate and multivariate association of the prognostic model and clinicopathological characteristics with overall survival in the ICGC cohort. (F) Time‐dependent ROC curves of the signature and clinical stage in the ICGC cohort.
FIGURE 7
FIGURE 7
Potential therapeutic value of the gene signature. (A) The distribution of tumor mutation burden in the high- and low-risk groups. Waterfall plot of tumor somatic mutations in HCC patients with high-risk scores (B) and low-risk scores (C). (D) The distribution of high- and low-risk group in mutation and wild TP53. (E) The expression landscape of immune checkpoint inhibitor in high- and low-risk group. The distribution of immune cells calculated by ssGSEA (F) and CIBERSORT (G) in the TCGA cohort. *p < 0.05, **p < 0.01, ***p < 0.001.
FIGURE 8
FIGURE 8
Construction and validation of the predictive nomogram. (A) Nomogram predicting 1‐, 3‐ and 5‐years OS for HCC patients. The nomogram is applied by adding up the points identified on the points scale for each variable. The total points projected on the bottom scales indicate the probability of 1‐, 3‐ and 5‐years OS. (B) The calibration curve for predicting 1‐, 3‐ and 5‐years OS for patients with HCC. (C) Relations between net benefit and threshold probability at 1-year, 3-years, and 5-years survival predictions.
FIGURE 9
FIGURE 9
The mRNA expression of five genes. The relative expression of ATXN2 (A), EDC3 (B), LSM10 (C), PRPF3 (D), and SNRPB (E) was detected in HCC cell lines and human normal liver cell. ***p < 0.001.

References

    1. Ayoub W. S., Steggerda J., Yang J. D., Kuo A., Sundaram V., Lu S. C. (2019). Current Status of Hepatocellular Carcinoma Detection: Screening Strategies and Novel Biomarkers. Ther. Adv. Med. Oncol. 11, 1758835919869120. 10.1177/1758835919869120 - DOI - PMC - PubMed
    1. Bearss J. J., Padi S. K., Singh N., Cardo-Vila M., Song J. H., Mouneimne G., et al. (2021). EDC3 Phosphorylation Regulates Growth and Invasion through Controlling P-Body Formation and Dynamics. EMBO Rep. 22 (4), e50835. 10.15252/embr.202050835 - DOI - PMC - PubMed
    1. Berhane S., Toyoda H., Tada T., Kumada T., Kagebayashi C., Satomura S., et al. (2016). Role of the GALAD and BALAD-2 Serologic Models in Diagnosis of Hepatocellular Carcinoma and Prediction of Survival in Patients. Clin. Gastroenterol. Hepatol. 14 (6), 875–886. 10.1016/j.cgh.2015.12.042 - DOI - PubMed
    1. Bray F., Ferlay J., Soerjomataram I., Siegel R. L., Torre L. A., Jemal A. (2018). Global Cancer Statistics 2018: GLOBOCAN Estimates of Incidence and Mortality Worldwide for 36 Cancers in 185 Countries. CA: A Cancer J. Clinicians 68 (6), 394–424. 10.3322/caac.21492 - DOI - PubMed
    1. Chen W., Ou M., Tang D., Dai Y., Du W. (2020). Identification and Validation of Immune-Related Gene Prognostic Signature for Hepatocellular Carcinoma. J. Immunol. Res. 2020, 5494858. 10.1155/2020/5494858 - DOI - PMC - PubMed