. 2022 Feb 23:9:811145.
doi: 10.3389/fmolb.2022.811145. eCollection 2022.

Three-Dimensional Model of Sub-Plasmalemmal Ca2+ Microdomains Evoked by T Cell Receptor/CD3 Complex Stimulation

Affiliations

Three-Dimensional Model of Sub-Plasmalemmal Ca2+ Microdomains Evoked by T Cell Receptor/CD3 Complex Stimulation

Diana Gil et al. Front Mol Biosci. .

Abstract

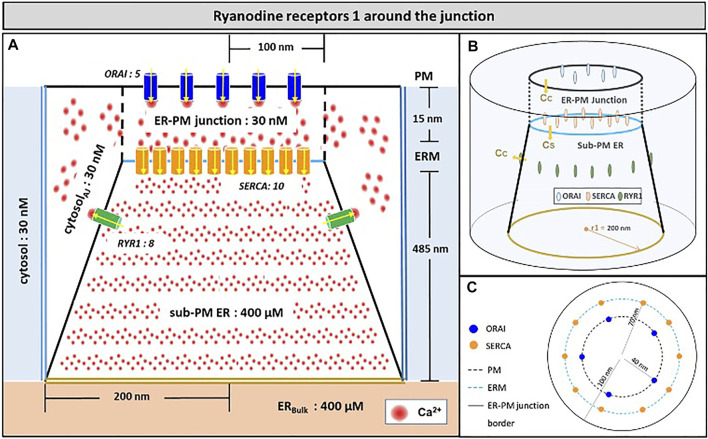
Ca2+ signalling plays an essential role in T cell activation, which is a key step to start an adaptive immune response. During the transition from a quiescent to a fully activated state, Ca2+ microdomains of reduced spatial and temporal extents develop in the junctions between the plasma membrane and the endoplasmic reticulum (ER). These microdomains rely on Ca2+ entry from the extracellular medium, via the ORAI1/STIM1/STIM2 system that mediates store operated Ca2+ entry Store operated calcium entry. The mechanism leading to local store depletion and subsequent Ca2+ entry depends on the activation state of the cells. The initial, smaller microdomains are triggered by D-myo-inositol 1,4,5-trisphosphate (IP3) signalling in response to T cell adhesion. T cell receptor (TCR)/CD3 stimulation then initiates nicotinic acid adenine dinucleotide phosphate signalling, which activates ryanodine receptors (RYR). We have recently developed a mathematical model to elucidate the spatiotemporal Ca2+ dynamics of the microdomains triggered by IP3 signalling in response to T cell adhesion (Gil et al., 2021). This reaction-diffusion model describes the evolution of the cytosolic and endoplasmic reticulum Ca2+ concentrations in a three-dimensional ER-PM junction and was solved using COMSOL Multiphysics. Modelling predicted that adhesion-dependent microdomains result from the concerted activity of IP3 receptors and pre-formed ORAI1-STIM2 complexes. In the present study, we extend this model to include the role of RYRs rapidly after TCR/CD3 stimulation. The involvement of STIM1, which has a lower KD for Ca2+ than STIM2, is also considered. Detailed 3D spatio-temporal simulations show that these Ca2+ microdomains rely on the concerted opening of ∼7 RYRs that are simultaneously active in response to the increase in NAADP induced by T cell stimulation. Opening of these RYRs provoke a local depletion of ER Ca2+ that triggers Ca2+ flux through the ORAI1 channels. Simulations predict that RYRs are most probably located around the junction and that the increase in junctional Ca2+ concentration results from the combination between diffusion of Ca2+ released through the RYRs and Ca2+ entry through ORAI1 in the junction. The computational model moreover provides a tool allowing to investigate how Ca2+ microdomains occur, extend and interact in various states of T cell activation.

Keywords: COMSOL; ER-PM junctions; NAADP; T cells; ca2+ signalling; computational model; ryanodine receptors; store operated calcium entry.


Conflict of interest statement

The authors declare that the research was conducted in the absence of any commercial or financial relationships that could be construed as a potential conflict of interest.

Figures

FIGURE 1
FIGURE 1
Schematic representation of the model geometry of the ER-PM junction and sub-PM ER used to investigate the origin of the Ca2+ microdomains in T cells with nine RYR1 inside the junction (A) Frontal diagram showing the dimensions of the cone that represents the sub-PM ER, of the junction and of the portion of the cytosol considered in the simulations. ORAI1 channels are in blue, SERCA pumps in orange and RYR1 in green. Plain lines represent membrane boundaries; dashed lines, fictitious limits between the junction and the cytosol and double lines indicate the limits of the simulated system. The resting Ca2+ concentrations considered as initial conditions and boundary conditions in the two compartments are indicated. (B) 3D view of the model geometry (C) Upper view of the positions of the ORAI1 channels on the PM, in blue, and of the SERCA pumps and RYR1 (in a chessboard manner) on the ERM, in orange and green respectively. Not to scale. This geometry is based on McIvor et al. (2018). See text for details.
FIGURE 2
FIGURE 2
Simulated Ca2+ microdomains resulting from the opening of RYR1 inside the junctions, which in turn induces the opening of ORAI1 channels in the junctions as a result of local depletion of ER Ca2+ (A) Upper view of the arrangement of the ORAI1 channels on the PM of the junction (yellow dots) and of the RYR1 on the ERM (red dots) using COMSOL (B–F) Steady-state Ca2+ profiles in the junction when opening 1, 2, 4, 6 and 9 RYR1 simultaneously (B) to (F) respectively. Shown are the profiles 22 ms after opening of the RYR1, but these stabilize very rapidly, after a few ms (G) Extended colour code with marking of the average amplitude of a microdomain in unstimulated T cells (Diercks et al., 2018) (H) Evolution of the amplitude of the simulated Ca2+ microdomains with the number of simultaneously open RYR1 in the junction, showing that experimentally observed microdomains do not agree with the opening of the RYRs inside the junction given the low contribution of the opening of the ORAI1 in conditions of a full ER (see text). Dotted line represents junctional Ca2+ concentration reached in the absence of ORAI1 channels (I) Individual evolution of 1–5 ORAI1 channels open state (Li et al., 2011) as a result of 0–9 RYR1 opening simultaneously. See Supplementary Information and Anim. S1a,b for details.
FIGURE 3
FIGURE 3
Influence of the value of the distance between the PM and the ERM on the Ca2+ microdomains in the ER-PM junction. The green curve (15 nm) corresponds to the situation considered in Figure 2. Larger distances, blue curve (30 nm) and orange curve (50 nm) do not influence the low contribution of the opening of the ORAI1 to the Ca2+ concentration increase in the junction. Dotted lines represent junctional Ca2+ concentration reached in the absence of ORAI1 channels.
FIGURE 4
FIGURE 4
Schematic representation of the model geometry of the ER-PM junction and sub-PM ER used to investigate the origin of the Ca2+ microdomains in T cells with eight RYR1 around the junction (A) Frontal diagram showing the dimensions of the cone that represents the sub-PM ER, of the junction and of the portion of the cytosol considered in the simulations. ORAI1 channels are in blue, SERCA pumps in orange and RYR1 in green. Plain lines represent membrane boundaries; dashed lines, fictitious limits between the junction and the cytosol and double lines indicate the limits of the simulated system. The resting Ca2+ concentrations considered as initial conditions and boundary conditions in the two compartments are indicated. (B) 3D view of the model geometry (C) Upper view of the positions of the ORAI1 channels on the PM, in blue, and of the SERCA pumps and RYR1 on the ERM, in orange and green respectively. Not to scale. This geometry is based on McIvor et al. (2018). See text for details.
FIGURE 5
FIGURE 5
Simulated Ca2+ microdomains resulting from the opening of the RYR1 adjacent to the junctions, which in turn induces the opening of ORAI1 channels in the junctions as a result of local depletion of ER Ca2+ (A) Upper view of the arrangement of the ORAI1 channels on the PM of the junction (red dots) and of the adjacent RYR1 (yellow lines) using COMSOL (B–I) Steady-state Ca2+ profiles in the junction when opening 1 (B) to 8 (I) RYR1 simultaneously. Shown are the profiles 22 ms after opening of the RYR1. Upon depletion of local Ca2+ in the ER, which is quasi-instantaneous, ORAI1 channels open to an extent that depends on this local concentration, as defined by the function f 2/1 (see Supplementary Information). ORAI1 opening is assumed to occur immediately after depletion because ORAI1-STIM1/2 aggregates are pre-formed (Weiss and Diercks, unpublished results). (J) Evolution of the amplitude of the simulated Ca2+ microdomains with the number of simultaneously open RYR1 in the junction, showing that experimentally observed microdomains can in principle result from the opening of ORAI1 channels induced by the spontaneous opening of a few RYR1 near the junction, in conditions of a full ER. Dotted line represents junctional Ca2+ concentration reached in the absence of ORAI1 channels. See Anim. S2a,b,c,d and S3 in Supplementary Information.
FIGURE 6
FIGURE 6
Simulated Ca2+ microdomains resulting from the opening of up to 16 RYR1 adjacent to the junctions (A) Evolution of the amplitude of the simulated Ca2+ microdomains in the presence (green curve) and in the absence of ORAI1s (dotted green curve) in the junction. Both green curves, up to eight simultaneously open RYR1, correspond to the situation considered in Figure 5. The theoretical situation of a junction that does not contain ORAI1 channels (dotted green curve) allows to appreciate that the contribution of Ca2+ released through the RYR1 to the Ca2+ microdomain is linear and rather limited. At eight simultaneously open RYR1 (green curve), the complete cluster of five ORAI1 channels reach their maximum open state possible, in conditions of a full ER (B) Individual evolution of 1–5 ORAI1 channels open state (Li et al., 2011) as a result of 1–16 RYR1 opening simultaneously. See Supplementary Information for details.
FIGURE 7
FIGURE 7
Cross-section of the Ca2+ profiles in the junction, in the cytosol adjacent to the junction and in the sub-PM ER during microdomain formation (A–D) microdomains created by the opening of 2, 4, 6 and 8 RYR1. Local depletion of ER Ca2+ provokes the opening of the nearby ORAI1s. This situation corresponds to the one shown in Figure 5. (E,F) microdomains created by the opening of 12 and 16 RYR1, respectively. The second cluster of eight RYR1 is located directly underneath the first cluster. Local depletion of ER Ca2+ is not enough to provoke additional opening of the nearby ORAI1s. This situation corresponds to the one shown in Figure 6. For all panels, the upper right bar indicates the colour code of Ca2+ concentration in the cytosol while the lower right bar indicates the colour code of Ca2+ concentration in the ER. See Anim. S4.
FIGURE 8
FIGURE 8
Frequency of simultaneously open receptors in a cluster of eight RYR1 during 64 ms that corresponds to the duration of a Ca2+ spark (A) During a spark when RYR1 are maximally activated by NAADP, there are most of the time around five to six simultaneously open RYR1, with a single receptor open probability of 0.7 (Hohenegger et al., 2002). This is in agreement with the results seen in Figure 5. (B) At basal NAADP concentration, the single receptor open probability is around 0.4, and there are continuously around three to four simultaneously open RYR1, which is not enough to reach the experimental Ca2+ amplitude. In the two panels, the stochastic simulations of opening and closing of individual receptors are performed during 64 ms.
FIGURE 9
FIGURE 9
Influence of the nature of the ER Ca2+ channel inducing the local depletion of ER Ca2+ (IP3R or RYR1) and of the STIM isoforms bound to ORAI1 on the characteristics of Ca2+ microdomains (A) Evolution of Ca2+ microdomains amplitude with the number of simultaneously open RYR1 in the junction. The microdomains observed in conditions of full ER can be induced by the spontaneous opening of a few RYR1 near the junction that in turn trigger the opening of ORAI1 channels bound to STIM2/2 (blue curve) or to STIM1/2 (green curve). ORAI1 channels open to an extent that depends on local ER Ca2+ concentration, as defined by the corresponding function f 2 or f 2/1 (see Supplementary Information) (B) Individual evolution between the 5 open states of the ORAI1 (Li et al., 2011), as a result of 1–8 RYR1 opening simultaneously. (C) Comparison of Ca2+ fluxes through open IP3Rs and RYR1. Because of the slow replenishment around the pore of the receptor channel with DS = 10 μm2/s, the concentration gradient around the two extremities of the pore does not changes drastically and hence the flux remains of the same order for IP3Rs and RYR1.
FIGURE 10
FIGURE 10
Simulated most probable Ca2+ microdomains resulting from a T cell transition between quiescent to early activation. (A) Non TCR/CD3-dependent Ca2+ microdomains formed by the opening of two IP3Rs adjacent to the junction and further opening of ORAI1 channels bound to STIM2/2 (B) Basal opening of five ORAI1 channels, one inherently co-localized with STIM2/2 and four inherently co-localized with STIM1/2 leading to small microdomains arising from nano-scale [Ca2+] fluctuations in the sub-PM ER. Artificial construction (C) TCR/CD3-dependent Ca2+ microdomains formed by the opening of six RYR1 adjacent to the junction and further opening of ORAI1 channels bound to STIM1/2. See Anim. S5a,b,c in the Supplementary Information. (D) Ca2+ profiles along the yellow dotted line shown in A that traverses the middle of the junction at a 7.5 nm distance from the PM, corresponding to panels A, B and C.
FIGURE 11
FIGURE 11
Schematized representation of the proposed mechanism underlying the spontaneous formation of Ca2+ microdomains in T cells during its transition from quiescent to early activation (A) In an otherwise unstimulated cell, non TCR/CD3 dependent short, spontaneous activation of one or a few IP3Rs close to the junction, releases Ca2+ from the sub-PM ER into the cytosol, leading to further opening of ORAI1 channels most likely bound to STIM2/2 at this stage (Weiss and Diercks, unpublished results) (B) During the first 15 s following TCR/CD3 stimulation, and NAADP driven activation of several RYR1 close to the junction, slightly larger amount of Ca2+ is released from the sub-PM ER into the cytosol. The resulting local Ca2+ depletion close to the RYR1 pore provokes the unbinding of Ca2+ from STIM1/2 heterotetramers, which further activates ORAI1 channels (Diercks et al., 2018). Red spots represent Ca2+ ions.

Similar articles

Cited by

References

    1. Ahmad M., Ong H. L., Saadi H., Son G. Y., Shokatian Z., Terry L. E., et al. (2021). Functional Communication between IP3R and STIM2 at Sub-threshold Stimuli Is a Critical Checkpoint for Initiation of SOCE. Proc. Natl. Acad. Sci. U S A 119 (3), e2114928118. 10.1073/pnas.2114928118 - DOI - PMC - PubMed
    1. Bootman M., Niggli E., Berridge M., Lipp P. (1997). Imaging the Hierarchical Ca2+ Signalling System in HeLa Cells. J. Physiol. 499, 307–314. 10.1113/jphysiol.1997.sp021928 - DOI - PMC - PubMed
    1. Brandman O., Liou J., Park W. S., Meyer T. (2007). STIM2 Is a Feedback Regulator that Stabilizes Basal Cytosolic and Endoplasmic Reticulum Ca2+ Levels. Cell 131 (7), 1327–1339. 10.1016/j.cell.2007.11.039 - DOI - PMC - PubMed
    1. Dagan I., Palty R. (2021). Regulation of Store-Operated Ca2+ Entry by SARAF. Cells 10, 1887. 10.3390/cells10081887 - DOI - PMC - PubMed
    1. des Georges A., Clarke O. B., Zalk R., Yuan Q., Condon K. J., Grassucci R. A., et al. (2016). Structural Basis for Gating and Activation of RyR1. Cell 167 (1), 145–157. 10.1016/j.cell.2016.08.075 - DOI - PMC - PubMed