. 2022 Mar 3:2022:6571987.
doi: 10.1155/2022/6571987. eCollection 2022.

Analysis of Potential Hub Genes for Neuropathic Pain Based on Differential Expression in Rat Models

Affiliations

Analysis of Potential Hub Genes for Neuropathic Pain Based on Differential Expression in Rat Models

Jie Bai et al. Pain Res Manag. .

Abstract

Objective: Neuropathic pain (NP) is a type of intractable chronic pain with complicated etiology. The exact molecular mechanism underlying NP remains unclear. In this study, we searched for molecular biomarkers of NP.

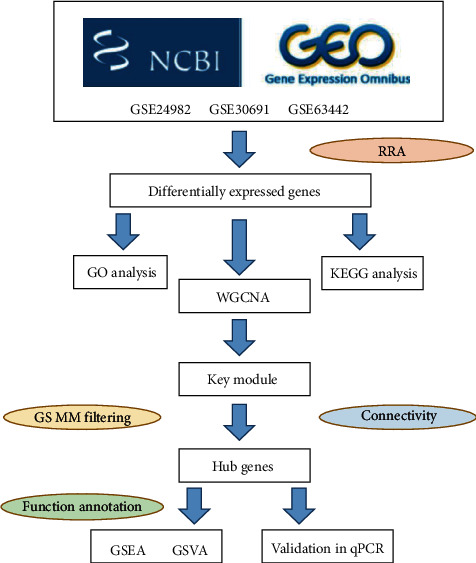
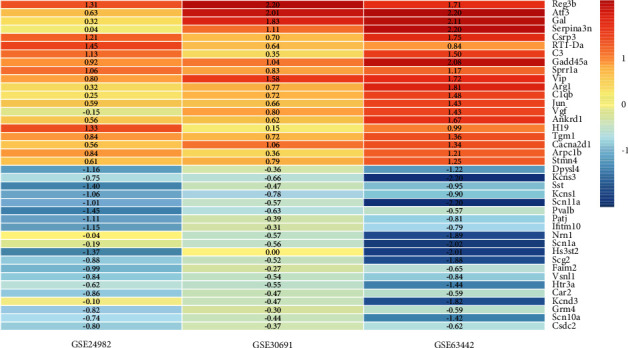
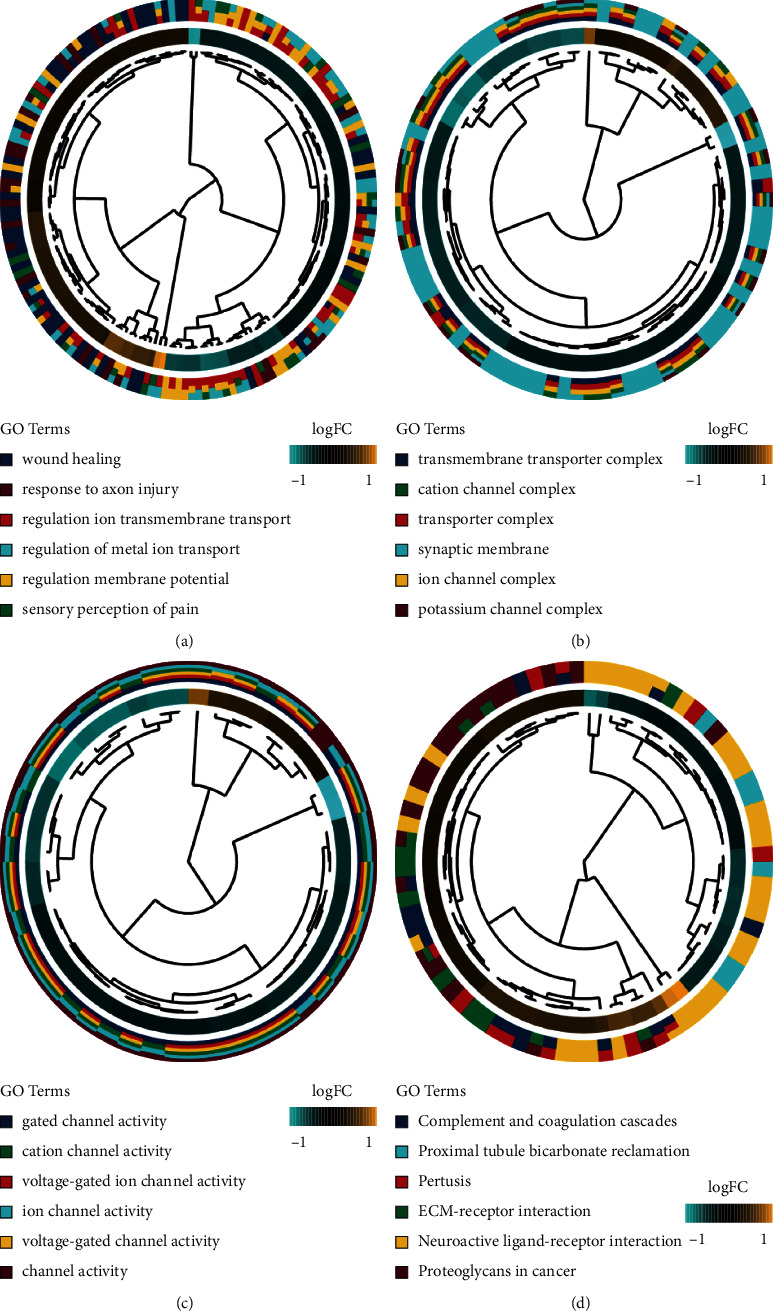
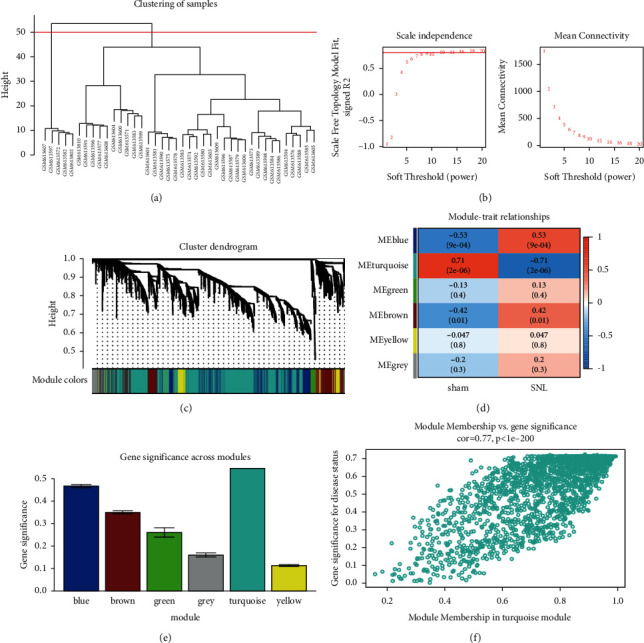
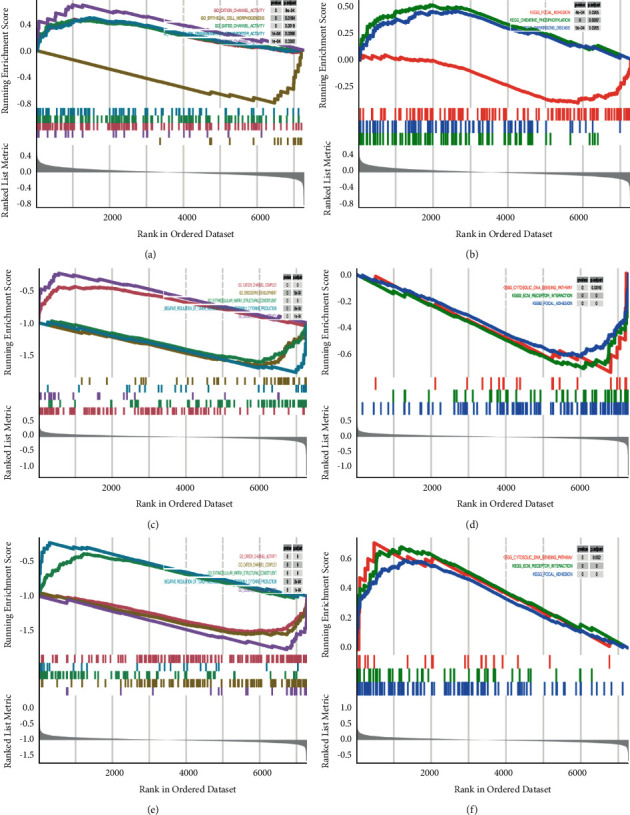
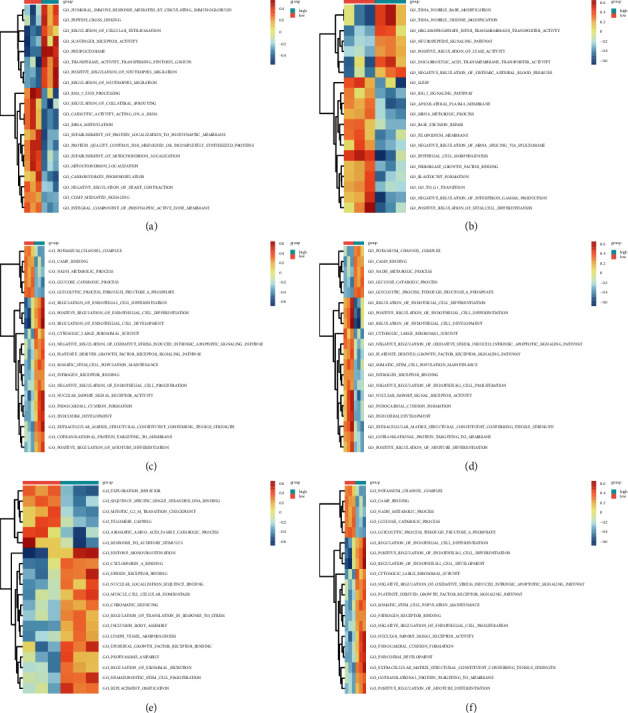
Methods: Differentially expressed genes (DEGs) were predicted by analyzing three NP-related microarray datasets in Gene Expression Omnibus with robust rank aggregation. A weighted gene coexpression network analysis was conducted to construct a network of differentially expressed genes, followed by the evaluation of correlations between gene sets and the determination of hub genes. The candidate genes from the key module were identified using a gene set enrichment analysis.

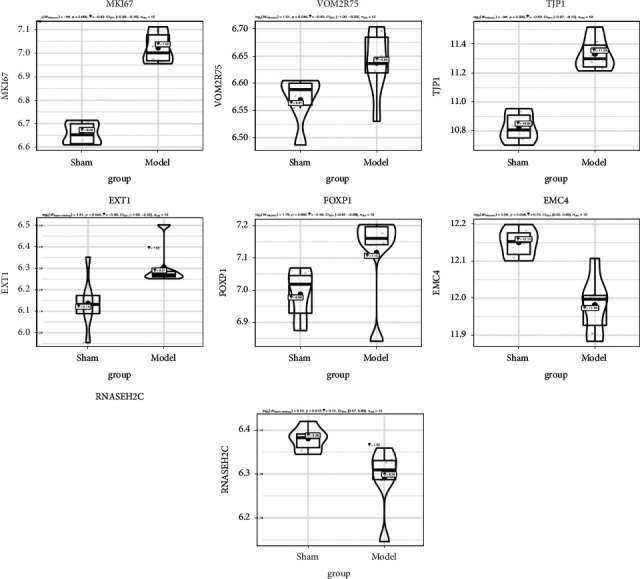
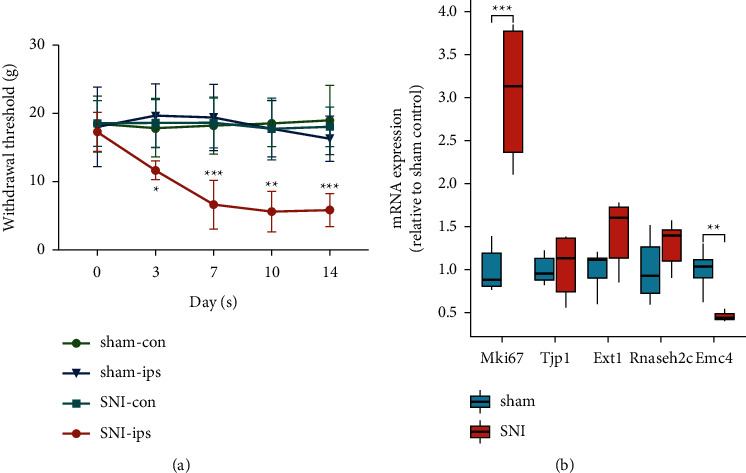
Results: In total, 353 upregulated and 383 downregulated genes were obtained, among which five hub genes were determined to be related to pain phenotypes. Reverse transcription-quantitative polymerase chain reaction was performed to verify the expression of these hub genes in the dorsal root ganglia of rats with spared nerve injury, which revealed the decreased expression of EMC4. Hence, EMC4 was defined as a biomarker for NP development.

Conclusions: The results of this study form a basis for further research into the mechanism of NP development and are expected to aid in the development of novel therapeutic strategies.


Conflict of interest statement

The authors declare that there are no conflicts of interest regarding the publication of this work.

Figures

Figure 1
Figure 1
The workflow of our study. GEO, Gene Expression Omnibus; GO, Gene Ontology; KEGG, Kyoto Encyclopedia of Genes and Genomes; WGCNA, weighted gene coexpression network analysis; GS, gene significance; MM, module membership; GSEA, gene set enrichment analysis; GSVA, gene set variation analysis.
Figure 2
Figure 2
The heatmap of the top 20 upregulated and downregulated genes identified by RRA analysis. Each column represented a dataset, and each row represented one gene. Red represented upregulated genes, while blue represented downregulated genes. The Limma R package was utilized to calculate the logarithmic fold change of each dataset, which was expressed with the numbers in the heatmap. DEG, differentially expressed gene; RRA, robust rank aggregation.
Figure 3
Figure 3
The GO and KEGG analyses of the DEGs identified by the RRA analysis. (A-C) The Chord plot of GO enrichment analysis of the DEGs in three parts: biological process (BP), cellular component (CC), and molecular function (MF). (D) The Chord plot of KEGG pathways enrichment analysis of the DEGs. GO, Gene Ontology; KEGG, Kyoto Encyclopedia of Genes and Genomes; RRA, robust rank aggregation.
Figure 4
Figure 4
WGCNA. (a) The Cluster dendrogram of the module eigengenes. (b) The selection of soft-thresholding powers through scale-free topology fit index and mean connectivity among genes. (c) The cluster dendrogram of all DEGs based on the dissimilarity measure and the assignment modules. (d) The heatmap of module-trait correlations. The number in each small box represented the corresponding correlation and P value. (e) The identification of modules related to NP. The horizontal axis indicated the name of modules, and the vertical axis indicated the gene significance value. (f) The scatter plot of GS and MM for genes in the turquoise module. DEG, differentially expressed gene; WGCNA, weighted gene coexpression network analysis.
Figure 5
Figure 5
The selection and verification of the candidate hub genes. The expression of MKI67, VOM2R75, TJP1, EXT1, FOXP1, EMC4, and RNASEH2C differed between the two groups. The genes with the highest connectivity were screened out by WGCNA. To validate the expression data of these genes, the GSE63442 and GSE30691 datasets were selected for pairwise validation by independent t-test. The ggstatsplot package was used to perform t-test and plot graphs. GEO, Gene Expression Omnibus. Statistical analysis was conducted using the independent t-test. Plots represented mean ± 95% confidence interval (CI).
Figure 6
Figure 6
The GSEA of the candidate hub genes in the GEO dataset. (A) C, (E) GSEA of the single candidate hub genes in GO terms according to the normalized enrichment scores. (C) MKI67, (G) EMC4, (M) RNASEH2C. (B) D, (F) GSEA of the single candidate hub genes in the KEGG pathway. (D) MKI67, (H) EMC4, (N) RNASEH2C. GEO, Gene Expression Omnibus; GO, Gene Ontology; GSEA, gene set enrichment analysis.
Figure 7
Figure 7
The GSVA of the candidate hub genes. There existed GSVA-derived clustering heatmaps between the single candidate hub genes and the GO terms. Only signaling pathways with log(fold change) > 0.2 are presented. (a) VOM2R75, (b) MKI67, (c) TJP1, (d) EMC4, (e) FOXP1, (f) RNASEH2C. GEO, Gene Expression Omnibus; GO, Gene Ontology; GSVA, gene set variation analysis.
Figure 8
Figure 8
PWT changes after SNI surgery in rats and experimental validation of the expression of hub genes. (a) Compared with the sham-operated rats, the PWT of SNI rats decreased from day 3 after surgery. The withdrawal threshold was evaluated by von Frey filaments as a response evoked by a mechanical stimulus over time. The data in the sham and SNI groups were normally distributed. Repeated measures ANOVA followed by Tukey's multiple comparisons test was used to evaluate mechanical hyperalgesia, and data were expressed as mean ± standard deviation.  , P < 0.05,  ∗∗, P < 0.01,  ∗∗∗, P < 0.001, compared with the sham-ips group on the corresponding days. (b) The expression of the five hub genes in DRG tissue after SNI surgery was validated by RT-qPCR. The data in the two groups were normally distributed. Unpaired Student's (t) test was carried out, and the data were expressed as mean ± standard deviation.  ∗∗, P < 0.01,  ∗∗∗, P < 0.001 compared with the Sham group. DRG, dorsal root ganglia; SNI, spared nerve injury; PWT, paw withdrawal threshold.

References

    1. Murnion B. P. Neuropathic pain: current definition and review of drug treatment. Australian Prescriber . 2018;41(3):60–63. doi: 10.18773/austprescr.2018.022. - DOI - PMC - PubMed
    1. Burke D., Fullen B. M., Stokes D., Lennon O. Neuropathic pain prevalence following spinal cord injury: a systematic review and meta-analysis. European Journal of Pain . 2017;21(1):29–44. doi: 10.1002/ejp.905. - DOI - PubMed
    1. Zhou J., Fan Y., Chen H. Analyses of long non-coding RNA and mRNA profiles in the spinal cord of rats using RNA sequencing during the progression of neuropathic pain in an SNI model. RNA Biology . 2017;14(12):1810–1826. doi: 10.1080/15476286.2017.1371400. - DOI - PMC - PubMed
    1. Jacobs J. M., Macfarlane R. M., Cavanagh J. B. Vascular leakage in the dorsal root ganglia of the rat, studied with horseradish peroxidase. Journal of the Neurological Sciences . 1976;29(1):95–107. doi: 10.1016/0022-510x(76)90083-6. - DOI - PubMed
    1. Parisien M., Khoury S., Chabot-Doré A.-J., et al. Effect of human genetic variability on gene expression in dorsal root ganglia and association with pain phenotypes. Cell Reports . 2017;19(9):1940–1952. doi: 10.1016/j.celrep.2017.05.018. - DOI - PMC - PubMed

Publication types

LinkOut - more resources