. 2022 Feb 23:12:746746.
doi: 10.3389/fcimb.2022.746746. eCollection 2022.

Insights Into the Impact of Small RNA SprC on the Metabolism and Virulence of Staphylococcus aureus

Affiliations

Insights Into the Impact of Small RNA SprC on the Metabolism and Virulence of Staphylococcus aureus

Jingwen Zhou et al. Front Cell Infect Microbiol. .

Abstract

Aim: Our previous proteomic analysis showed that small RNA SprC (one of the small pathogenicity island RNAs) of Staphylococcus aureus possesses the ability to regulate the expression of multiple bacterial proteins. In this study, our objective was to further provide insights into the regulatory role of SprC in gene transcription and metabolism of S. aureus.

Methods: Gene expression profiles were obtained from S. aureus N315 wild-type and its sprC deletion mutant strains by RNA-sequencing (RNA-seq), and differentially expressed genes (DEGs) were screened by R language with a |log2(fold change)| ≥1 and a false discovery rate (FDR) ≤ 0.05. Gene Ontology (GO) and Kyoto Encyclopedia of Genes and Genomes (KEGG) pathway analysis were carried out to understand the significance of the DEGs. The quality of RNA-seq was further verified by quantitative real-time PCR (qRT-PCR), mRNA target prediction, metabolomics analysis and transcript-level expression analysis of genes of sprC complementation strain.

Results: A total of 2497 transcripts were identified, of which 60 transcripts expressions in sprC knockout strain were significantly different (37 up-regulated and 23 down-regulated DEGs). GO analysis showed that the functions of these DEGs were mainly concentrated in the biological process and molecular function related to metabolism and pathogenesis, and a higher number of genes were involved in the oxidation-reduction process, catalytic activity and binding. KEGG pathways enrichment analysis demonstrated that metabolism and pathogenesis were the most affected pathways, such as metabolic pathways, biosynthesis of secondary metabolites, purine metabolism, fructose and mannose metabolism and S. aureus infection. The qRT-PCR results of the DEGs with defined functions in the sprC deletion and complementation strains were in general agreement with those obtained by RNA-seq. Metabolomics analysis revealed 77 specific pathways involving metabolic pathways. Among them, many, such as metabolic pathways, biosynthesis of secondary metabolites and purine metabolism, were consistent with those enriched in the RNA-seq analysis.

Conclusion: This study offered valuable and reliable information about the regulatory roles of SprC in S. aureus biology through transcriptomics and metabolomics analysis. These results may provide clues for new potential targets for anti-virulence adjuvant therapy on S. aureus infection.

Keywords: SprC; Staphylococcus aureus; metabolomics; regulation role; small RNA; transcriptome.


Conflict of interest statement

The authors declare that the research was conducted in the absence of any commercial or financial relationships that could be construed as a potential conflict of interest.

Figures

Figure 1
Figure 1
RNA-seq analysis of DEGs between wild-type S. aureus N315 and its sprC knockout mutant (N315ΔSprC). DESeq2 v 1.10.1 package was used to identify the DEGs (with a |log2(fold change)| ≥1 and a false discovery rate (FDR) ≤ 0.05). (A) A bar graph visualizing the number of up-regulated (blue color histogram) and down-regulated (red color histogram) genes. The x-axis indicates gene number. (B) A scatter plot revealing the expression discrepancies of genes in two groups. The values of x- and y-axes are the normalized signal values of samples in two groups. Red, the significantly upregulated genes; green, the markedly downregulated genes. (C) A volcano plot demonstrating the DEGs in two groups with P value ≤ 0.05 and |log2(fold change)| ≥ 1 as the threshold. The red dots represent 37 upregulated genes and the green dots show 23 downregulated genes in the N315 group compared with their expression levels in the N315ΔSprC group. Each dot represents one gene. (D) A heat map of DEGs. T1-T3 are wild-type N315 samples and T4-T6 are N315ΔSprC samples. Euclidean distances between samples are used, and each sample value is chosen to plot the DEseq2 rlog-transformed value. Red, upregulated genes; blue, downregulated genes. Each line represents one gene. DEGs, differentially expressed genes.
Figure 2
Figure 2
All the GO terms enriched among the DEGs. Go databases were used to conduct GO functional annotation on the DEGs by R package GOseq v 1.18. All annotated determinants (x-axis) are divided into 3 GO domains: biological process (15 terms), molecular function (4 terms) and cellular component (24 terms). The y-axis suggests the number of DEGs. Green histogram stands for the biological process (BP), the orange histogram indicates cellular component (CC), and the purple histogram represents molecular function (MF). Differential expression profiles are acquired from DEGs in the wild-type and mutant strains, disclosing the impact of SprC on S. aureus metabolism, physiology and pathogenesis. GO, Gene Ontology; DEGs, differentially expressed genes.
Figure 3
Figure 3
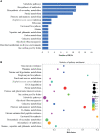
KEGG pathway enrichment analysis of DEGs. KEGG pathway enrichment analysis was conducted based on the KEGG database (R package GOseq v 1.18). (A) Top 15 enriched KEGG pathways among DEGs. These 15 pathways are arranged in the order of number of DEGs, and the pathways enriched the most DEGs are metabolic pathways, followed by biosynthesis of antibiotics, biosynthesis of secondary metabolites and purine metabolism. (B) Visualization of the 20 most significant KEGG enrichment pathway. The 20 most significant pathways were selected by combining three factors: enrichment factor (x-axis), P value (color of the dots) and number of genes enriched (size of the dots). KEGG, Kyoto Encyclopedia of Genes and Genomes; DEGs, differentially expressed genes.
Figure 4
Figure 4
qRT-PCR analysis for validation of expression levels of 43 DEGs with defined function between N315 and N315ΔSprC strains. (A) 19 DEGs were up-regulated after the sprC knockout analyzed by qRT-PCR. (B) 24 DEGs were down-regulated after the sprC deletion. Black bar, strain N315ΔsprC; gray bar, strain N315 *P < 0.05, **P < 0.01, ***P < 0.001, ****P < 0.0001. The consistence of the results between RNA-seq and qRT-PCR analyzed with log2(Fold change) (log2FC) (y-axis) was shown in (C–E). (C, D) 24 up-regulated and 11 down-regulated genes by SprC were validated consistent between both methods. (E) The expressions of 8 genes detected by qRT-PCR were validated opposite to those of RNA-seq. Black bar, qRT-PCR; gray bar, RNA-seq; qRT-PCR, quantitative real-time polymerase chain reaction; DEGs, differentially expressed genes.
Figure 5
Figure 5
Relative expression of sprC in N315 wild-type, knockout and complementation strains. The knockout strain (N315ΔsprC) was constructed via temperature-sensitive plasmid pKOR1 by homologous recombination. The complementation strain (N315ΔsprC-C) was constructed by transferring recombinant plasmid pOS1-sprC into strain N315ΔsprC via electroporation. The levels of expression of sprC in the three strains were detected by qRT-PCR. The sprC is barely expressed in the knock out strain N315ΔsprC, and restored to the level of wild-type strain in the complementation strain N315ΔsprC-C. black bar, N315, the wild-type strain; gray bar, N315ΔsprC, the knock out strain; deep gray bar, N315ΔsprC-C, the complementation strain. ****P < 0.0001.
Figure 6
Figure 6
Histogram of ions and metabolites annotated to KEGG pathways. The fold changes were used to identify differential metabolites based on partial least squares method-discriminant analysis (PLS-DA) and variable importance in projection (VIP) value. Pathways with differential metabolite were enriched using KEGG pathway database. X-axis shows the pathways of level 2 derived from pathways of level 1 (cellular processes, environmental information processing, genetic information processing, human diseases, metabolism and organismal system) in KEGG database. Y-axis shows the number of compounds enriched in the pathway. The significantly enriched pathways (such as global and overview maps, amino acid metabolism and metabolism of other amino acid) are pathways from metabolism (blue bar). KEGG, Kyoto Encyclopedia of Genes and Genomes.

References

    1. Ahn K. B., Baik J. E., Yun C.-H., Han S. H. (2018). Lipoteichoic Acid Inhibits Biofilm Formation. Front. Microbiol. 9, 327. doi: 10.3389/fmicb.2018.00327 - DOI - PMC - PubMed
    1. Akhtar M. M., Micolucci L., Islam M. S., Olivieri F., Procopio A. D. (2019). A Practical Guide to miRNA Target Prediction. Methods Mol. Biol. 1970, 1–13. doi: 10.1007/978-1-4939-9207-2_1 - DOI - PubMed
    1. Ashburner M., Ball C. A., Blake J. A., Botstein D., Butler H., Cherry J. M., et al. . (2000). Gene Ontology: Tool for the Unification of Biology. The Gene Ontology Consortium. Nat. Genet. 25 (1), 25–29. doi: 10.1038/75556 - DOI - PMC - PubMed
    1. Balasubramanian D., Harper L., Shopsin B., Torres V. J. (2017). Staphylococcus Aureus Pathogenesis in Diverse Host Environments. Pathog. Dis. 75 (1), ftx005. doi: 10.1093/femspd/ftx005 - DOI - PMC - PubMed
    1. Caldelari I., Chao Y., Romby P., Vogel J. (2013). RNA-Mediated Regulation in Pathogenic Bacteria. Cold Spring Harb. Perspect. Med. 3 (9), a010298. doi: 10.1101/cshperspect.a010298 - DOI - PMC - PubMed

Publication types

LinkOut - more resources