. 2022 Mar 4:2022:2910491.
doi: 10.1155/2022/2910491. eCollection 2022.

Application of m6A and TME in Predicting the Prognosis and Treatment of Clear Cell Renal Cell Carcinoma

Affiliations

Application of m6A and TME in Predicting the Prognosis and Treatment of Clear Cell Renal Cell Carcinoma

Dongchen Pei et al. J Oncol. .

Abstract

Background: Previous studies have shown that RNA N6-methyladenosine (m6A) plays an important role in the construction of the tumor microenvironment (TME). However, how m6A plays a role in the TME of clear cell renal cell carcinoma remains unclear.

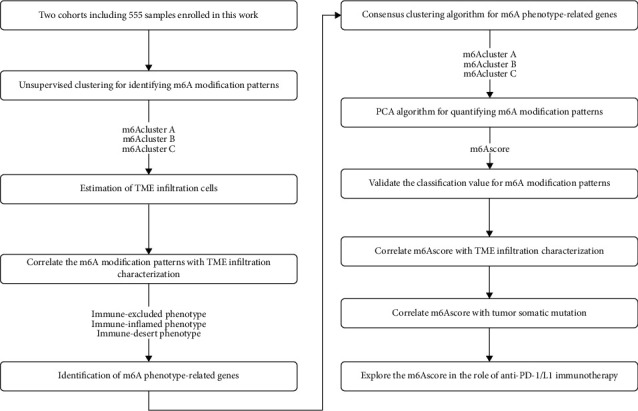
Methods: Based on 23 m6A modulators, we applied consensus cluster analysis to explore the different m6A modification profiles of ccRCC. The CIBERSORT method was employed to reveal the correlation between TME immune cell infiltration and different m6A modification patterns. A m6A score was constructed using a principal component analysis algorithm to assess and quantify the m6A modification patterns of individual tumors.

Results: Three distinct m6A modification patterns of ccRCC were identified. The characteristics of TME cell infiltration in these three patterns were consistent with immune rejection phenotype, immune inflammation phenotype, and immune desert phenotype. In particular, when m6A scores were high, TME was characterized by immune cell infiltration and patient survival was higher (p < 0.05). When m6A scores were low, TME was characterized by immunosuppression and patient survival was lower (p < 0.05). The immunotherapy cohort confirmed that patients with higher m6A scores had significant therapeutic advantages and clinical benefits.

Conclusions: The m6A modification plays an important role in the formation of TME. The m6A scoring system allows the identification of m6A modification patterns in individual tumors, discriminates the immune infiltrative features of TME, and provides more effective prognostic indicators and treatment strategies for immunotherapy.


Conflict of interest statement

The authors declare that they have no conflicts of interest.

Figures

Figure 1
Figure 1
The flow chart of our study of identifying hallmark genes and candidate agents.
Figure 2
Figure 2
(a) The mutation frequency of 23 m6A regulatory factors in 336 patients with clear cell renal cell carcinoma from the TCGA-STAD cohort. Each column represents an individual patient. The bar graph above shows TMB, and the numbers on the right indicate the mutation frequency of each regulator. The bar graph on the right shows the proportions of each variant type. The stacked bar chart below shows the conversion rate in each sample. (b) Frequency of CNV changes in m6A modulators in the GSE29609 cohort. The height of the column represents the frequency of change. Delete frequency, blue dot; zoom in frequency, red dot. (c) The expression of 23 m6A expression factors between normal tissues and clear cell renal cell carcinoma tissues. Tumor, red; normal, blue. The upper and lower ends of the box represent the interquartile range of values. The line in the box represents the median value, and the red or blue dots represent outliers. The asterisk represents the statistical p value (p < 0.05; ∗∗p < 0.01; and ∗∗∗p < 0.001) (d) The position of the CNV change in the m6A regulatory factor on the 23 chromosomes of the GSE29609 cohort.
Figure 3
Figure 3
The patterns of m6A methylation modification and the biological characteristics of each pattern. (a–d) Using unsupervised cluster analysis to show that ccRCC can be divided into three different genotypes (k = 3). (e) Unsupervised clustering of 23 m6A regulatory factors in the clear cell renal cell carcinoma cohort. Survival status, clinical stage, age, project, and m6A cluster are used as patient annotations. Red represents the high expression of regulatory factors, and blue represents low expression. (f) Survival analysis based on three m6A modification patterns of 555 gastric cancer patients from 1 GEO cohort, including 251 cases in m6A cluster-A, 205 cases in m6A cluster-B, and 99 cases in m6A cluster-C. The Kaplan-Meier curve with a log-rank p-value of 0.011 shows a significant difference in survival between the three m6A modification modes. The overall survival rate of m6A cluster-A is significantly better than the other two m6A clusters. (g) Interaction between m6A regulatory factors in clear cell renal cell carcinoma. The size of the circle represents the influence of each adjusting factor on the prognosis, and the numerical ranges calculated by the log-rank test are p < 0.001, p < 0.01, p < 0.05, and p < 0.1, respectively. The purple dots in the circle are prognostic risk factors; the green dots in the circle are prognostic protective factors. The lines connecting the regulators show their interaction, and the thickness shows the relative strength between the regulators. Negative correlations are marked in blue, and positive correlations are marked in red. Writers, erasers, and readers are marked in gray, red, and orange. (h–j) Correlation between the regulators.
Figure 4
Figure 4
(a-b) GSVA enrichment analysis shows the activation status of biological pathways in different m6A modification modes. Heatmaps are used to visualize these biological processes. Red represents activated pathways, and blue represents inhibited pathways. The clear cell renal cell carcinoma cohort was used as sample annotation. A m6A cluster A and m6A cluster B; B m6A cluster B and m6A cluster C. (c) The abundance of each TME-infiltrating cell in the three m6A modification modes. The upper and lower ends of the box represent the interquartile range of values. The lines in the boxes represent the median value, and the black dots represent the outliers. The asterisk represents the statistical p value (p < 0.05; ∗∗p < 0.01; and ∗∗∗p < 0.001). (d) The principal component analysis of the transcriptome profile of the three m6A modification patterns shows significant differences in the transcriptome among different modification patterns.
Figure 5
Figure 5
(a-b) Function annotation, m6A-related genes using GO enrichment analysis, and KEGG enrichment analysis. The color depth of the bubble chart represents the number of enriched genes, and the size of the bubble chart represents the proportion of gene expression. Unsupervised clustering of overlapping m6A phenotype-related genes in the C clear cell renal cell carcinoma cohort to classify patients into different genomic subtypes, respectively, is called m6A gene clusters A-C. Survival status, clinical stage, age, m6A clusters, and gene clusters were used as patient annotations. (c–f) Using unsupervised cluster analysis to show that ccRCC can be divided into three different genotypes (k = 3). (g) A total of 1,152 DEGs were obtained from the three types. (h) Three different m6A modified genome phenotypes were discovered through an unsupervised clustering algorithm, and these three clusters were named m6A gene clusters A, B, and C. (i) Kaplan-Meier curve showed that the m6A modified genome phenotype was significantly correlated with the overall survival of 555 patients in the clear cell renal cell carcinoma cohort, including 296 gene cluster A 120 gene cluster B and 139 gene cluster C (p < 0.0001, log-rank test). (j) The expression of 23 m6A regulatory factors in 3 gene clusters. The upper and lower ends of the box represent the interquartile range of values. The line in the box represents the median value, and the red or yellow dots represent the outliers. The asterisk represents the statistical p value (p < 0.05; ∗∗p < 0.01; and ∗∗∗p < 0.001). One-way analysis of variance is used to test the statistical differences between the three gene clusters.
Figure 6
Figure 6
(a-b) Waterfall plots of tumor somatic mutations established by those with high m6A score (a) and low m6A score (b). Each column represents a single patient. The bar graph above shows TMB, and the numbers on the right indicate the mutation frequency of each gene. The bar graph on the right shows the proportion of each variant type. (c) The Sankey diagram shows the changes in m6A clusters, gene clusters, m6A score, and survival status. (d) Survival analysis of low (62 cases) and high (493 cases) m6A score patient groups in the TCGA-KIRC cohort, using Kaplan-Meier curve (HR, 1.81 (1.26–2.62); p < 0.001, log-rank test). (e) Spearman's correlation analysis was used to analyze the correlation between m6A score and immune cells in the clear cell renal cell carcinoma cohort. Negative correlations are marked in blue, and positive correlations are marked in red. (f) Using the Kaplan-Meier curve to analyze the survival rate of patients with low (254 cases) and high (74 cases) tumor mutations in the clear cell renal cell carcinoma cohort (HR, 1.81 (1.26–2.62); p < 0.001, log-level test). (g) Kaplan-Meier curve is used to analyze survival by m6A score and TMB score. H high; L low. (h-i) Differences in m6A score between the three gene clusters and the three types in the clear cell renal cell carcinoma cohort. The Kruskal-Wallis test was used to compare the statistical differences between the three gene clusters (p < 0.001).
Figure 7
Figure 7
(a–f) Kaplan-Meier curve is used to show the difference in survival rate between the high group and low group in age and clinical stage (p < 0.05 is meaningful). (g–i) The difference in the expression levels of the three immune markers in the high- and low-score groups (p < 0.1 is meaningful). (j) The distribution of scoring scores between the high and low groups in ccRCC, and the difference between the high and low groups, and the black bars represent the median. (k–n) No anti-PD-1/L1 immunotherapy and anti-CTLa4 immunotherapy, anti-PD-1/L1 immunotherapy alone, anti-CTLa4 immunotherapy alone, anti-PD-1/L1 immunotherapy and anti-PD-1/L1 immunotherapy, and anti-PD-1/L1 immunotherapy alone were separately received. The different efficacy of CTLa4 immunotherapy in the high- and low-score groups when the two combined immunotherapy is combined, and the black bars represent the median.

Similar articles

Cited by

References

    1. Chow W.-H., Dong L. M., Devesa S. S. Epidemiology and risk factors for kidney cancer. Nature Reviews Urology . 2010;7(5):245–257. doi: 10.1038/nrurol.2010.46. - DOI - PMC - PubMed
    1. Rini B. I., Campbell S. C., Escudier B. Renal cell carcinoma. The Lancet . 2009;373(9669):1119–1132. doi: 10.1016/s0140-6736(09)60229-4. - DOI - PubMed
    1. Siegel R. L., Miller K. D., Fuchs H. E., Jemal A. Cancer statistics, 2021. CA: A Cancer Journal for Clinicians . 2021;71(1):7–33. doi: 10.3322/caac.21654. - DOI - PubMed
    1. Motzer R. J., Jonasch E., Agarwal N., et al. Kidney cancer, version 3.2015. Journal of the National Comprehensive Cancer Network . 2015;13(2):151–159. doi: 10.6004/jnccn.2015.0022. - DOI - PubMed
    1. Junttila M. R., de Sauvage F. J. Influence of tumour micro-environment heterogeneity on therapeutic response. Nature . 2013;501(7467):346–354. doi: 10.1038/nature12626. - DOI - PubMed

LinkOut - more resources