

The efficacy and safety of high-pressure processing of food
- PMID: 35281651
- PMCID: PMC8902661
- DOI: 10.2903/j.efsa.2022.7128
The efficacy and safety of high-pressure processing of food
Abstract
High-pressure processing (HPP) is a non-thermal treatment in which, for microbial inactivation, foods are subjected to isostatic pressures (P) of 400-600 MPa with common holding times (t) from 1.5 to 6 min. The main factors that influence the efficacy (log10 reduction of vegetative microorganisms) of HPP when applied to foodstuffs are intrinsic (e.g. water activity and pH), extrinsic (P and t) and microorganism-related (type, taxonomic unit, strain and physiological state). It was concluded that HPP of food will not present any additional microbial or chemical food safety concerns when compared to other routinely applied treatments (e.g. pasteurisation). Pathogen reductions in milk/colostrum caused by the current HPP conditions applied by the industry are lower than those achieved by the legal requirements for thermal pasteurisation. However, HPP minimum requirements (P/t combinations) could be identified to achieve specific log10 reductions of relevant hazards based on performance criteria (PC) proposed by international standard agencies (5-8 log10 reductions). The most stringent HPP conditions used industrially (600 MPa, 6 min) would achieve the above-mentioned PC, except for Staphylococcus aureus. Alkaline phosphatase (ALP), the endogenous milk enzyme that is widely used to verify adequate thermal pasteurisation of cows' milk, is relatively pressure resistant and its use would be limited to that of an overprocessing indicator. Current data are not robust enough to support the proposal of an appropriate indicator to verify the efficacy of HPP under the current HPP conditions applied by the industry. Minimum HPP requirements to reduce Listeria monocytogenes levels by specific log10 reductions could be identified when HPP is applied to ready-to-eat (RTE) cooked meat products, but not for other types of RTE foods. These identified minimum requirements would result in the inactivation of other relevant pathogens (Salmonella and Escherichia coli) in these RTE foods to a similar or higher extent.
Keywords: High‐pressure processing; food; microbial inactivation; milk; ready‐to‐eat products; safety concern.
© 2022 Wiley‐VCH Verlag GmbH & Co. KgaA on behalf of the European Food Safety Authority.
Figures
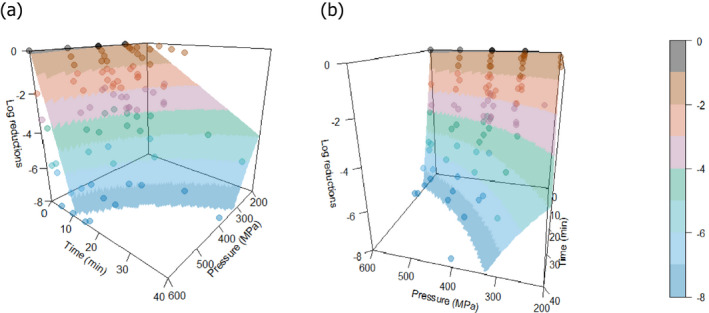
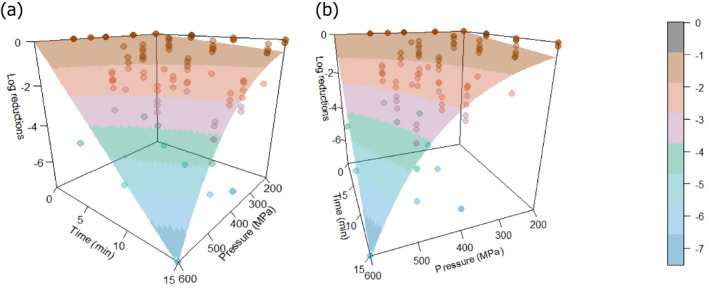
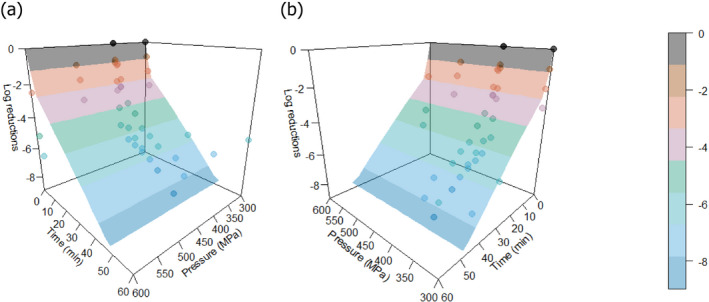
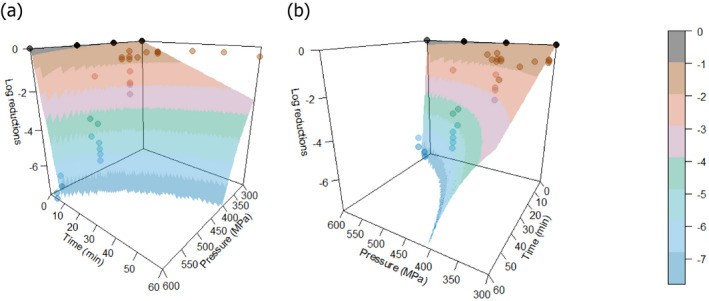
Heat map bars represent magnitudes of log10 reductions. The two figures (a and b) represent two different angles of the same 3D graph. Source of data: Patterson et al. (1995); Dogan and Erkmen (2004); Gao et al. (2006); Hayman et al. (2008); Viazis et al. (2008); Xu et al. (2009); Amina et al. (2010); Mishra et al. (2013); Huang et al. (2015); Ramos et al. (2015); Allison et al. (2018); Misiou et al. (2018); Stratakos et al. (2019); Komora et al. (2020).
‘Milk’ refers to data from Xu et al. (2009), where the milk type was not specified; ‘Milk buffer’ refers to a buffered solution that contains equivalent amounts of mineral and lactose as the whey from rennet casein (Gao et al., 2006).
Heat‐map bars represent magnitudes of log10 reductions. The two figures (a and b) represent two different angles of the same 3D graph. Source of data: Records included in text and used for data extraction: Patterson et al. (1995); Patterson and Kilpatrick (1998); Gervilla et al. (1999); Viazis et al. (2008); Tabla et al. (2012); Ramos et al. (2015); Windyga et al. (2015).
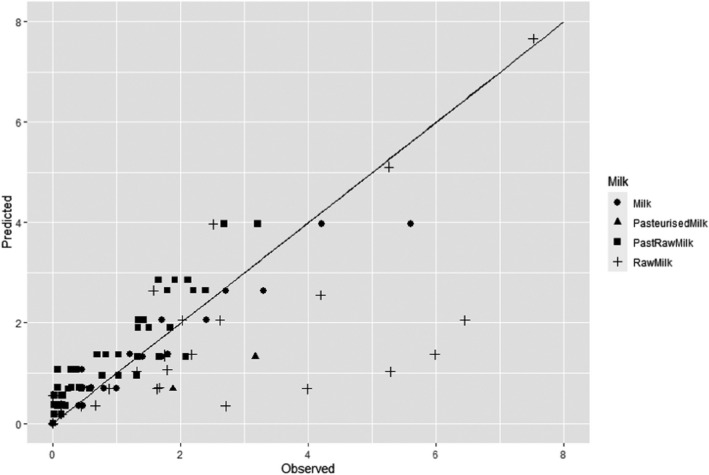
‘Milk’ refers to experiments human milk from Windyga et al. (2015). ‘PastRawMilk’ refers to raw milk that was centrifuged and standardised to different fat contents (6 or 50%) and pasteurised without prior homogenisation (Gervilla et al., 1999, 2000).
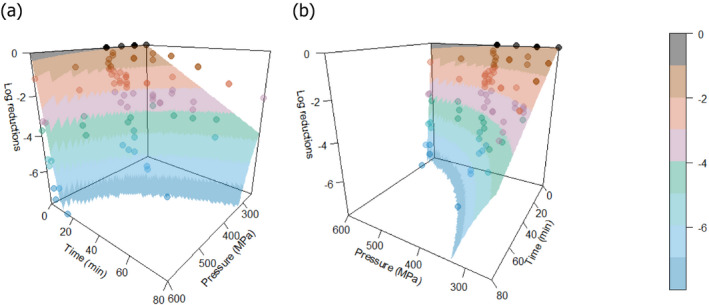
Heat‐map bars represent magnitudes of log10 reductions. The two figures (a and b) represent two different angles of the same 3D graph. Source of data: Patterson et al. (1995); Patterson and Kilpatrick (1998); Garcia‐Graells et al. (2000); Gervilla et al. (2000); Dogan and Erkmen (2003); Pandey et al. (2003); Buzrul et al. (2008); Buzrul et al. (2009); Foster et al. (2016); Bernedo‐Navarro et al. (2016); Machado et al. (2019); Stratakos et al. (2019); Viazis et al. (2008).
‘PastRawMilk’ in the legend, refers to raw milk that was centrifuged and standardised to different fat contents (6%) and pasteurised without prior homogenisation (Gervilla et al., 2000).
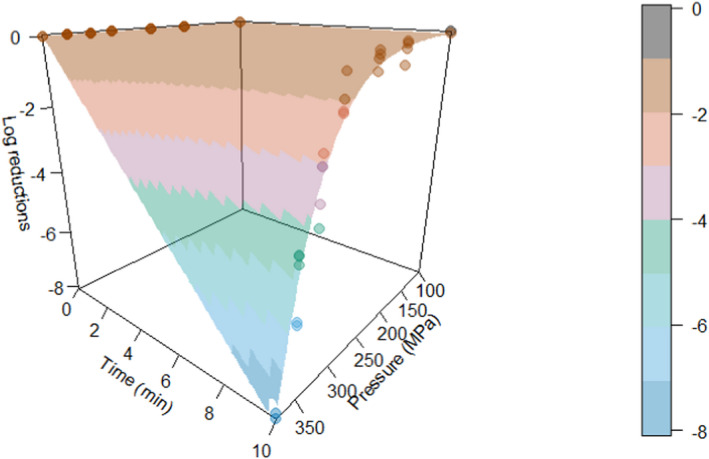
Heat‐map bars represent magnitudes of log10 reductions. The two figures (a and b) represent two different angles of the same 3D graph.Source of data: Erkmen (2009); Xu et al. (2009); Erkmen (2011); Foster et al. (2016); Stratakos et al. (2019).
‘Milk’ in the legend, refers to data from Xu et al. (2009), where the milk type was not specified.
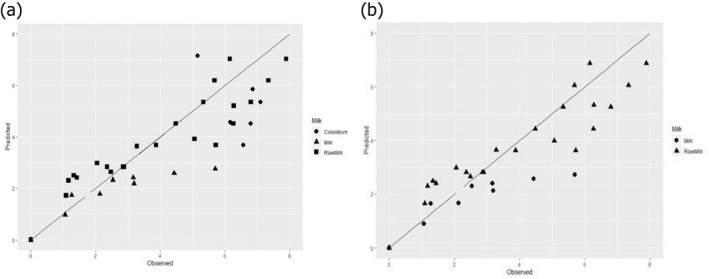
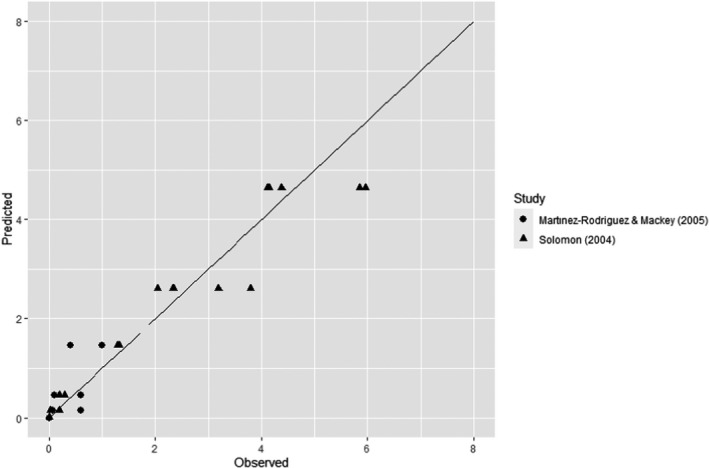
Heat‐map bars represent magnitudes of log10 reductions.Source of data: Martinez‐Rodriguez and Mackey (2005), Solomon and Hoover (2004).
Heat‐map bars represent magnitudes of log10 reductions.Source of data: Donaghy et al. (2007), Foster et al. (2016), López‐Pedemonte et al. (2006).
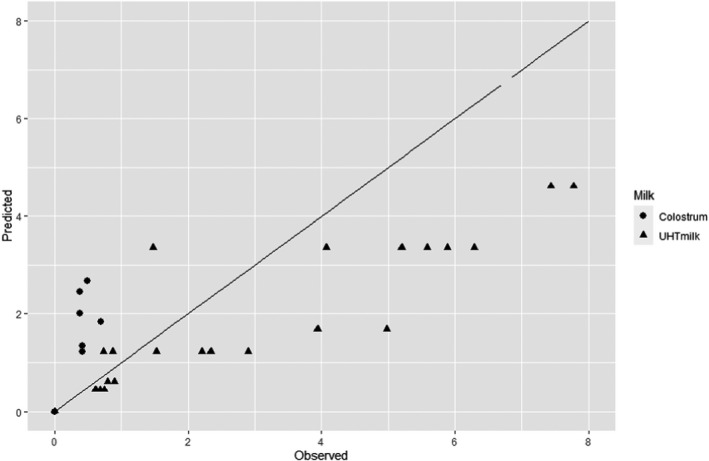
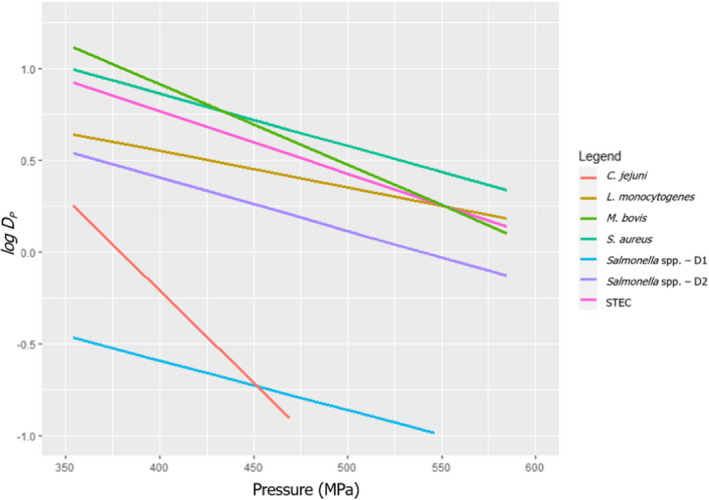
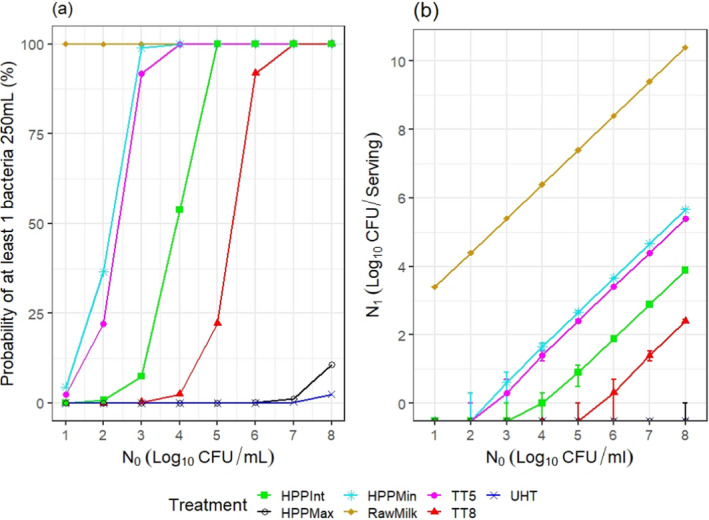
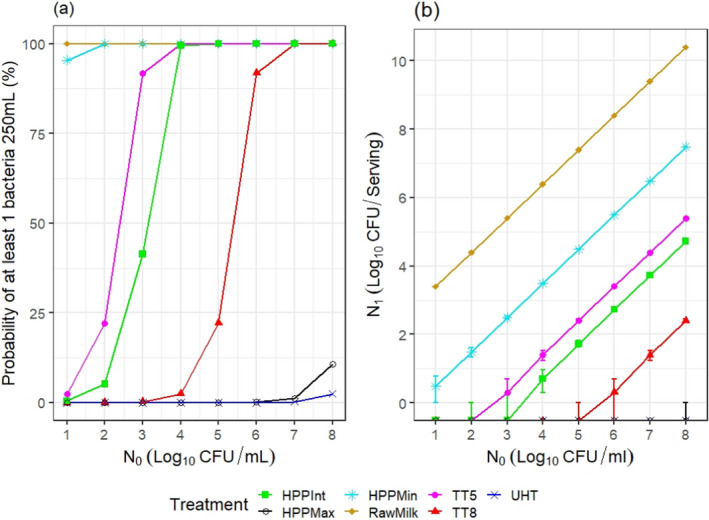
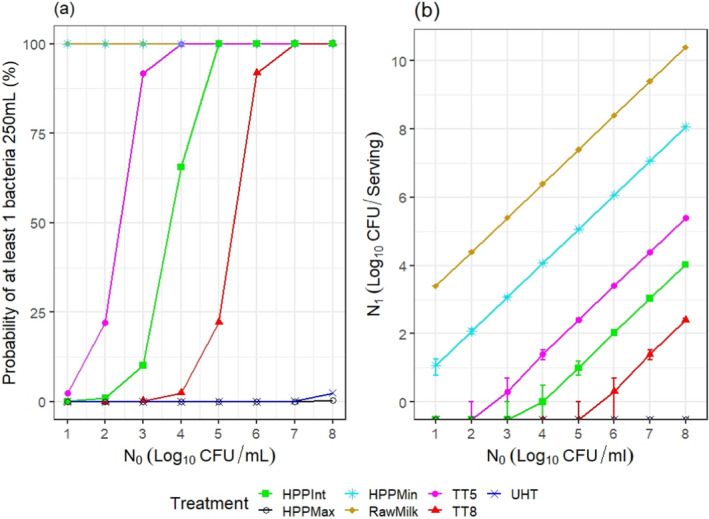
For Listeria monocytogenes not including UHT milk and colostrum; for Staphylococcus aureus not including UHT milk and colostrum; for STEC not including UHT milk and colostrum with the studies used to fit the model used only O157:H7 and non‐pathogenic Escherichia coli; for Salmonella spp. (including colostrum)– D1 considering the first rapid inactivation phase; for Salmonella spp. – D2 considering the second slower death phase; for Campylobacter jejuni only including UHT milk; for Mycobacterium bovis not including UHT milk and colostrum and using Mycobacterium avium subsp. paratuberculosis (MAP) as surrogate.
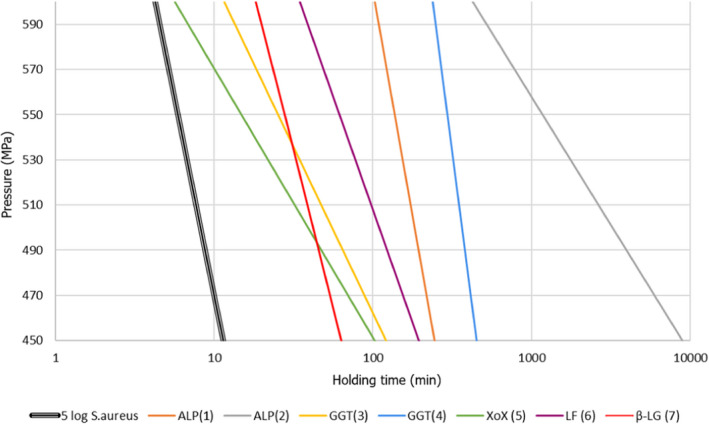
ALP: Alkaline phosphatase; GGT: γ‐Glutamil Transferase; Xox: Xanthine oxidase; LF: Lactoferrin; β‐Lg: β‐Lactoglobuline. Sources: (1) Mussa and Ramaswamy (1997), estimated from zp/Dp‐values; (2) Ludikhuyze et al. (2000), estimated from zp/Dp‐values; (3) Rademacher and Hinrichs (2006), estimated from Cf/Co‐values; (4) Pandey and Ramaswamy (2004), estimated from z/D values; (5) Olsen et al. (2004), estimated from Cf/Co‐values; (6) Mazri et al. (2012b), estimated from Cf/Co values; (6) Mazri et al. (2012a), estimated from Cf/Co‐values (see Section 2.3.2).
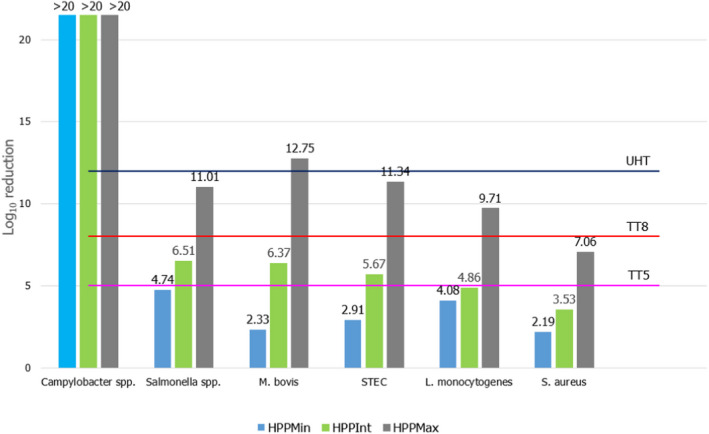
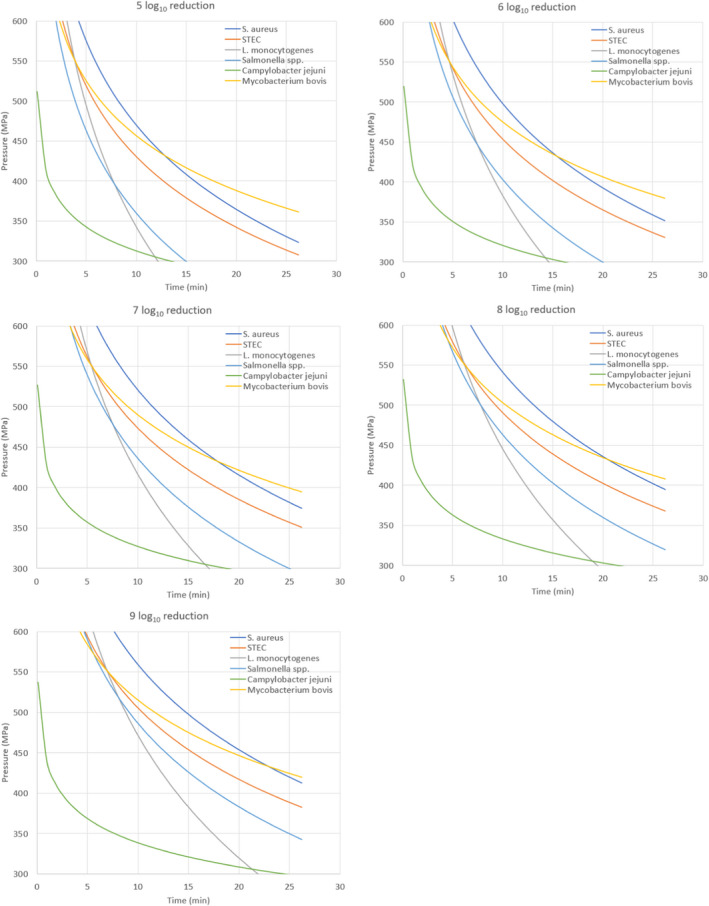
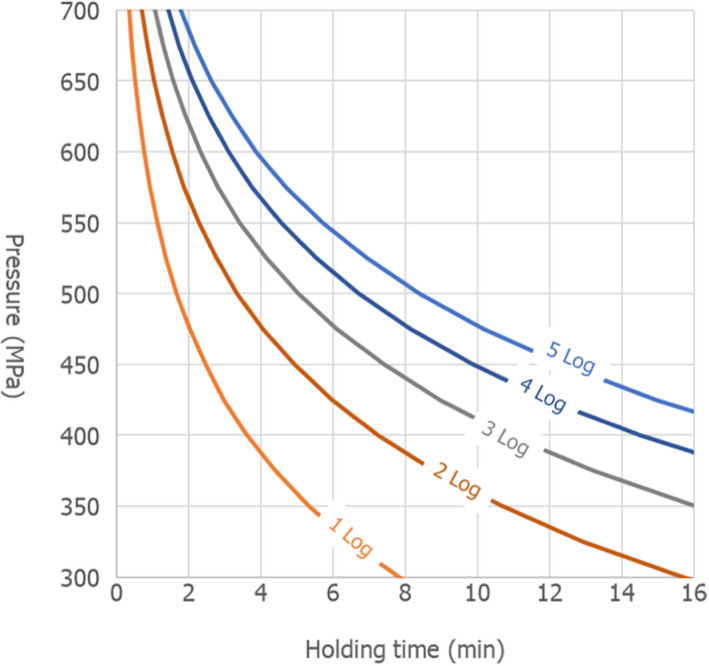
The minimum and maximum reference values to be achieved by thermal pasteurisation (i.e. 5 log10 reductions or TT5 and 8 log10 reductions or TT8) are shown as well as the assumed 12 log10 reductions for UHT milk. Mycobacterium avium subsp. paratuberculosis (MAP) was used as surrogate for Mycobacterium bovis while Shiga toxin‐producing E. coli (STEC) considered E. coli O157:H7 and non‐pathogenic E. coli.
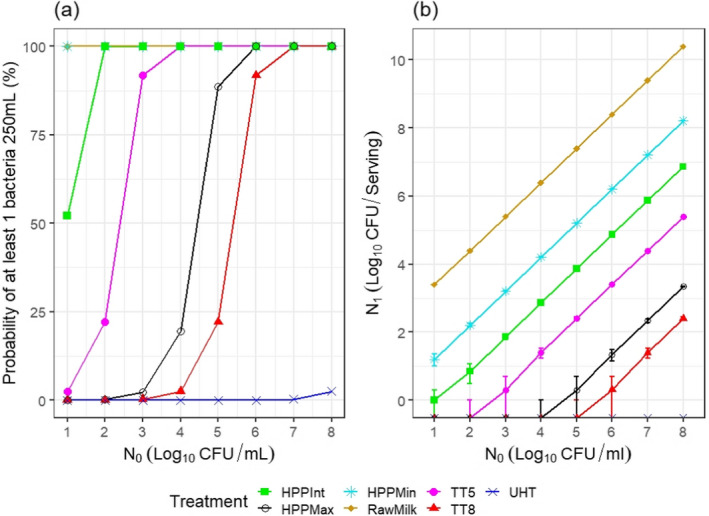
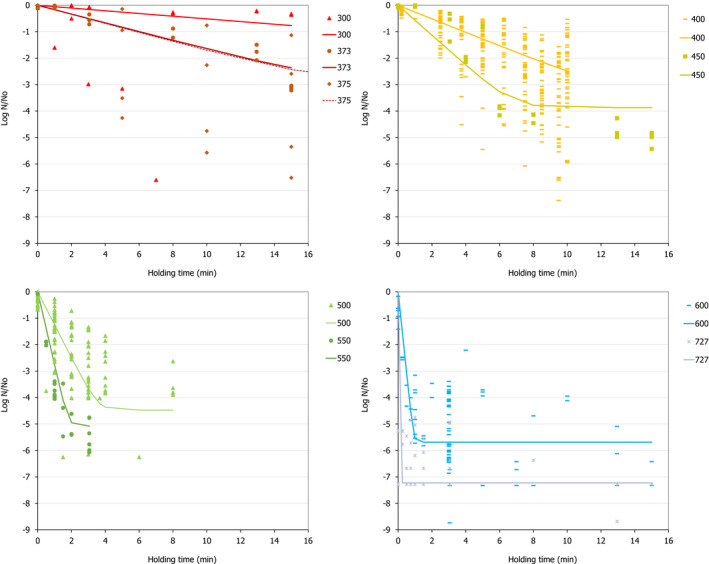
Results are presented disaggregated by initial contamination level (N o ).
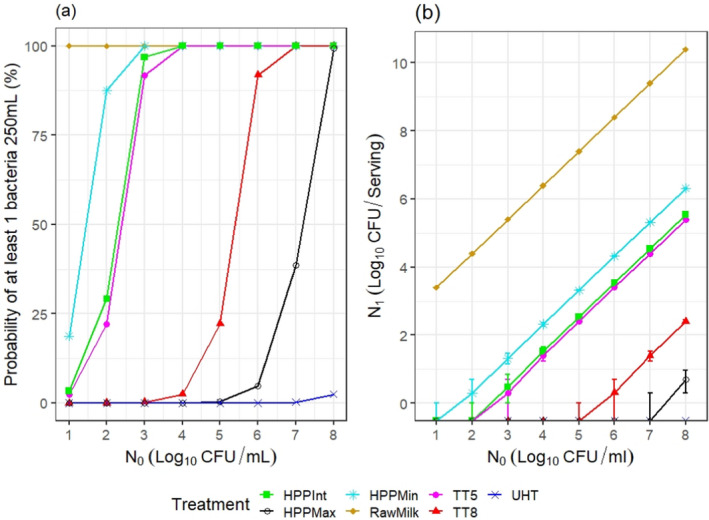
Results are presented disaggregated by initial contamination level (N 0 ).
Results are presented disaggregated by initial contamination level (N 0 ).
Results are presented disaggregated by initial contamination level (N0).
Results are presented disaggregated by initial contamination level (N 0 ).
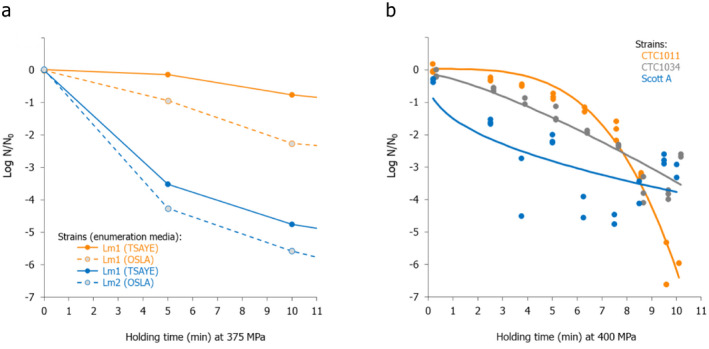
Strains: Lm1 (NCTC 11994, isolate from cheese); Lm2 (isolate from poultry meat of a local processor); CTC1011 and CTC1034 (isolates from RTE meat products); Scott A (clinical isolate).
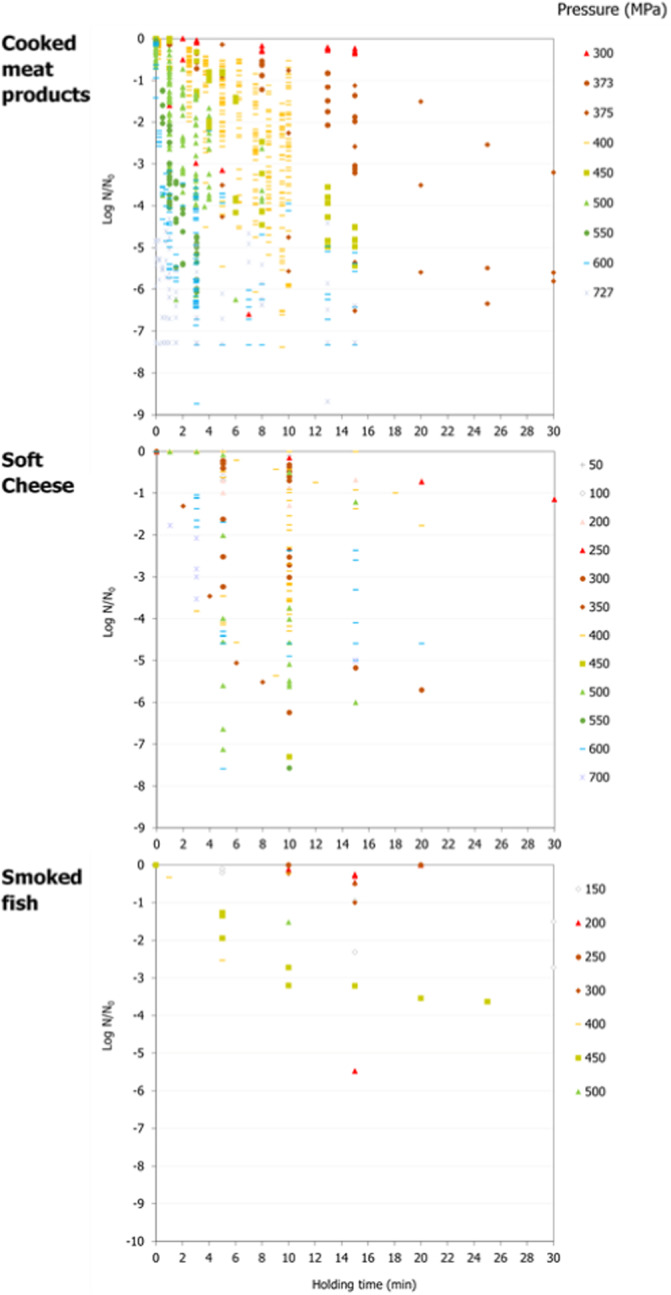
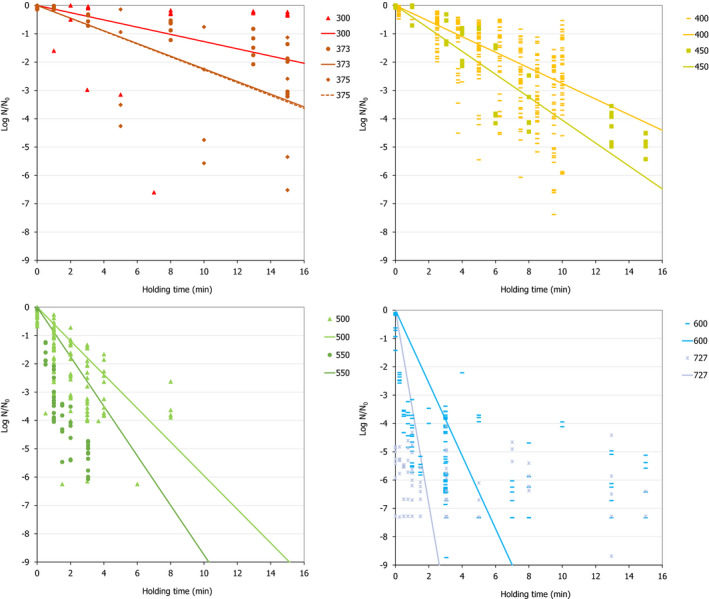
Source of data for cooked meat products: Bover‐Cid et al. (2019); Chen (2007); Hayman et al. (2004); Hereu et al. (2012a); Hereu et al. (2014); Jofré et al. (2007); Jofré et al. (2008); Lavieri et al. (2014); Lucore et al. (2000); Marcos et al. (2008b); Montiel et al. (2015); Myers et al. (2013); Pavli et al. (2019); Serra‐Castelló et al. (2021b); Simpson and Gilmour (1997); Stratakos et al. (2015); Teixeira et al. (2016); Teixeira et al. (2018). Source of data for smoked and gravid fish: Amanatidou et al. (2000a); Ekonomou et al. (2020); Lakshmanan and Dalgaard (2004); Medina et al. (2009); Mengden et al. (2015); Misiou et al. (2018); Montero et al. (2007); Montiel et al. (2012); Montiel et al. (2014). Source of data for soft or semi‐soft and fresh cheese: Argues et al. (2005); Batty et al. (2019); Carminati et al. (2004); Evert‐Arriagada et al. (2018); Evrendilek et al. (2008); Goncalves et al. (2021); López‐Pedemonte et al. (2007); Martinez‐Rodriguez et al. (2012); Misiou et al. (2018); Morales et al. (2006); Opkala et al. (2010); Shao et al. (2006); Tomasula et al. (2014).
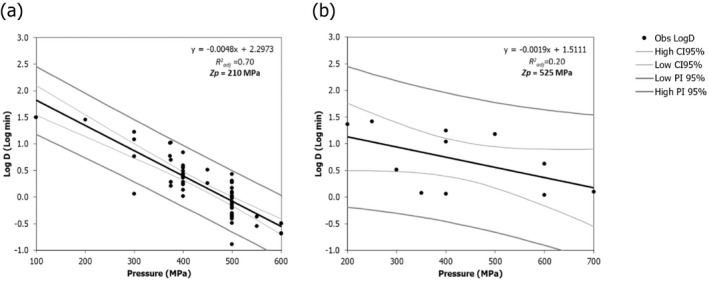
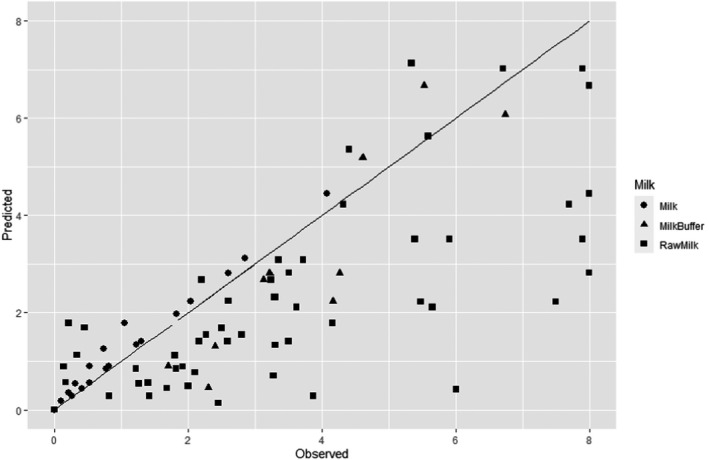
Black line represents the linear fit, light grey line shows the 95% confidence interval and dark grey line show the 95% prediction interval. Source of data for cooked meat products: Fonberg-Broczek et al. (2005); Hereu et al. (2012a); Lucore et al. (2000); Serra-Castelló et al. (2021b); Simpson and Gilmour (1997); Teixeira et al. (2016). Source of data for soft or semi-soft and fresh cheese: Carminati et al. (2004); Morales et al. (2006); Shao et al. (2006); Tomasula et al. (2014).
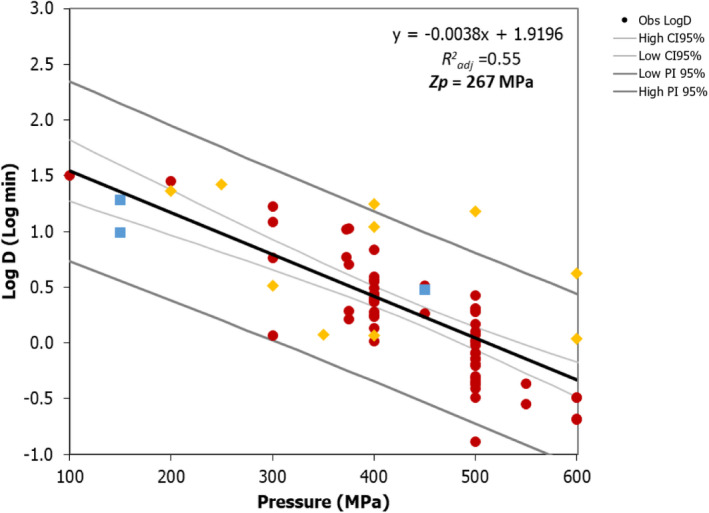
Black line represents the linear fit, light grey line shows the 95% confidence interval and dark grey line shows the 95% prediction interval. Source of data for cooked meat products: Fonberg-Broczek et al. (2005); Hereu et al. (2012a); Lucore et al. (2000); Serra-Castelló et al. (2021b); Simpson and Gilmour (1997); Teixeira et al. (2016). Source of data for soft or semi-soft and fresh cheese: Carminati et al. (2004); Morales et al. (2006); Shao et al. (2006); Tomasula et al. (2014). Source of data for smoked and gravid fish: Amanatidou et al. (2000a); Medina et al. (2009).
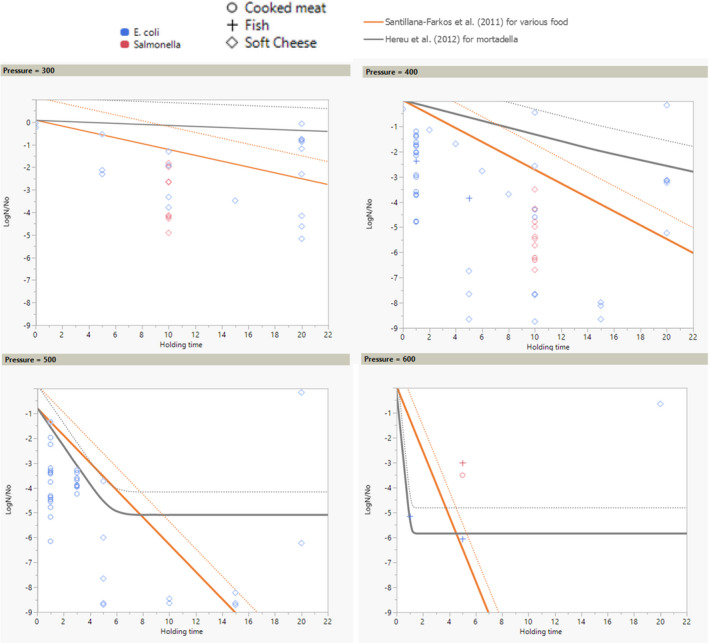
Source of data for E. coli in cooked meat products: Chung and Yousef (2010); Garriga et al. (2002); Waite‐Cusic and Yousef (2011); Salmonella in cooked meat products: Al‐Nehlawi et al. (2014); Garriga et al. (2002); Jofré et al. (2008); Kruk et al. (2011); Porto‐Fett et al. (2010); Stiebing et al. (2000); E. coli in smoked and gravid fish: Mengden et al. (2015), Salmonella in smoked and gravid fish: Stollewerk et al. (2014), E. coli in soft or semi‐soft and fresh cheese: Capellas et al. (1996); De Lamo‐Castellvı et al. (2006); Goncalves et al. (2021); O'Reilly et al. (2000); Rodriguez et al. (2005); Shao et al. (2007), Salmonella in soft or semi‐soft and fresh cheese: De Lamo‐Castellvı et al. (2007).
References
-
- Abera G, 2019. Review on high‐pressure processing of foods. Cogent Food & Agriculture, 5, 1568725. 10.1080/23311932.2019.1568725 - DOI
-
- AESAN (Agencia Española de Seguridad Alimentaria y Nutrición) , 2004. Opinión del Comité científico de la AESA sobre una cuestión presentada por la Dirección Ejecutiva, en relación con la aplicación de altas presiones en carne y productos cárnicos (Ref. AESA‐2003‐007). 36 pp. Revista Del Comité Científico, 1. Available online: https://www.aesan.gob.es/AECOSAN/docs/documentos/seguridad_alimentaria/e... pp. 36–76.
-
- AFSSA (Agence Française de sécurité des produits alimentaires) , 2007. Avis de l’Agence française de sécurité sanitaire des aliments (Afssa) relatif à l’autorisation de mise sur le marché de magrets de canards séchés, ou séchés et fumés, stabilisés par hautes pressions hydrostatiques comme nouvel aliment dans le cadre du règlement (CE) n°258/97. Saisine n° 2007‐SA‐0164. Available online: https://www.anses.fr/en/system/files/AAAT2007sa0164.pdf
-
- Aganovic K, Hertel C, Vogel RF, Johne R, Schluter O, Schwarzenbolz U, Jager H, Holzhauser T, Bergmair J, Roth A, Sevenich R, Bandick N, Kulling SE, Knorr D, Engel KH and Heinz V, 2021. Aspects of high hydrostatic pressure food processing: perspectives on technology and food safety. Comprehensive Reviews in Food Science and Food Safety, 20, 3225–3266. 10.1111/1541-4337.12763 - DOI - PubMed
LinkOut - more resources
Full Text Sources
Molecular Biology Databases