

Prevalence, Deaths and Disability-Adjusted-Life-Years (DALYs) Due to Type 2 Diabetes and Its Attributable Risk Factors in 204 Countries and Territories, 1990-2019: Results From the Global Burden of Disease Study 2019
- PMID: 35282442
- PMCID: PMC8915203
- DOI: 10.3389/fendo.2022.838027
Prevalence, Deaths and Disability-Adjusted-Life-Years (DALYs) Due to Type 2 Diabetes and Its Attributable Risk Factors in 204 Countries and Territories, 1990-2019: Results From the Global Burden of Disease Study 2019
Abstract
Aim: To report the point prevalence, deaths and disability-adjusted-life-years (DALYs) due to type 2 diabetes and its attributable risk factors in 204 countries and territories during the period 1990-2019.
Methods: We used the data of the Global Burden of Disease (GBD) Study 2019 to report number and age-standardised rates per 100 000 population of type 2 diabetes. Estimates were reported with 95% uncertainty intervals (UIs).
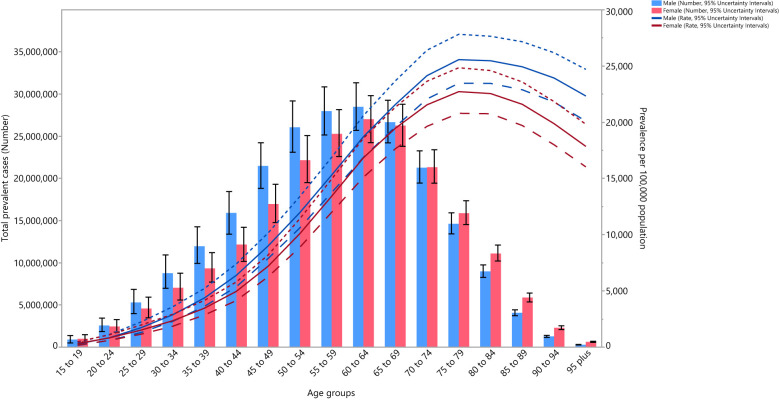
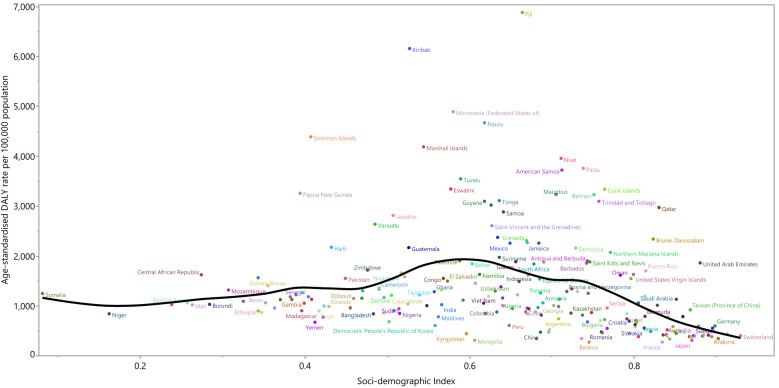
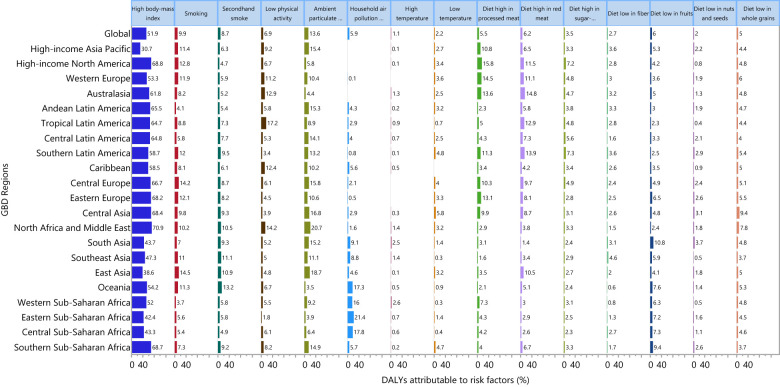
Results: In 2019, the global age-standardised point prevalence and death rates for type 2 diabetes were 5282.9 and 18.5 per 100 000, an increase of 49% and 10.8%, respectively, since 1990. Moreover, the global age-standardised DALY rate in 2019 was 801.5 per 100 000, an increase of 27.6% since 1990. In 2019, the global point prevalence of type 2 diabetes was slightly higher in males and increased with age up to the 75-79 age group, decreasing across the remaining age groups. American Samoa [19876.8] had the highest age-standardised point prevalence rates of type 2 diabetes in 2019. Generally, the burden of type 2 diabetes decreased with increasing SDI (Socio-demographic Index). Globally, high body mass index [51.9%], ambient particulate matter pollution [13.6%] and smoking [9.9%] had the three highest proportions of attributable DALYs.
Conclusion: Low and middle-income countries have the highest burden and greater investment in type 2 diabetes prevention is needed. In addition, accurate data on type 2 diabetes needs to be collected by the health systems of all countries to allow better monitoring and evaluation of population-level interventions.
Keywords: burden; global epidemiology; mortality; prevalence; type 2 diabetes mellitus; worldwide epidemiology.
Copyright © 2022 Safiri, Karamzad, Kaufman, Bell, Nejadghaderi, Sullman, Moradi-Lakeh, Collins and Kolahi.
Conflict of interest statement
The authors declare that the research was conducted in the absence of any commercial or financial relationships that could be construed as a potential conflict of interest.
Figures


References
-
- Saeedi P, Petersohn I, Salpea P, Malanda B, Karuranga S, Unwin N, et al. . Global and Regional Diabetes Prevalence Estimates for 2019 and Projections for 2030 and 2045: Results From the International Diabetes Federation Diabetes Atlas. Diabetes Res Clin Pract (2019) 157:107843. doi: 10.1016/j.diabres.2019.107843 - DOI - PubMed
-
- Roth GA, Abate D, Abate KH, Abay SM, Abbafati C, Abbasi N, et al. . Global, Regional, and National Age-Sex-Specific Mortality for 282 Causes of Death in 195 Countries and Territories, 1980–2017: A Systematic Analysis for the Global Burden of Disease Study 2017. Lancet (2018) 392(10159):1736–88. doi: 10.1016/S0140-6736(18)32203-7 - DOI - PMC - PubMed
Publication types
MeSH terms
LinkOut - more resources
Full Text Sources
Medical