. 2022 Nov;18(11):2697-2710.
doi: 10.1080/15548627.2022.2047343. Epub 2022 Mar 14.

Targeting lipophagy in macrophages improves repair in multiple sclerosis

Affiliations

Targeting lipophagy in macrophages improves repair in multiple sclerosis

Mansour Haidar et al. Autophagy. 2022 Nov.

Abstract

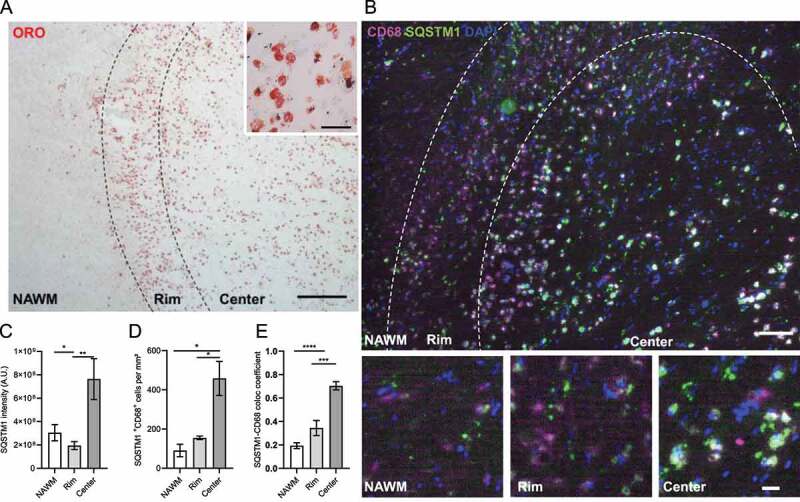
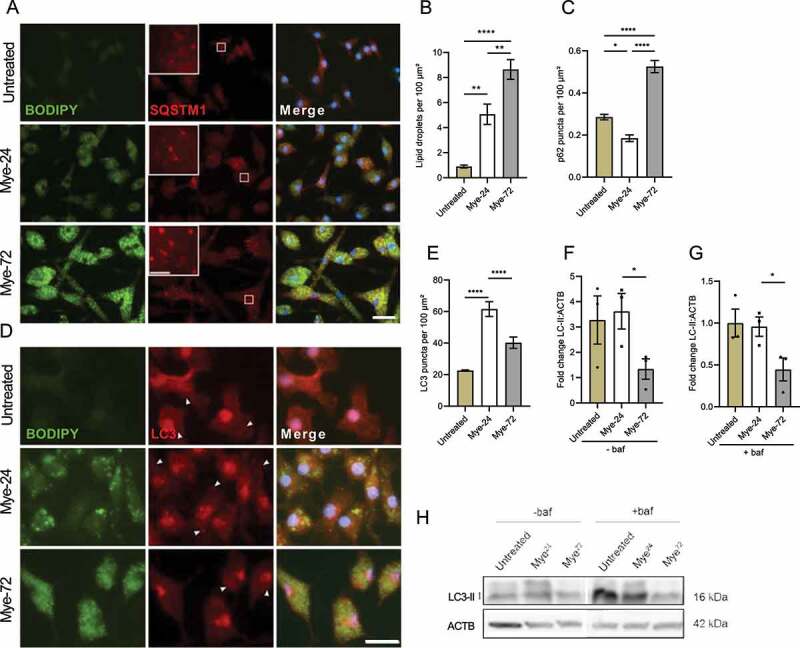
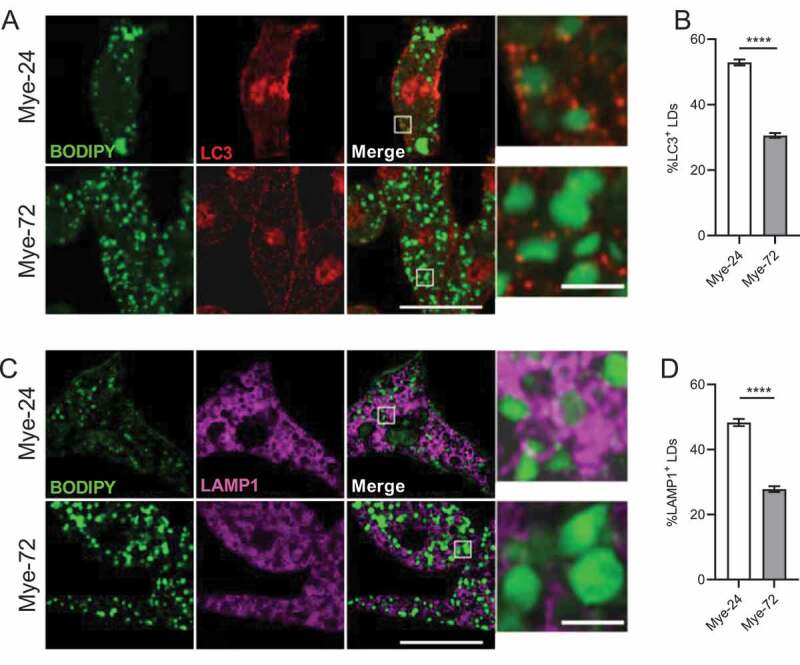
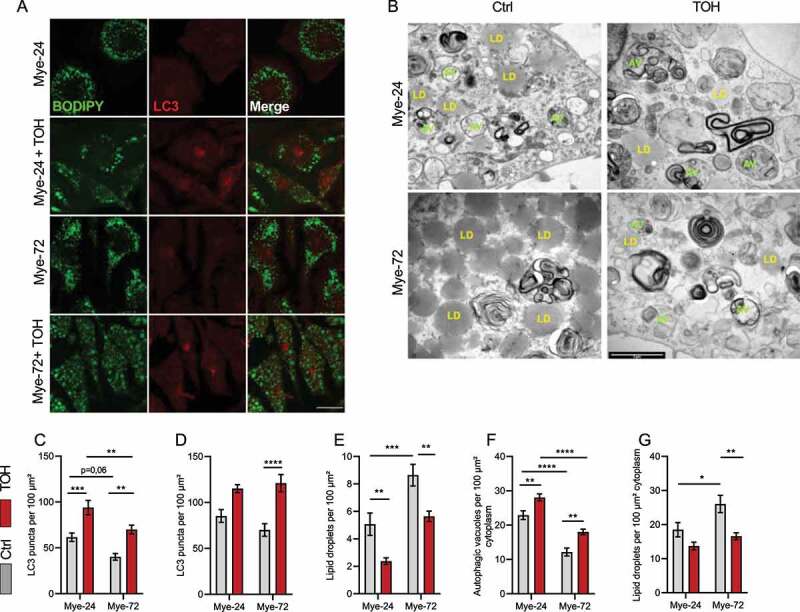
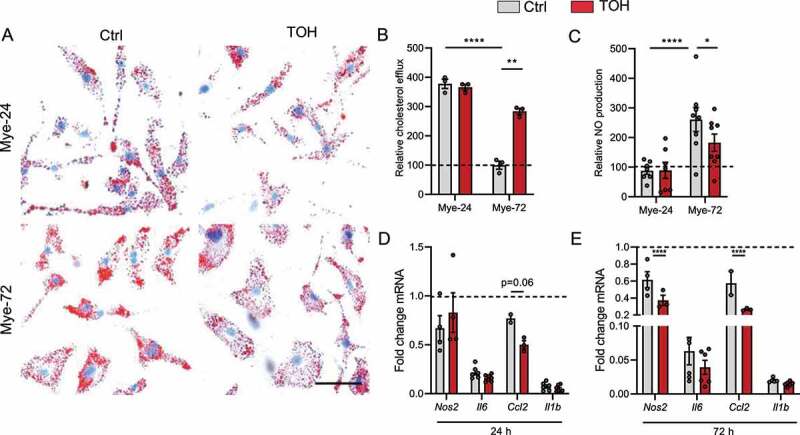
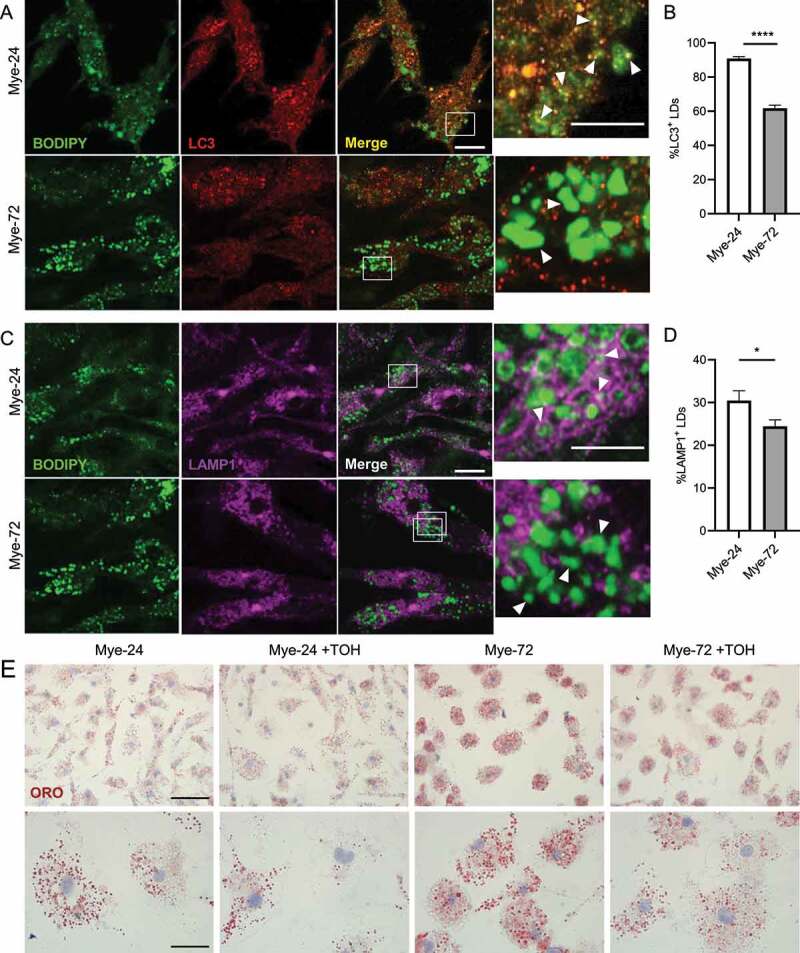
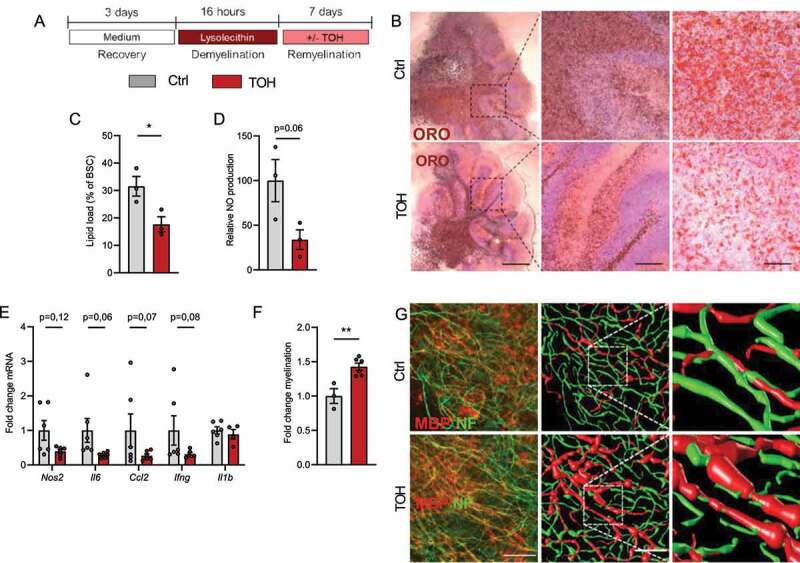
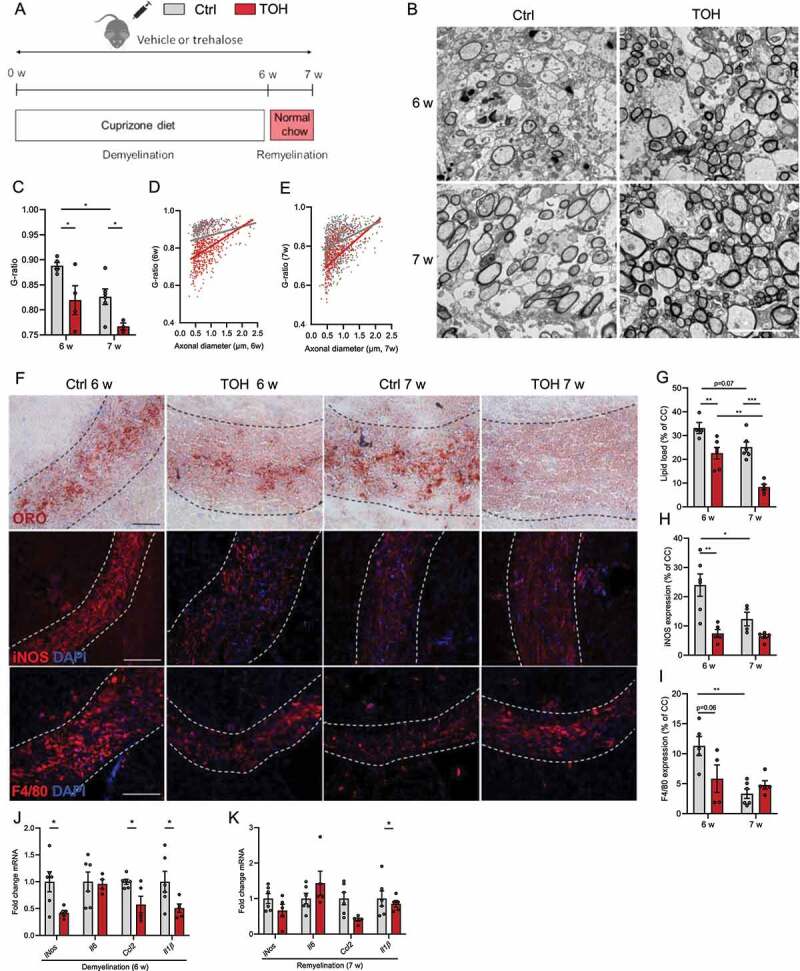
Foamy macrophages containing abundant intracellular myelin remnants are an important pathological hallmark of multiple sclerosis. Reducing the intracellular lipid burden in foamy macrophages is considered a promising therapeutic strategy to induce a phagocyte phenotype that promotes central nervous system repair. Recent research from our group showed that sustained intracellular accumulation of myelin-derived lipids skews these phagocytes toward a disease-promoting and more inflammatory phenotype. Our data now demonstrate that disturbed lipophagy, a selective form of autophagy that helps with the degradation of lipid droplets, contributes to the induction of this phenotype. Stimulating autophagy using the natural disaccharide trehalose reduced the lipid load and inflammatory phenotype of myelin-laden macrophages. Importantly, trehalose was able to boost remyelination in the ex vivo brain slice model and the in vivo cuprizone-induced demyelination model. In summary, our results provide a molecular rationale for impaired metabolism of myelin-derived lipids in macrophages, and identify lipophagy induction as a promising treatment strategy to promote remyelination.Abbreviations: Baf: bafilomycin a1; BMDM: bone marrow-derived macrophage; CD68: CD68 antigen; CNS: central nervous system; LD: lipid droplet; LIPE/HSL: lipase, hormone sensitive; LPS: lipopolysaccharide; MAP1LC3/LC3: microtubule-associated protein 1 light chain 3; MBP: myelin basic protein; MGLL: monoglyceride lipase; MS: multiple sclerosis; NO: nitric oxide; NOS2/iNOS: nitric oxide synthase 2, inducible; ORO: oil red o; PNPLA2: patatin-like phospholipase domain containing 2; PLIN2: perilipin 2; TEM: transmission electron microscopy; TFEB: transcription factor EB; TOH: trehalose.

Keywords: Lipid droplets; lipophagy; multiple sclerosis; phagocyte; remyelination.


Conflict of interest statement

No potential conflict of interest was reported by the author(s).

Figures

Figure 1.
Figure 1.
MS lesions show signs of dysfunctional autophagy. (A,B) Representative images of an active MS lesion stained with (A) Oil red O (ORO) or (B) CD68 (magenta) and SQSTM1 (green). (C,D) Quantification of (C) SQSTM1 intensity and (D) the number of phagocytes expressing SQSTM1. (E) Colocalization coefficient of CD68 and SQSTM1. n = 3 lesions from 3 different MS patients. Scale bar: (A, overview) 500 µm, (A, inset) 50 µm, (B, overview) 100 µm, (B, inset) 20 µm. White arrows indicate colocalization. All data are represented as mean ± SEM. *p < 0.05 and **p < 0.01.
Figure 2.
Figure 2.
Prolonged myelin accumulation reduces autophagy levels in macrophages. (A-E) Immunofluorescence staining (A,D) and puncta-analysis (C,E) of bone marrow-derived macrophages (BMDMs) treated with myelin for a short (Mye-24) or prolonged (Mye-72) time. BODIPY (green), SQSTM1 (A, red), LC3 (D, red). Scale bar: overview 20 µm, inset 5 µm. (B) Quantification of number of BODIPY+-lipid droplets (LDs) in mye-24- and mye-72-BMDMs. Data originates from 3 independent experiments (50+ cells per condition). (F-H) Western blot analysis of LC3-II in untreated, mye-24- and mye-72-BMDMs stimulated with bafilomycin A1 (baf) 2 h prior to lysing (G) or non-stimulated (F). LC3-II level is calculated from 3 independent experiments and normalized to β-actin levels (loading control). All data are represented as mean ± SEM. *p < 0.05, **p < 0.01 and ****p < 0.0001.
Figure 3.
Figure 3.
Recruitment of lipid droplets to autophagosomes and lysosomes in macrophages is decreased upon sustained myelin exposure. (A,C) Immunofluorescence staining of bone marrow-derived macrophages treated with myelin for a short (Mye-24) or prolonged (Mye-72) time. BODIPY (green), LC3 (A, red), Lamp1 (C, magenta). Scale bar: overview 20 µm, inset 2 µm. (B,D) Average % of (B) LC3+ and (D) Lamp1+ lipid droplets (LDs) of the total amount of LDs. Quantification is calculated from 3 independent experiments (100+ cells per condition). All data are represented as mean ± SEM. ****p < 0.0001.
Figure 4.
Figure 4.
Trehalose increases autophagy in mye-macrophages. Bone marrow-derived macrophages were treated with myelin for a short (Mye-24) or prolonged (Mye-72) time and were additionally stimulated with trehalose (TOH) for the final 6 h of myelin exposure and/or bafilomycin A1 for the final 2 h. (A) Representative pictures of immunofluorescent staining of BODIPY (green) and LC3 (red). Scale bar: 20 µm. (B) Representative transmission electron microscopy images. Scale bar: 2 µm. (C,D) Quantification of LC3 puncta in the absence (C) or presence (D) of bafilomycin A1. (E) Quantification of BODIPY+ lipid droplets (LDs). (F,G) Quantification of the number of (F) autophagic vacuoles (AV, green) and (G) LDs (yellow). Identification was based on ultrastructural morphological characteristics. All quantifications are calculated from 3 independent experiments. All data are represented as mean ± SEM. *p < 0.05, **p < 0.01, ***p < 0.001 and ****p < 0.0001.
Figure 5.
Figure 5.
Trehalose stimulates cholesterol efflux and reduces lipid load and inflammation in mye-macrophages. Bone marrow-derived macrophages (BMDMs) were treated with myelin for a short (Mye-24) or prolonged (Mye-72) time and were additionally stimulated with trehalose (TOH) for the final 6 h of myelin-ingestion. (A) Representative images of Oil Red O staining. Scale bar: 50 µm. (n = 4 wells). (B) Capacity of cells to efflux cholesterol and normalized to non-stimulated cells (n = 3). (C) Relative nitric oxide (NO) production by BMDMs stimulated with LPS for 18 h after TOH and myelin treatment (n = 6). (D-E) mRNA expression of pro-inflammatory genes in BMDMs stimulated with LPS for 6 h after TOH and myelin treatment (n = 6). All data are represented as mean ± SEM. *p < 0.05, **p < 0.01, ***p < 0.001 and ****p < 0.0001.
Figure 6.
Figure 6.
Trehalose reduces LD accumulation in late-stage microglia. (A,C) Immunofluorescence staining of primary mouse microglia treated with myelin for a short (Mye-24) or prolonged (Mye-72) time. BODIPY (green), LC3 (A, red), LAMP1 (C, magenta). Scale bar: overview 10 µm, inset 5 µm. (B,D) Average % of (B) LC3+ and (D) LAMP1+ lipid droplets (LDs) of the total amount of LDs. White arrows indicate colocalization. Quantification is calculated from 2 independent experiments (50+ cells per condition). (E) Representative images of Oil Red O staining of primary mouse microglia which were treated with myelin for a short (Mye-24) or prolonged (Mye-72) time and were additionally stimulated with trehalose (TOH) for the final 6 h of myelin-treatment. Scale bar: overview 50 µm, inset 20 µm. (n = 3 wells). All data are represented as mean ± SEM. *p < 0.05, ****p < 0.0001.
Figure 7.
Figure 7.
Trehalose promotes remyelination in an ex vivo cerebellar brain slice model. (A) Brain slices were demyelinated with lysolecithin and afterward treated daily with vehicle (Ctrl) or trehalose (TOH) for 1 week. (B,C) Representative images and quantification (lipid load defined as percent area covered in lipid droplets of the total brain slice area) of Oil Red O (ORO) staining of cerebellar brain slices (n = 3 slices). Scale bars: 500 μm (left), 100 μm (middle), 50 µm (right). (D) Relative nitric oxide (NO) concentration measured in supernatant of the brain slice cultures (BSC) (n = 3 wells). (E) mRNA expression of inflammatory mediators in brain slices (n = 6 slices). (F) Fold change MBP+NF+ axons of total NF+ axons (n = 3–6 slices). (G) Representative immunofluorescence images of brain slices stained for neurofilament (NF, green) and myelin basic protein (MBP, red). Scale bar: 50 µm (overview), 150 µm (inset), orthogonal and three-dimensional reconstruction (n = 3–6 slices). All data are represented as mean ± SEM. *p < 0.05 and **p < 0.01.
Figure 8.
Figure 8.
Trehalose stimulates remyelination in the cuprizone model. (A) Experimental setup of cuprizone-induced demyelination in vivo model. (B) Representative images of transmission electron microscopy analysis of corpus callosum (cc) from vehicle (Ctrl)- and trehalose (TOH)-treated animals after demyelination (6 w) and during remyelination (7 w). Scale bar: 100 µm. (C-E) Analysis of the g-ratio (the ratio of the inner axonal diameter to the total outer diameter) and g-ratio as a function of axon diameter in cc. (F) Representative images of Oil Red O (ORO) staining (scale bar: 50 µm), immunofluorescence NOS2 staining (scale bar: 100 µm), and immunofluorescence ADGRE1 staining (scale bar: 100 µm). (G) Quantification of ORO staining (lipid load defined as percent area covered in lipid droplets of the total cc area). (H,I) Relative NOS2+ area and ADGRE1+ area of cc. (J,K) mRNA expression of inflammatory mediators in CC. n = 4–7. All data are represented as mean ± SEM. *p < 0.05, **p < 0.01, and ***p < 0.001.

References

    1. Alizadeh A, Dyck SM, Karimi-Abdolrezaee S.. Myelin damage and repair in pathologic CNS: challenges and prospects. Front Mol Neurosci. 2015;8:35. - PMC - PubMed
    1. Miron VE, Boyd A, Zhao J-W, et al. M2 microglia and macrophages drive oligodendrocyte differentiation during CNS remyelination. Nat Neurosci. 2013;16(9):1211–1218. - PMC - PubMed
    1. Bogie JFJ, Stinissen P, Hellings N, et al. Myelin-phagocytosing macrophages modulate autoreactive T cell proliferation. J Neuroinflammation. 2011;8:85. - PMC - PubMed
    1. Boven LA, Van Meurs M, Van Zwam M, et al. Myelin-laden macrophages are anti-inflammatory, consistent with foam cells in multiple sclerosis. Brain. 2006;129(2):517–526. - PubMed
    1. Hikawa N, Takenaka T. Myelin-stimulated macrophages release neurotrophic factors for adult dorsal root ganglion neurons in culture. Cell Mol Neurobiol. 1996;16:517–528. - PMC - PubMed

Publication types

MeSH terms