Review
. 2022 Feb:128:1-24.
doi: 10.1016/j.pnmrs.2021.10.001. Epub 2021 Nov 2.

NMR methods for exploring 'dark' states in ligand binding and protein-protein interactions

Affiliations
Review

NMR methods for exploring 'dark' states in ligand binding and protein-protein interactions

Vitali Tugarinov et al. Prog Nucl Magn Reson Spectrosc. 2022 Feb.

Abstract

A survey, primarily based on work in the authors' laboratory during the last 10 years, is provided of recent developments in NMR studies of exchange processes involving protein-ligand and protein-protein interactions. We start with a brief overview of the theoretical background of Dark state Exchange Saturation Transfer (DEST) and lifetime line-broadening (ΔR2) NMR methodology. Some limitations of the DEST/ΔR2 methodology in applications to molecular systems with intermediate molecular weights are discussed, along with the means of overcoming these limitations with the help of closely related exchange NMR techniques, such as the measurements of Carr-Purcell-Meiboom-Gill (CPMG) relaxation dispersion, exchange-induced chemical shifts or rapidly-relaxing components of relaxation decays. Some theoretical underpinnings of the quantitative description of global dynamics of proteins on the surface of very high molecular weight particles (nanoparticles) are discussed. Subsequently, several applications of DEST/ΔR2 methodology are described from a methodological perspective with an emphasis on providing examples of how kinetic and relaxation parameters for exchanging systems can be reliably extracted from NMR data for each particular model of exchange. Among exchanging systems that are not associated with high molecular weight species, we describe several exchange NMR-based studies that focus on kinetic modelling of transient pre-nucleation oligomerization of huntingtin peptides that precedes aggregation and fibril formation.

Keywords: Dark state exchange saturation transfer (DEST); Exchange-induced chemical shifts; Fast component of relaxation decay; Lifetime line-broadening; Relaxation dispersion.


Conflict of interest statement

Declaration of Competing Interest The authors declare that they have no known competing financial interests or personal relationships that could have appeared to influence the work reported in this paper.

Figures

Figure 1.
Figure 1.
Modelling of the global dynamics of the protein ubiquitin on the surface of liposome particles. Ubiquitin was chosen as its interaction with liposomes is weak, thereby permitting information in the liposome-bound bound state to be rapidly transferred to the readily observable free state. (A) Ubiquitin (grey ribbon) rotates about an axis (red) perpendicular to the surface of a lipid-based nanoparticle (blue) and wobbles in a cone of semi-angle β0. (B) The relationship between the internal rotation axis (red) and the axes of the protein inertia tensor (blue) is described by two polar angles: θ, the angle between the internal rotation axis and the z axis of the inertia tensor; and φ, the angle between the x axis and the projection of the internal rotation axis on the x-y plane of the inertia tensor. Adapted from Ceccon et al. [15] published in J. Am. Chem. Soc. (American Chemical Society) while the authors were U.S. Government employees at the National Institutes of Health.
Figure 2.
Figure 2.
(A) Plot of 1HΓ2app versus 1HΓ2calc calculated using the parameters of exchange between a free protein and a protein in complex with large unilamellar lipid vesicles (LUVs) (k1 = 50 s−1; k−1 = 51,000 s−1; R2A=10 s1;R2B=13,500 s1). The asymptotic limit calculated using Eq. (20) is shown with the dashed red line. The inset shows the same plot calculated for the interaction between a protein and small unilamellar lipid vesicles (SUVs) (k1 = 225 s−1; k−1 = 51,000 s−1; R2A=10 s1; R2B=1,500 s1). (B) Plot of the ratio of methyl 1H to methyl 13CΓ2app versus 1H-Γ2 in the bound state. The region of the plot for 1H-Γ2 ≤ 105 s−1 is zoomed in the inset. Adapted from Ceccon et al. [16] published in J. Biomol. NMR while the authors were U.S. Government employees at the National Institutes of Health.
Figure 3.
Figure 3.
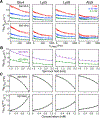
Examples of 15N-DEST profiles of (A) Glu3 in the 50 μM Aβ40 sample (15N-ω1 = 170 Hz); (B-D) Glu3, Leu17 and Asn27 in the 270 μM Aβ40 sample obtained with 15N-ω1 = 170 Hz (orange circles) and 350 Hz (blue circles). The solid line in A is the calculated 15N-DEST profile with the experimentally determined relaxation rates for monomeric Aβ40. The dashed and solid lines in (B)-(D) are the best fits to a two-state exchange model with a single protofibril-bound state, and to a model incorporating residues tethered and in direct contact with the protofibril (see Fig. 4), respectively. (E) Observed (black filled-in circles) versus calculated ΔR2 values for the two-state model (grey circles) and the tethered/direct-contact model in Fig. 4 (blue circles). Adapted from Fawzi et al. [2] published in Nature while the authors were U.S. Government employees at the National Institutes of Health.
Figure 4.
Figure 4.
Kinetic scheme for residue-specific monomer exchange on the surface of Aβ protofibrils. Circles represent a single residue of Aβ that can exist in three possible chain configurations: (1) a monomer, (2) tethered to, or (3) in direct contact with Aβ protofibrils. Adapted from Fawzi et al. [2] published in Nature while the authors were U.S. Government employees at the National Institutes of Health.
Figure 5.
Figure 5.
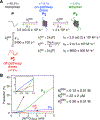
Kinetics of Aβ40 binding to GroEL. (A) Two-state exchange model describing the association of Aβ40 with GroEL. (B) Illustration of the three possible binding configurations of Aβ40 in the cavity of GroEL. Either the central hydrophobic region or the C-terminal hydrophobic region of Aβ40, or both hydrophobic regions are in contact with GroEL. All the three bound configurations inter-convert faster than the rate of exchange between free and GroEL-bound Aβ40. Adapted from Libich et al. [6] published in Proc. Natl. Acad. Sci. U. S. A. while the authors were U.S. Government employees at the National Institutes of Health.
Figure 6.
Figure 6.
Four-state exchange model describing the interactions of Fyn-SH3VPL with apo-GroEL. F and I represent the free folded and intermediate states, respectively, of Fyn-SH3VPL, while F-G and I-G are the corresponding GroEL-bound states. The values of the rate constants and populations obtained for the 15N/protonated SH3 samples from the simultaneous fits to the 15N CPMG relaxation dispersion, DEST, and ΔR2 data obtained at 10 °C are indicated. Ribbon diagrams of the free F and I states of Fyn-SH3VPL together with the side chain of Phe4 are shown at the top, while the top view of one cylinder of GroEL, shown as a ribbon with the seven subunits indicated by different colors, and a surface representation of the SH3 domain (red) placed in the cavity, are shown at the bottom. Adapted from Libich et al. [7] published in Proc. Natl. Acad. Sci. U. S. A. while the authors were U.S. Government employees at the National Institutes of Health.
Figure 7.
Figure 7.
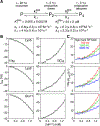
Simulations of 15N-CPMG profiles for the four-state model in Fig. 6. Each panel shows the same simulations for different values of ΔωF,I assumed to be equal to ΔωF,I-G (i.e., ΔωI,I-G = 0). Black curves show relaxation dispersions calculated for a two-state system with the interconversion rate constants between the F and I states, kFI and kIF, set to the experimentally determined values of 7.5 s−1 and 310 s−1, respectively. Red curves show relaxation dispersions calculated using the four-state model with parameters shown in Fig. 6. Blue curves show relaxation dispersions for a four-state model where the F-G and I-G states do not interconvert directly with one another (i.e. kGFI=kGIF=0), konapp=6,60,600, and 6000 s−1, and the population of the I-G state, pI-G, is kept constant by proportionately scaling koff (i.e. koff = 20, 200, 2000, and 2 × 10⁴ s−1), and the remaining rate constants and R2 values are set to the same values as in the red curves. Adapted from Libich et al. [7] published in Proc. Natl. Acad. Sci. U. S. A. while the authors were U.S. Government employees at the National Institutes of Health.
Figure 8.
Figure 8.
Kinetic scheme for the interaction of Fyn-SH3VPLΔ56 with apo-GroEL. The populations of states UE and UB, shown in grey, are below the limits of detection and were therefore not included in analysis. The rate constants and populations relate to experimental conditions of 100 μM SH3 domain and 120 μM GroEL (in subunits) at 10 °C. Binding of the dimer FD to GroEL is assumed to be undetectable because dimerization occludes the GroEL-binding surface. Adapted from Libich et al. [9] published in Biochemistry while the authors were U.S. Government employees at the National Institutes of Health.
Figure 9.
Figure 9.
Average <15NR2B> values for Fyn-SH3VPLΔ56 (red) and Fyn-SH3WTΔ57 (black) bound to GroEL as a function of the population of the GroEL-bound state, pB (%). The <15NR2B> values were determined from minimization of the target functions for either Fyn-SH3VPLΔ56 (red, 900 MHz) or Fyn-SH3WTΔ57 (black, 800 MHz) at fixed values of the population of SH3 bound to GroEL (pB). The regions highlighted in grey denote the ranges of pB that correspond to realistic <15NR2B> values for the SH3-GroEL complexes at 10°C. Adapted from Libich et al. [9] published in Biochemistry while the authors were U.S. Government employees at the National Institutes of Health.
Figure 10.
Figure 10.
Dependence of 15N-ΔR2 on the angle γ (deg.) in the presence of (A) LUVs and (B) SUVs. The experimental 15N-ΔR2 data are shown as blue circles, and the best-fit curves obtained from a global fit to all the LUV and SUV experimental ΔR2 data are shown in red (obtained with Sw2 = 0.5 and τw = 300 ns in Eq. (13)). Adapted from Ceccon et al. [15] published in J. Am. Chem. Soc. (American Chemical Society) while the authors were U.S. Government employees at the National Institutes of Health.
Figure 11.
Figure 11.
Experimental 1HmΓ2app and 13CmΓ2app values measured for methyl groups in ubiquitin in the presence of Gd3+-tagged negatively charged POPG (A) LUV liposomes (filled red circles; 1:2 ubiquitin:lipid molar ratio) and (B) SUV liposomes (filled blue circles; 1:0.5 ubiquitin:lipid molar ratio). The dashed horizontal lines in panels A and B show the approximate level of the PRE background. Control PRE values obtained for methyls of ubiquitin with zwitterionic POPC liposomes are shown with open red and blue circles for LUV and SUV particles, respectively, and yield PREs that are essentially all in the background, indicating that the interaction of ubiquitin with negatively charged liposomes is specific and requires a positively charged patch on the surface of ubiquitin. The regions in proximity to ubiquitin-liposome binding interface are highlighted in grey. (C) Experimental ratios of 1H and 13C PREs, R=(1HmΓ2app)/(13CmΓ2app) obtained for ubiquitin in the presence of negatively charged POPG LUV (filled red circles) and SUV (filled blue circles) nanoparticles. As controls, the values of R obtained for ubiquitin in the presence of zwitterionic POPC liposomes are shown with open red circles, and those for GB1 (which does not bind to liposomes) in the presence of negatively charged POPG liposomes are shown with filled black circles. The theoretical ratio of (γH/γC)2 = 16 predicted in the absence of binding is displayed by the horizontal dashed line. Adapted from Ceccon et al. [16] published in J. Biomol. NMR while the authors were U.S. Government employees at the National Institutes of Health.
Figure 12.
Figure 12.
Dependence of 15N-ΔR2 values on the angle γ for mono- (Ub1) and di- (Ub2) ubiquitin. Plots of 15N-ΔR2 versus γ for (A) mono-ubiquitin (Ub1); and the distal (left) and proximal (right) domains of (B) K63- and (C) K48-linked di-ubiquitin Ub2 (700 MHz). The experimental data points are shown as filled-in and open circles for LUVs and SUVs, respectively. The best-fit curves from the combined analysis of the LUV and SUV data using the spectral density function in Eq. 13, are shown with black lines. In the inset cartoons, the 15N-labeled domains of Ub2 are depicted as filled-in circles with the distal and proximal domains of Ub2 in red and blue, respectively. (D) Schematic representation of the three potential binding modes of Ub2 to lipid-based nanoparticles with the ‘NMR-active’ ([15N/2H]-labeled) domain shown in green. Adapted from Ceccon et al. [17] published in J. Phys. Chem. Lett. (American Chemical Society) while the authors were U.S. Government employees at the National Institutes of Health.
Figure 13.
Figure 13.
(A) Simulated profiles of Cfast as a function of 15N frequency offset for Lys5 of httNT (red) and httNTQ7 (blue) in the presence of SUV vesicles. The curves were calculated using a variant of Eq. (16) that accounts for Δω ≠ 0, with the following values for the exchange parameters (the values in parentheses refer to httNTQ7): kex = 205 (208) s−1; pB = 0.07 (0.08); R1A=R1B=1.5 (1.5) s1; R2A=2.4 (3.6) s1; R2B=2,300 (2,300) s1; ω1 = 2000 Hz; number of spin locks N = 2; and Δω = −211.8 Hz. (B) Experimental 15NCfastmax profiles measured for httNT (red filled-in circles) and httNTQ7 (blue filled circles) in the presence of SUVs. The open circles are the best-fit profiles obtained by including Cfastmax into the target function together with 15N-DEST and ΔR2 profiles. (C) Kinetic scheme used for modelling the binding of httNT and httNTQ7 to the surface of SUVs. Adapted from Ceccon et al. [18] published in J. Phys. Chem. B (American Chemical Society) while the authors were U.S. Government employees at the National Institutes of Health.
Figure 14.
Figure 14.
Examples of (A) 15N-DEST profiles and (B) 15N-ΔR2 as a function of residue, observed for 300 μM 15N-labeled httNT in the presence of 5 g/L TiO2 nanoparticles in the dark (600 MHz; 10 °C). Circles represent experimental data, and solid lines are best-fits to a three-state exchange model shown in red at the bottom of panel B. The data for Leu3 and the three C-terminal residues of httNT required a separate treatment and were fitted to the three-state model shown in grey. This exchange model subsumes initial binding to the TiO2 particle followed by reversible detachment from its surface (state PTred, where ‘T’ denotes ‘tethered’). The rate constants kBT and kTB (calculated a posteriori as for the binding of httNT to SUV liposomes in the model of Fig. 13B–C using Eqs. (21)), fall in the ranges 40 to 75 s−1 and 160 to 240 s−1, respectively, depending on the assumed red population of the diffusion-restricted state, PRred. Reversible detachment of these 4 residues from the nanoparticle surface occurs ~3-fold slower than the binding proper (PRredPBred). Adapted from Ceccon et al. [21] published in J. Am. Chem. Soc. (American Chemical Society) while the authors were U.S. Government employees at the National Institutes of Health.
Figure 15.
Figure 15.
Overall kinetic scheme for the binding httNT to TiO2 nanoparticles coupled with oxidation of httNT to the Met7 sulfoxide form by H2O2 either in solution or on the surface of the nanoparticles. States in contact with TiO2 particles are shaded. Adapted from Ceccon et al. [21] published in J. Am. Chem. Soc. (American Chemical Society) while the authors were U.S. Government employees at the National Institutes of Health.
Figure 16.
Figure 16.
Representative concentration-dependent (A) 13Cα CPMG relaxation dispersion profiles (900 and 600 MHz), and (B) 13δex values (800 MHz) for httNTQ7 (5 °C). The experimental data are shown as open circles. The best-fit curves from a global fit to the kinetic model shown in Fig. 18 are represented by continuous lines. Adapted from Kotler et al. [30] published in Proc. Natl. Acad. Sci. U. S. A. while the authors were U.S. Government employees at the National Institutes of Health.
Figure 17.
Figure 17.
Representative (A) 15N-CPMG relaxation dispersion profiles obtained at 900 and 600 MHz at three concentrations of httNTQ7 (1.0, 0.75, and 0.4 mM; 5 °C), (B) 15N-R relaxation dispersion profiles obtained at 800 and 600 MHz at a concentration of 1.0 mM, and (C) 15N-δex and 15NR21kHz as a function of httNTQ7 concentration (800 MHz; 5 °C). The experimental data are shown as open circles. The best-fit curves from a global fit to the kinetic model shown in Fig. 18 are represented by continuous lines. Adapted from Kotler et al. [30] published in Proc. Natl. Acad. Sci. U. S. A. while the authors were U.S. Government employees at the National Institutes of Health.
Figure 18.
Figure 18.
(A) Kinetic model used to fit all the concentration-dependent NMR data for httNTQ7. The population of the various species at [httNTQ7] = 1.2 mM, the highest concentration used in NMR experiments, is provided in parentheses above each species. (B) Simulation of the population of each species (in monomer units) as a function of total peptide concentration using the rate constants determined from the global fit. The inset shows an expanded view of the dependence over the concentration range used in NMR experiments (0.05 to 1.2 mM). Adapted from Kotler et al. [30] published in Proc. Natl. Acad. Sci. U. S. A. while the authors were U.S. Government employees at the National Institutes of Health.
Figure 19.
Figure 19.
Kinetic scheme for oligomerization of the full-length exon-1 peptide, httex1Q7 containing a seven residue polyglutamine repeat. (A) The ‘on-pathway’ fast branch (τex = 1/kex < 50 μs) leading to the formation of the tetramer P4 via the dimer P2 is shown in black, while the slow ‘off-pathway’ process (τex ~ 750 μs) leading to the formation of the ‘non-productive’ dimer, P2*, is shown in grey. The fractional populations of each species indicated above the scheme correspond to [httex1] = 1.2 mM. Simulated (B) 15N-δex and (C) 15N-R2,eff relaxation rates for the ‘off-pathway’ (grey) and ‘on-pathway’ (red) branches and the full 4-state scheme of httex1 oligomerization (black) as a function of httex1 concentration. 15N-R2,eff values were obtained from on-resonance R rates calculated for a spin-lock RF field strength of 1 kHz. Dashed horizontal lines are drawn at zero for comparison. 15N-Δω was set to −1.1 and −3.1 ppm for the ‘off-pathway’ dimer and the ‘on-pathway’ dimer P2 and tetramer P4 (assumed the same), respectively, and 15N-R2 was set to 5.0 s−1, while the R2 of P2 and P4 were assumed to scale as 2R2 and 4R2, respectively. Adapted from Ceccon et al. [76] published in J. Phys. Chem. Lett. (American Chemical Society) while the authors were U.S. Government employees at the National Institutes of Health.
Figure 20.
Figure 20.
(A) Simplified kinetic model of ‘on-pathway’ oligomerization of httex1. The populations of each species indicated above the scheme correspond to those at [httex1] = 1.2 mM. Examples of (B) 15N/13Cα-δex and (C) 15N-R2,eff values obtained over the range of httex1 concentrations between 0.1 and 1.4 mM (800 MHz, 5 °C). 15N-R2,eff values obtained at RF spin-lock field strengths of 0.75, 1.5 and 3.0 kHz are shown in red, green and blue, respectively. The experimental data are shown as circles; the continuous lines represent the best global fit to the kinetic model shown in (A). Adapted from Ceccon et al. [76] published in J. Phys. Chem. Lett. (American Chemical Society) while the authors were U.S. Government employees at the National Institutes of Health.
Figure 21.
Figure 21.
(A) Scheme for the binding of profilin to the two polyproline tracts, P11 and P10, of httex1Q7. (B) Simulation of the populations of each species during the course of the titrations in each direction, using the best-fit parameters for the equilibrium dissociation constants and cooperativity factor α. Adapted from Ceccon et al. [32] published in Proc. Natl. Acad. Sci. U. S. A. while the authors were U.S. Government employees at the National Institutes of Health.
Figure 22.
Figure 22.
(A) Concentration dependence of 15N- (top, blue circles) and 13Cα- (bottom, red circles) δex of httex1Q7 in the presence of 4.8 mM profilin (800 MHz; 5 °C). The 15N- and 13Cα-δex values obtained for httex1Q7 in the absence of profilin are shown in grey for comparison. The thick black solid lines represent the back-calculated 15N-(top) and 13Cα-(bottom) δex for 15N and 13Cα Δω values of 2 and 3 ppm, respectively. (B) Examples of 15N-CPMG relaxation dispersion profiles acquired at 600 (filled-in circles) and 800 (open circles) MHz on 0.4 (green) and 0.75 (blue) mM 15N-labeled httex1Q7 in the presence of 4.8 mM profilin. The solid lines are the best-fit curves obtained from global fitting of the 15N-CPMG relaxation dispersion data to the two-state exchange system shown in black in panel C. (C) Overall kinetic scheme for the oligomerization of httex1Q7-bound to profilin. The populations of the species correspond to [httex1Q7] = 0.75 mM. Adapted from Ceccon et al. [32] published in Proc. Natl. Acad. Sci. U. S. A. while the authors were U.S. Government employees at the National Institutes of Health.
Figure 23.
Figure 23.
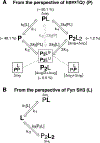
Binding scheme for Fyn-SH3-httex1Q7 interactions viewed from the perspective of (A) httex1Q7 and (B) Fyn-SH3. The bold font denotes the magnetization of the isotopically labeled species. Δωi are the differences in chemical shifts with respect to the major NMR observable state: either monomeric httex1Q7 (P) or free Fyn-SH3 (L). ki and k−1 are second order association and first order dissociation rate constants, respectively. The species populations, shown in parentheses in (A), relate to [httex1Q7] = 0.1 mM in the presence of 0.3 mM FynSH3. The equilibrium dissociation constants (mM), expressed in terms of the rate constants, are given by: KD1 = k−1/k1; KD2 = k−2/2k2; KD3 = 2k−3/k3; KD4 = k−4/k4; and KD1KD3 = KD2KD4. The optimized values of rate constants are: k1 = k3 = 6.4 (±0.7) × 107 M−1s−1, k2 = k4 = 4.5 (±0.5) × 106 M−1s−1; k−1 = 1.6 (±0.3) × 104 s−1, k−2 = 2.9 (±0.3) × 104 s−1, k−3 = 7.2 (±1.9) × 103 s−1, and k−4 = 1.4 (±0.5) × 104 s−1, while the derived equilibrium dissociation constants are: KD1 = 0.25 ± 0.05 mM, KD2 = 3.3 ± 1.0 mM, KD3 = 0.30 ± 0.03 mM, and KD4 = 3.0 ± 0.7 mM. See text for further explanation. Adapted from Ceccon et al. [33] published in J. Am. Chem. Soc. (American Chemical Society) while the authors were U.S. Government employees at the National Institutes of Health.
Figure 24.
Figure 24.
Selected examples of 15N and 13Cα CEST profiles for native (A and B) and (Met7O) (C and D) httNTQ7 in the presence of micelles (700 MHz; 10 °C). CEST profiles were recorded with ω1 field strengths of 5 (green), 15 (red) and 25 (blue) Hz. The experimental data are shown as circles and the best-fit profiles for a two-state exchange model as continuous lines. Adapted from Ceccon et al. [31] published in J. Am. Chem. Soc. (American Chemical Society) while the authors were U.S. Government employees at the National Institutes of Health.
Figure 25.
Figure 25.
(A) Three-state model for the binding of httNTQn to lipid micelles that involves dimerization of httNTQn on the micelle surface. The overall bound state, PB (shown in green), comprises an equilibrium mixture of monomeric (PBmon) and dimeric (PBdim) states. (B) Average number of monomer and dimer particles bound per micelle calculated using the optimized values of KD and Keq. Adapted from Ceccon et al. [31] published in J. Am. Chem. Soc. (American Chemical Society) while the authors were U.S. Government employees at the National Institutes of Health.

References

    1. Fawzi NL, Ying J, Torchia DA, Clore GM, Kinetics of amyloid β monomer-to-oligomer exchange by NMR relaxation, J. Am. Chem. Soc, 132 (2010) 9948–9951. - PMC - PubMed
    1. Fawzi NL, Ying J, Ghirlando R, Torchia DA, Clore GM, Atomic-resolution dynamics on the surface of amyloid β protofibrils probed by solution NMR, Nature, 480 (2011) 268–272. - PMC - PubMed
    1. Fawzi NL, Ying J, Torchia DA, Clore GM, Probing exchange kinetics and atomic resolution dynamics in high molecular weight complexes using dark-state exchange saturation transfer NMR spectroscopy, Nat. Protoc, 7 (2012) 1523–1533. - PMC - PubMed
    1. Fawzi NL, Libich DS, Ying J, Tugarinov V, Clore GM, Characterizing methyl-bearing side chain contacts and dynamics mediating amyloid beta protofibril interactions using 13Cmethyl-DEST and lifetime line-broadening, Angew. Chem. Int. Ed. Engl, 53 (2014) 10345–10349. - PMC - PubMed
    1. Conicella AE, Fawzi NL, The C-terminal threonine of Aβ43 nucleates toxic aggregation via structural and dynamical changes in monomers and protofibrils, Biochemistry, 53 (2014) 3095–3105. - PMC - PubMed

Publication types

MeSH terms