. 2022 Feb 23:13:839139.
doi: 10.3389/fphys.2022.839139. eCollection 2022.

Long-Term Cultivation of Human Atrial Myocardium

Affiliations

Long-Term Cultivation of Human Atrial Myocardium

Maximilian J Klumm et al. Front Physiol. .

Erratum in

Abstract

Organotypic culture of human ventricular myocardium is emerging in basic and translational cardiac research. However, few institutions have access to human ventricular tissue, whereas atrial tissue is more commonly available and important for studying atrial physiology. This study presents a method for long-term cultivation of beating human atrial myocardium. After written informed consent, tissues from the right-atrial appendage were obtained from patients with sinus rhythm undergoing open heart surgery with cardiopulmonary bypass. Trabeculae (pectinate muscles) prepared from the samples were installed into cultivation chambers at 37°C with a diastolic preload of 500 μN. After 2 days with 0.5 Hz pacing, stimulation frequency was set to 1 Hz. Contractile force was monitored continuously. Beta-adrenergic response, refractory period (RP) and maximum captured frequency (fmax) were assessed periodically. After cultivation, viability and electromechanical function were investigated, as well as the expression of several genes important for intracellular Ca2+ cycling and electrophysiology. Tissue microstructure was analyzed by confocal microscopy. We cultivated 19 constantly beating trabeculae from 8 patient samples for 12 days and 4 trabeculae from 3 specimen for 21 days. Functional parameters were compared directly after installation (0 d) with those after 12 d in culture. Contraction force was 384 ± 69 μN at 0 d and 255 ± 90 μN at 12 d (p = 0.8, n = 22), RP 480 ± 97 ms and 408 ± 78 ms (p = 0.3, n = 9), fmax 3.0 ± 0.5 Hz and 3.8 ± 0.5 Hz (p = 0.18, n = 9), respectively. Application of 100 nM isoprenaline to 11 trabeculae at 7 d increased contraction force from 168 ± 35 μN to 361 ± 60 μN (p < 0.01), fmax from 6.4 ± 0.6 Hz to 8.5 ± 0.4 Hz (p < 0.01) and lowered RP from 319 ± 22 ms to 223 ± 15 ms. CACNA1c (L-type Ca2+ channel subunit) and GJA1 (connexin-43) mRNA expressions were not significantly altered at 12 d vs 0 d, while ATP2A (SERCA) and KCNJ4 (Kir2.3) were downregulated, and KCNJ2 (Kir2.1) was upregulated. Simultaneous Ca2+ imaging and force recording showed preserved excitation-contraction coupling in cultivated trabeculae. Confocal microscopy indicated preserved cardiomyocyte structure, unaltered amounts of extracellular matrix and gap junctions. MTT assays confirmed viability at 12 d. We established a workflow that allows for stable cultivation and functional analysis of beating human atrial myocardium for up to 3 weeks. This method may lead to novel insights into the physiology and pathophysiology of human atrial myocardium.

Keywords: calcium imaging; confocal microscopy; gene expression; human atrium; in vitro; refractory period; tissue culture.


Conflict of interest statement

TS is shareholder of InVitroSys GmbH. The remaining authors declare that the research was conducted in the absence of any commercial or financial relationships that could be construed as a potential conflict of interest.

Figures

FIGURE 1
FIGURE 1
Preparation of pectinate muscles (trabeculae) from right atrial appendage (RAA) samples for tissue culture. (A) RAA obtained during cardiac surgery, stored and transported in cold cardioplegic solution. Diameter of the petri dish is 100 mm. (B) Inspection of the RAA interior, displaying the typical trabecular meshwork. (C) Trabeculae were carefully dissected with a scalpel while fixing the tissue with pins on a rubber layer. (D) Excised trabecula. (E) Plastic triangles glued to the longitudinal ends of the trabecula. (F) Prepared trabeculae in cold Tyrode’s solution containing BDM in a standard tissue culture petri dish. Diameter of the displayed dish is 60 mm. (G) Trabeculae were installed into cultivation chambers by mounting the plastic triangles on a spring wire (top) and a stiff wire (bottom). (H) Adjustment for trabecula length and setting of a defined preload is achieved by moving the stiff wire, which is attached to a bolt and nut, using a hex screwdriver. See also the Supplementary Videos 1, 2.
FIGURE 2
FIGURE 2
Schematic of contraction analysis. Diastolic force (FD, preload) and maximum force (Fmax) were respectively determined from the minimum and maximum spring wire deflections during a contraction cycle, multiplied by the spring constant. The force of contraction was then identified with the resulting amplitude, Famp = Fmax - FD. Contraction kinetics were assessed by using FD + 10% of Famp as a threshold for start and end of a contraction. Thus, the parameters contraction duration (CD90), time to peak (TTP90) and time to relaxation (TTR90) were calculated.
FIGURE 3
FIGURE 3
Assessment of tissue viability. (A) Photograph of an unstained trabecula. Width of the plastic triangles is 7 mm. (B) Photograph of a fresh trabecula after incubation with the tetrazolium dye MTT for 15 min. The intensity of the dark purple color indicates the amount of MTT enzymatically reduced to formazan. (C) Photograph of a trabecula cultivated for 12 days after 15 min of MTT incubation from the same specimen as panel (B). (D) Results from photometric analysis of the amount of formazan produced from MTT, normalized to total protein of fresh trabeculae (0 d) and trabeculae from matching specimens cultivated for 12 days (12 d). N = 5/5 trabeculae/samples. The unequal variances t-test was applied for statistical analysis.
FIGURE 4
FIGURE 4
Contraction force of trabeculae cultivated for 12 days. (A) Overview of an example showing the measured force, F. Spikes result from pacing protocols, addition of isoprenaline and medium exchanges. (B,C) Magnifications of periods indicated by arrows in panel (A), showing single contractions. Pacing rate during the displayed periods was 0.5 Hz. Rocking for medium agitation was turned off, causing the amplitudes to appear smaller than at the corresponding time points in panel (A). (D) Mean contraction force amplitudes, Famp, of 22 trabeculae from 8 tissue samples. Error bars indicate SEM.
FIGURE 5
FIGURE 5
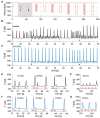
Assessment of refractory period (RP) and maximum frequency captured (fmax). (A) Stimulation intervals during the pacing protocol, showing successive periods of decreasing interval lengths intermitted by 20-s periods with a baseline interval of 2000 ms. After each S1-S2 beat period (*), a period with constant pacing at the corresponding frequency (§) followed. Note the logarithmic Y-axis scale. (B,C) Force, F, measured during the period marked by the gray area in panel (A) of a trabecula (B) before, and (C) 15 min after treatment with 100 nM dofetilide. Closed arrow heads indicate the start of medium agitation by the rocker, causing shaking artifacts. Open arrow heads indicate rocker stop. (D) S1-S2 beat periods before addition of dofetilide (control) at S2 beat intervals of 750, 500, and 400 ms. Red triangles indicate detected contractions, red vertical bars and numbers indicate stimulation time points and intervals, respectively. (E) Period of pacing with 3.3 Hz (200 bpm) before addition of dofetilide (control). (F) S1-S2 beat periods after addition of dofetilide at S2 beat intervals of 750, 500, and 400 ms (same trabecula as D,E). (G) Period of pacing with 3.3 Hz (200 bpm) after addition of dofetilide.
FIGURE 6
FIGURE 6
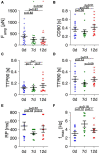
Analysis of contraction amplitudes, kinetics and pacing response in fresh and cultivated trabeculae. (A) Contraction force amplitudes (Famp) of fresh (0 d) trabeculae and trabeculae cultivated for 7 (7 d) and 12 days (12 d) at 1 Hz pacing. (B) Contraction duration (CD90), (C) time to peak (TTP90), and (D) time to relaxation (TTR90) at 1 Hz pacing. (E) Refractory period (RP), (F) Maximum frequency captured (fmax). (N) = 22/7 trabeculae/samples in panel (A), 13/7 in panels (B–D), and 9/6 in panels (E,F). A paired, two-sided t-test with Holm-Bonferroni multiple-comparison correction was applied.
FIGURE 7
FIGURE 7
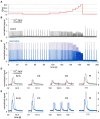
Example of simultaneous Ca2+ signal and contraction recording at 37°C in a trabecula after 22 days in culture. (A) Stimulation frequencies applied during the imaging to assess the force-frequency response and post-rest beat. (B) Overlay of normalized Ca2+ signal (solid line) and contraction force (dotted line) recorded during the shown stimulation protocol under control conditions. After offset subtraction, both signals were normalized to the respective amplitude in response to the first stimulus (0.5 Hz). (C) The same trabecula 5 min after application of 100 nM isoprenaline. (D,E) Normalized single contractions and corresponding Ca2+ signals recorded at different stimulation frequencies, and the post-rest (PR) beat at 5 s after the last 3 Hz stimulus. Stimulation times are indicated by red vertical bars next to the X-axis. Shown traces are magnifications of panels (B,C), respectively.
FIGURE 8
FIGURE 8
Effect of beta-adrenergic stimulation by isoprenaline on contraction amplitudes, kinetics, and pacing response in trabeculae at 7 days in culture. (A) Contraction force amplitudes (Famp) at control conditions (CTRL) and 5 min after addition of 100 nM isoprenaline (ISO), 1 Hz pacing. (B) Contraction duration (CD90), (C) time to peak (TTP90), and (D) time to relaxation (TTR90) at 1 Hz pacing. (E) Refractory period (RP), (F) Maximum frequency captured (fmax). N = 11/3 trabeculae/samples. A paired t-test was applied. *p < 0.05, **p < 0.01, ***p < 0.001.
FIGURE 9
FIGURE 9
Three-dimensional microscopic images of fresh and cultured trabeculae stained with WGA for the extracellular matrix and with antibodies against Cx43 and alpha-actinin. (A) XY- and XZ-view of the WGA (red) and Cx43 signal (cyan) of a fresh (non-cultivated) trabecula. Note that the overlay of the signals appears white. The scale bar applies to all images. (B) XY- and XZ-view of the WGA (red) and alpha-actinin signal (green) of the same region shown in panel (A). Note that the overlay of the signals appears yellow. (C) Extracellular matrix (gray) and myocytes (white) after computational segmentation and classification of the image stack shown in panels (A,B). (D–F) Images of a trabecula cultured for 12 d presented in analogy to panels (A–C). (G–I) Images of the same trabecula as in panels (D–F) from a different region, presented in analogy to panels (A–C). (J) Volume fractions of the extracellular matrix (ECM), myocytes, Cx43, and alpha-actinin (α-ACT). The results from three image stacks of each sample were averaged and treated as one data point. Paired, two-sided t-test. N = 4 trabeculae from 4 specimens (patients).
FIGURE 10
FIGURE 10
mRNA expression of genes related to Ca2+ cycling and electrophysiology analyzed by quantitative RT-PCR in fresh trabeculae (0 d) and trabeculae cultivated for 12 days (12 d). (A) CACNA1c subunit of the L-type Ca2+ channel (LTCC), (B) ATP2A2, encoding the sarcoplasmic/endoplasmic reticulum calcium ATPase 2 (SERCA2), (C) GJA1, encoding connexin-43 (Cx43), (D) KCNJ4, encoding the Kir2.3 subunit of the inwardly rectifying potassium channel, and (E) KCNJ2, encoding the Kir2.1 subunit of the inwardly rectifying potassium channel. N = 8/8 trabeculae/samples. A paired, two-sided t-test was applied. *p < 0.05, **p < 0.01.

References

    1. Abu-Khousa M., Fiegle D. J., Sommer S. T., Minabari G., Milting H., Heim C., et al. (2020). The degree of t-system remodeling predicts negative force-frequency relationship and prolonged relaxation time in failing human myocardium. Front. Physiol. 11:182. 10.3389/fphys.2020.00182 - DOI - PMC - PubMed
    1. Backx P. H., Gao W. D., Azan-Backx M. D., Marban E. (1995). The relationship between contractile force and intracellular [Ca2+] in intact rat cardiac trabeculae. J. Gen. Physiol. 105 1–19. 10.1085/jgp.105.1.1 - DOI - PMC - PubMed
    1. Banyasz T., Lozinskiy I., Payne C. E., Edelmann S., Norton B., Chen B., et al. (2008). Transformation of adult rat cardiac myocytes in primary culture. Exp. Physiol. 93 370–382. 10.1113/expphysiol.2007.040659 - DOI - PubMed
    1. Berridge M. V., Herst P. M., Tan A. S. (2005). Tetrazolium dyes as tools in cell biology: new insights into their cellular reduction. Biotechnol. Annu. Rev. 11 127–152. 10.1016/S1387-2656(05)11004-7 - DOI - PubMed
    1. Bluhm W. F., Kranias E. G., Dillmann W. H., Meyer M. (2000). Phospholamban: a major determinant of the cardiac force-frequency relationship. Am. J. Physiol. Heart Circ. Physiol. 278 H249–H255. 10.1152/ajpheart.2000.278.1.H249 - DOI - PubMed