Review
. 2022 Feb 25:12:760419.
doi: 10.3389/fendo.2021.760419. eCollection 2021.

Parathyroid Imaging: Past, Present, and Future

Affiliations
Review

Parathyroid Imaging: Past, Present, and Future

Michael A Morris et al. Front Endocrinol (Lausanne). .

Abstract

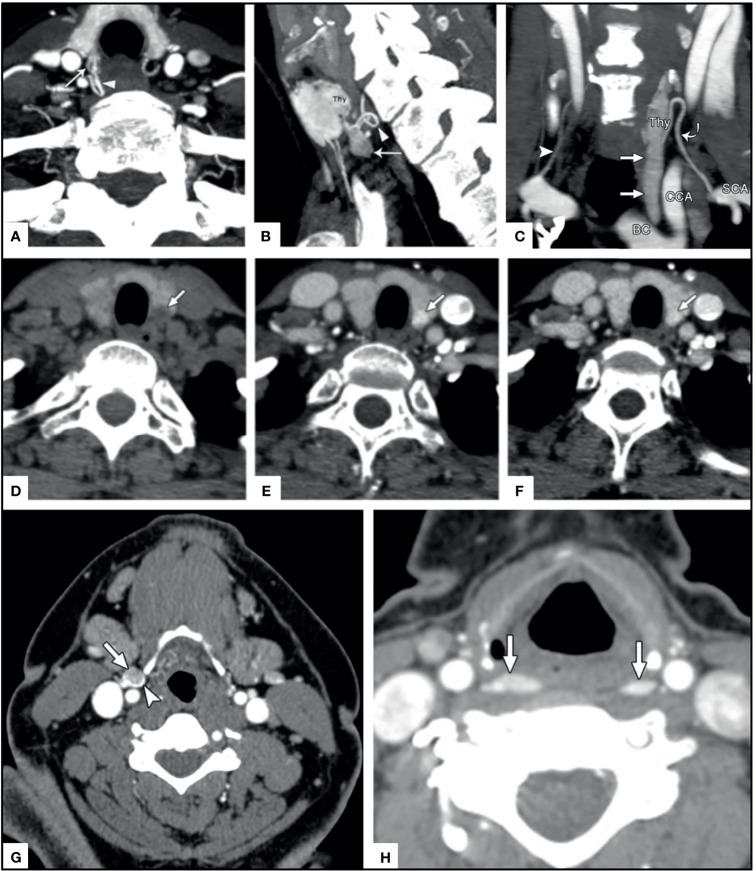
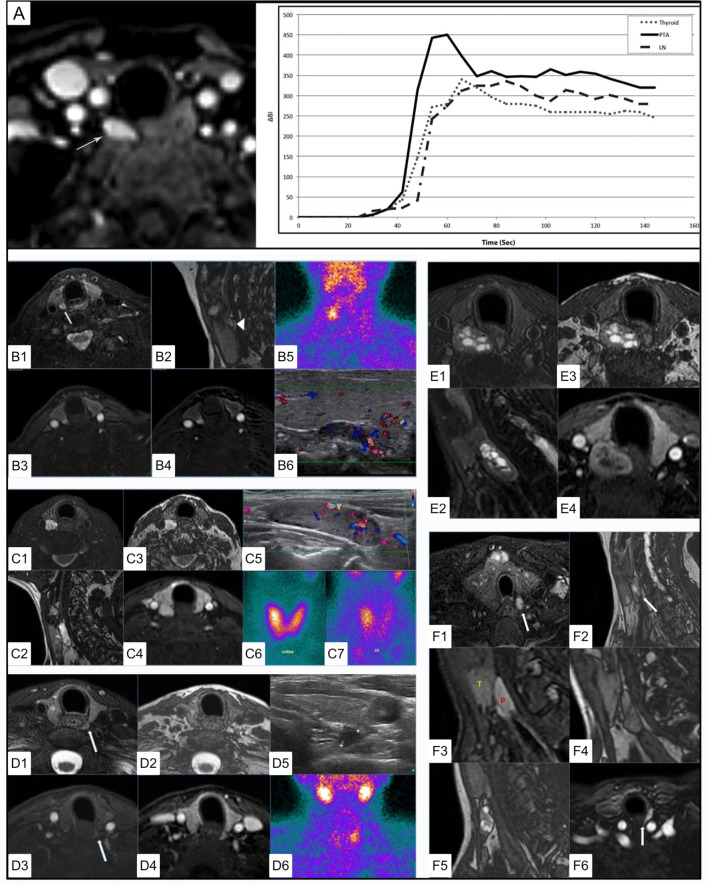
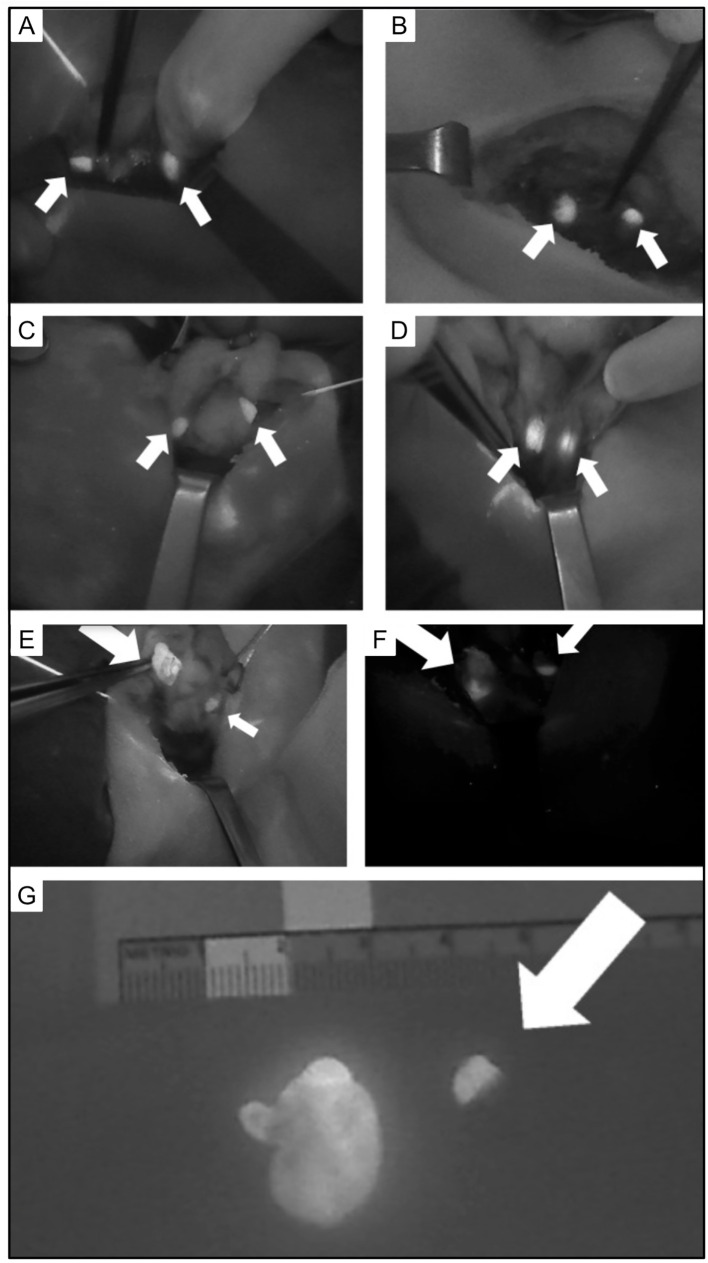
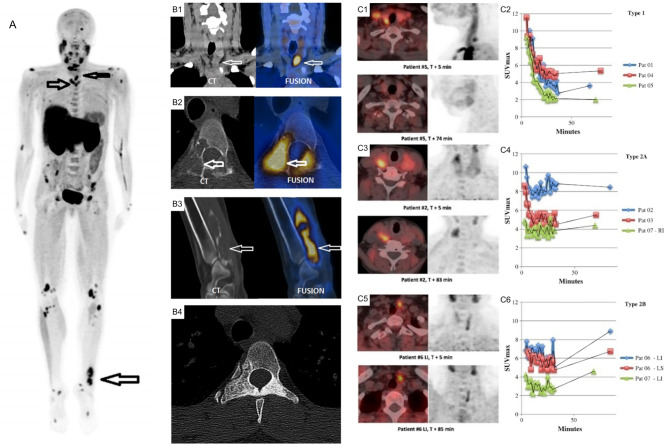
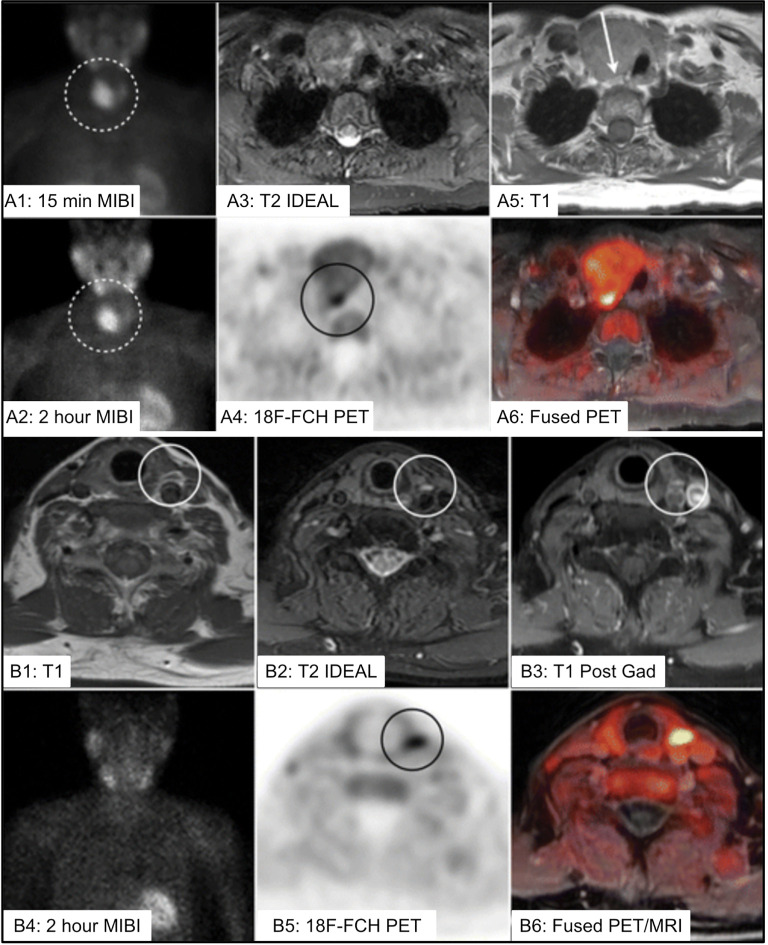
The goal of parathyroid imaging is to identify all sources of excess parathyroid hormone secretion pre-operatively. A variety of imaging approaches have been evaluated and utilized over the years for this purpose. Ultrasound relies solely on structural features and is without radiation, however is limited to superficial evaluation. 4DCT and 4DMRI provide enhancement characteristics in addition to structural features and dynamic enhancement has been investigated as a way to better distinguish parathyroid from adjacent structures. It is important to recognize that 4DCT provides valuable information however results in much higher radiation dose to the thyroid gland than the other available examinations, and therefore the optimal number of phases is an area of controversy. Single-photon scintigraphy with 99mTc-Sestamibi, or dual tracer 99mTc-pertechnetate and 99mTc-sestamibi with or without SPECT or SPECT/CT is part of the standard of care in many centers with availability and expertise in nuclear medicine. This molecular imaging approach detects cellular physiology such as mitochondria content found in parathyroid adenomas. Combining structural imaging such as CT or MRI with molecular imaging in a hybrid approach allows the ability to obtain robust structural and functional information in one examination. Hybrid PET/CT is widely available and provides improved imaging and quantification over SPECT or SPECT/CT. Emerging PET imaging techniques, such as 18F-Fluorocholine, have the exciting potential to reinvent parathyroid imaging. PET/MRI may be particularly well suited to parathyroid imaging, where available, because of the ability to perform dynamic contrast-enhanced imaging and co-registered 18F-Fluorocholine PET imaging simultaneously with low radiation dose to the thyroid. A targeted agent specific for a parathyroid tissue biomarker remains to be identified.

Keywords: 4D CT MR; PET; hyperparathyroidism; oncoradiology; parathyroid adenoma; parathyroid imaging; parathyroidectomy; scintigraphy.


Conflict of interest statement

The authors declare that the research was conducted in the absence of any commercial or financial relationships that could be construed as a potential conflict of interest.

Figures

Figure 1
Figure 1
Examples of ectopic PA (arrows) occurring in the neck (A–D) and mediastinum (E–H).
Figure 2
Figure 2
Early parathyroid scintigraphy using 75Se depicting a 2.3g parathyroid adenoma on the right. (A, B) 10 and 45 minutes after intravenous administration of radiotracer with tumor tracer localization and low tracer activity in the sternal region. (C, D) 2 h and 24 h after radiotracer administration with tumor tracer localization and increasing radiotracer activity in the sternal region. (E) Superimposition of thyroid scan onto parathyroid scintigraphy with 2.7 g parathyroid adenoma inferior to the left lobe of the thyroid. Reproduced with permission from: Colella AC, Pigorini F. Experience with parathyroid scintigraphy. Am J Roentgenol Radium Ther Nucl Med. 1970 Aug;109(4):714-23. doi: 10.2214/ajr.109.4.714. PMID: 5451873.
Figure 3
Figure 3
Early examples of parathyroid pathology detection using 99mTc-pertechnetate and thallium subtraction scintigraphy. Upper left panel (A) depicts 99mTc-pertechnetate thyroid uptake on the left image, 201Tl uptake in the middle image, and the subtraction image highlighting a left inferior parathyroid adenoma on the right image. Lower left panel (B) depicts a similar 201Tl minus 99mTc-pertechnetate series of three images of a left inferior parathyroid adenoma with decreased signal to noise ratio due to its location behind the clavicle contributing to increased attenuation relative to the series above. Right upper panel (C) depicts a similar subtraction series of a right superior parathyroid adenoma. Right lower panel (D) depicts a subtraction series of an ectopic parathyroid adenoma near the sternal notch. Reproduced with permission from: Ferlin G, Borsato N, Camerani M, Conte N, Zotti D. New perspectives in localizing enlarged parathyroids by technetium-thallium subtraction scan. J Nucl Med. 1983 May;24(5):438-41. PMID: 6842292.
Figure 4
Figure 4
Early 99mTc-sestamibi parathyroid imaging (A) with uniform uptake within the thyroid and more mild focal uptake in the left lower neck, inferior to the thyroid. (B) Delayed image shows decreased radiotracer uptake within the thyroid and increased radiotracer uptake within a 2.5g parathyroid adenoma (arrow). Example of dual tracer method (C–F) with left image depicting 99mTc-pertechnetate and right image depicting 99mTc-sestamibi showing a left PA (D) and right PA (F). Uptake not related to PA (arrows) can also be seen (G–R). Multinodular goiter 99mTc-pertechnetate (G) and 99mTc-sestamibi (H). Also depicted on 99mTc-sestamibi are (I) left axillary skin fold, (J) manubrium brown tumor, (K) meningioma, (L) deltoid implant, (M) diaphragmatic hernia anterior and (N) lateral, (O) retropharyngeal PA and goiter extending into mediastinum, (P) sternotomy, (Q) muscle uptake, (R) atelectasis adjacent to mediastinum on the right. Reproduced with permission from: Taillefer R, Boucher Y, Potvin C, Lambert R. Detection and localization of parathyroid adenomas in patients with hyperparathyroidism using a single radionuclide imaging procedure with technetium-99m-sestamibi (double-phase study). J Nucl Med. 1992 Oct;33(10):1801-7. PMID: 1328564.
Figure 5
Figure 5
99mTc-sestamibi with or without 99mTc-pertechnetate imaging is the current standard of care for PA detection at most institutions at the time of writing of this article. Thyroid nodules may confound parathyroid imaging using this method as they have variable uptake relative to the thyroid gland with 99mTc-pertechnetate (A, C, E, I) and with 99mTc-sestamibi (B, D, F, G, H). Although benign thyroid nodules typically washout on delayed 99mTc-sestamibi imaging (H), thyroid carcinoma [(G, H), white arrow] can have retained uptake similar to parathyroid adenoma [(G, H), black arrow]. Panel (J) provides an atlas of PA appearances on dual tracer 99mTc-sestamibi minus 99mTc-pertechnetate subtraction and the frequency of PA locations relative to the thyroid gland (highest frequency-black, lower frequency-grey). Superior PA are derived from the fourth pharyngeal pouch (P4) and therefore more posterior. Inferior PA are derived from the third pharyngeal pouch and therefore more anterior (P3). SPECT imaging can aid in distinguishing the anterior versus posterior location. Reproduced with permission from: (A–F) Földes I, Lévay A, Stotz G. Comparative scanning of thyroid nodules with technetium-99m pertechnetate and technetium-99m methoxyisobutylisonitrile. Eur J Nucl Med. 1993;20: 330–333. doi: 10.1007/BF00169809. (G–I) Lorberboym M, Ezri T, Schachter PP. Preoperative technetium Tc 99m sestamibi SPECT imaging in the management of primary hyperparathyroidism in patients with concomitant multinodular goiter. Arch Surg. 2005;140: 656–660. doi: 10.1001/archsurg.140.7.656. (J) Taïeb D, Hassad R, Sebag F, Colavolpe C, Guedj E, Hindié E, et al. Tomoscintigraphy improves the determination of the embryologic origin of parathyroid adenomas, especially in apparently inferior glands: imaging features and surgical implications. J Nucl Med Technol. 2007;35: 135–139. doi: 10.2967/jnmt.107.039743.
Figure 6
Figure 6
Parathyroid planar imaging should include the mediastinum, where a large percentage of ectopic PA occur. Planar scintigraphy of an ectopic PA (A) 20min and (B) delayed 2h. 99mTc-sestamibi SPECT/CT imaging can aid in anatomical localization and is particularly helpful for ectopic PA. 99mTc-sestamibi SPECT/CT of mediastinal PA on axial SPECT [(C)-black arrow], axial CT [(D)-white arrow], and axial fused SPECT/CT [(E)-white arrow]. 99mTc-sestamibi SPECT/CT of an ectopic PA in a particularly rare position near the right piriform sinus on coronal CECT [(F)-black arrow], coronal SPECT [(G)-black arrow], coronal fused SPECT/CT [(H)-black arrow], axial CECT [(I)-black arrow], axial fused SPECT/CT [(J)-black arrow]. SPECT imaging can also be helpful when planar imaging is negative (K, M, N) as in (L) showing mediastinal PA (arrow) adjacent to the cardiac border. Another PA behind the left lobe of the thyroid was not identified on planar anterior early 99mTc-sestamibi (M), delayed 99mTc-sestamibi (N), or on planar oblique images (O, P), but was identified on SPECT [(Q, R), arrows]. Reproduced with permission from: (A–E) Wong KK, Fig LM, Gross MD, Dwamena BA. Parathyroid adenoma localization with 99mTc-sestamibi SPECT/CT: a meta-analysis. Nucl Med Commun. 2015 Apr;36(4):363-75. doi: 10.1097/MNM.0000000000000262. PMID: 25642803. (F–J) Hsieh MP, Nemer JS, Beylergil V, Yeh R. Ectopic Parathyroid Adenoma of the Piriform Sinus on Parathyroid 4D-CT and 99mTc-MIBI SPECT/CT. Clin Nucl Med. 2020 Aug;45(8):e358-e359. doi: 10.1097/RLU.0000000000003163. PMID: 32558723.
Figure 7
Figure 7
Ultrasound imaging of parathyroid adenoma (red arrows). Right superior PA (A) in median retrothyroidal location, hypoechoic, measuring 2.2cm. Left superior PA (B) in the upper retrothyroidal location, hypoechoic, measuring 2.3 cm. Predominantly cystic right inferior parathyroid adenoma (C) adjacent to lower pole of thyroid, anechoic, measuring 3.5 cm. Right inferior PA (D) in the lower retrothyroidal location, hypoechoic, measuring 2 cm. Left inferior PA (E) near the lower pole of thyroid extending to the retrosternal region, hypoechoic, measuring 2.3 cm. PA on color-doppler ultrasonography (F) with central hyperemia and afferent ‘polar’ vessel. Reproduced with permission from: Vitetta GM, Ravera A, Mensa G, Fuso L, Neri P, Carriero A, Cirillo S. Actual role of color-doppler high-resolution neck ultrasonography in primary hyperparathyroidism: a clinical review and an observational study with a comparison of 99mTc-sestamibi parathyroid scintigraphy. J Ultrasound. 2019 Sep;22(3):291-308. doi: 10.1007/s40477-018-0332-3. Epub 2018 Oct 24. PMID: 30357759; PMCID: PMC6704209.
Figure 8
Figure 8
4DCT imaging of parathyroid adenomas. Left PA [(A–D), white arrows] and Right PA [(E–H), white arrows] are visualized as arterially enhancing soft-tissue structures adjacent to the thyroid, which wash out on subsequent phases. Left PA [(I–L), white arrows] with progressive enhancement greatest on the venous phase demonstrating enhancement characteristics can be variable. Reproduced with permission: (A–D) Mahajan A, Starker LF, Ghita M, Udelsman R, Brink JA, Carling T. Parathyroid four-dimensional computed tomography: evaluation of radiation dose exposure during preoperative localization of parathyroid tumors in primary hyperparathyroidism. World J Surg. 2012 Jun;36(6):1335-9. doi: 10.1007/s00268-011-1365-3. PMID: 22146947. (E–L) Lee EK, Yun TJ, Kim JH, Lee KE, Kim SJ, Won JK, Kang KM, Choi SH, Sohn CH. Effect of tumor volume on the enhancement pattern of parathyroid adenoma on parathyroid four-dimensional CT. Neuroradiology. 2016 May;58(5):495-501. doi: 10.1007/s00234-016-1656-3. Epub 2016 Feb 5. PMID: 26847704.
Figure 9
Figure 9
4DCT imaging of parathyroid adenomas. Upper panels (A) arrow head on axial image, (B) arrow head on sagittal image, and (C) curved arrow on coronal images depict the polar vessel sign in PA (straight arrows) with arterially enhancing prominent feeding vessel. Middle panels depict a thyroid nodule (arrow) mimicking a PA on (D) non-contrast axial, (E) arterial axial, and (F) venous axial imaging. Lower panels depict ectopic PA in unusual locations near the carotid sheath (arrow and arrowhead) similar to paraganglioma (G) and in the retropharyngeal region (arrows) (G) where they could easily be confused for lymphadenopathy. Reproduced with permission from: (A–C) Bahl M, Muzaffar M, Vij G, Sosa JA, Choudhury KR, Hoang JK. Prevalence of the polar vessel sign in parathyroid adenomas on the arterial phase of 4D CT. AJNR Am J Neuroradiol. 2014 Mar;35(3):578-81. doi: 10.3174/ajnr.A3715. Epub 2013 Aug 14. PMID: 23945223; PMCID: PMC7964736. (D–H) Hoang JK, Sung WK, Bahl M, Phillips CD. How to perform parathyroid 4D CT: tips and traps for technique and interpretation. Radiology. 2014 Jan;270(1):15-24. doi: 10.1148/radiol.13122661. PMID: 24354373.
Figure 10
Figure 10
4DMRI imaging of parathyroid adenomas. (A) Axial arterial phase post contrast fat saturation T1 MRI of PA at the tracheoesophageal groove (white arrow) in a 47 yo F with primary hyperparathyroidism (PTH - 164 pg/mL, Ca2+ = 10.8). Graph depicts contrast-time curve analysis from ROI placed over the PA (solid), a lymph node (dashed), and the thyroid (dotted), showing relative faster time to peak (TTP), increased wash in and increased wash out values from the PA. (B) 4DMRI of PA posterior to the right thyroid mildly hyperintense relative to the thyroid on axial T2 fat saturation [(B1), white arrow] and separated by cleavage plane on sagittal out of phase imaging [(B2, white arrow] images with avid arterial enhancement greater than thyroid on T1 post contrast (B3) and T1 post contrast subtraction imaging (B4) and comparative coronal 99mTc-sestamibi (B5) and ultrasound imaging (B6). (C) 4DMRI of PA posterior to the right thyroid gland with marked relative T2 fat saturation hyperintensity (C1), oblong appearance without reliable cleavage plane on out of phase imaging in sagittal (C2) or axial (C3) planes, and arterial enhancement similar to the thyroid gland (C4) and associated ultrasound (C5) and early (C6) and delayed (C7) phase 99mTc-sestamibi. (D) Dynamic MRI of PA posterior to the left thyroid slightly hyperintense similar to thyroid on axial T2 (D1), with thin cleavage plane on axial out of phase (D2), with mild enhancement on early axial T1 post-contrast subtraction (D3) and similar to the thyroid gland on delayed axial T1 post-contrast subtraction (D4) and comparative ultrasound (D5) and coronal 99mTc-sestamibi (D6). (E) 4DMRI of PA posterior to the right thyroid with mixed cystic and solid components causing mass effect on the esophagus displacing it to the left on axial (E1) and oblong appearance on sagittal (E2) T2 fat saturation, with cleavage plane on axial out of phase (E3), and partial enhancement similar to the thyroid gland on T1 post-contrast fat saturation (E4). (F) Summary of MRI features of PA including T2 fat saturation hyperintensity (F1), oblong appearance (F2), cleavage plane between the thyroid and PA (F3), which can be emphasized by india ink artifact on out of phase imaging (F4), ‘marbled’ appearance (F5), fast and strong enhancement on T1 post-contrast (F6). Reproduced with permission from: (A) Nael K, Hur J, Bauer A, Khan R, Sepandari A, Inampudi R, et al. Dynamic 4D MRI for Characterization of Parathyroid Adenomas: Multiparametric Analysis. AJNR Am J Neuroradiol. 2015;36: 2147–2152. doi:10.3174/ajnr.A4425 (B–F) Sacconi B, Argirò R, Diacinti D, et al. MR appearance of parathyroid adenomas at 3 T in patients with primary hyperparathyroidism: what radiologists need to know for pre-operative localization. European Radiology. 2016 Mar;26(3):664-673. DOI: 10.1007/s00330-015-3854-5.
Figure 11
Figure 11
Intraoperative views of parathyroid glands (PG) visualized using autofluorescence (small arrows). (A) Two PG following left thyroid lobectomy. (B) Two PG following right thyroid lobectomy. (C) Two PG following superior pole dissection with medialization of left thyroid. (D) Two PG after superior pole dissection with medialization of the right thyroid. (E) Superior right PA and (F) inferior left PA with heterogeneous fluorescence pattern and enlargement (large arrow) compared to normal PG (small arrow). (G) Excised parathyroid adenoma with heterogeneous fluorescence pattern and enlargement (left) compared to normal PG (right, arrow). Reproduced with permission from: Demarchi, M. S., Karenovics, W., Bedat, B., & Triponez, F. (2020). Intraoperative Autofluorescence and Indocyanine Green Angiography for the Detection and Preservation of Parathyroid Glands. Journal of Clinical Medicine Research, 9(3). https://doi.org/10.3390/jcm9030830.
Figure 12
Figure 12
(A) 18F-FCH PET/CT whole body imaging in a patient with severe hyperparathyroidism depicting multiple brown tumors on maximum intensity projection (MIP) images (arrows), coronal CT (left) and fusion PET/CT (right) images depicting parathyroid adenoma (B1), axial (B2) and oblique (B3) CT (left) and fusion PET/CT (right) images depicting brown tumor (arrows), axial CT depicting sclerotic healed brown tumor (B4) following cure of hyperparathyroidism. (C) Comparison of acquisition protocols for 18F-FCH PET/CT showing cases where an earlier <10 min time point had higher uptake compared to a delayed >60min time point (C1, C2), cases where earlier and delayed time points where similar (C3, C4), and cases where the delayed time point had increased uptake (C5, C6). 18F-FCH, 18F-fluorocholine. Reproduced with permission from: (A, B) Zhang-Yin J, Gaujoux S, Delbot T, GauthéM, Talbot JN. 18F-Fluorocholine PET/CT Imaging of Brown Tumors in a Patient With Severe Primary Hyperparathyroidism. Clin Nucl Med. 2019 Dec;44(12):971-974. doi: 0.1097/RLU.0000000000002814. PMID: 31652163. (C) Morland D, Richard C, Godard F, Deguelte S, Delemer B. Temporal Uptake Patterns of 18F-Fluorocholine Among Hyperfunctioning Parathyroid Glands. Clin Nucl Med. 2018 Jul;43(7):504-505. doi: 10.1097/RLU.0000000000002132. PMID: 29762240.
Figure 13
Figure 13
(A) 73 yo F with multinodular goiter and 5cm dominant nodule [(A1, A2), dotted circle] with uptake on 99mTc-sestamibi (MIBI) limiting ability to localize the PA. 18F-FCH PET/MR imaging identified PA posterior to the dominant nodule (A3–A6) [(A4), black circle, (A5), white arrow]. (B) 75 yo F with left PA identified on 4DMRI [(B1–B3), white circle], with inconclusive MIBI scan (B2), and correlative increased 18F-FCH uptake within the PA on PET/MRI imaging (B5, B6) [(B5), black circle]. IDEAL, Iterative decomposition of water and fat with echo asymmetry and least-squares estimation; 18F-FCH, 18F-fluorocholine; MIBI, 99mTc-sestamibi; PA, parathyroid adenoma. Reproduced with permission from: Kluijfhout WP, Pasternak JD, Gosnell JE, Shen WT, Duh QY, Vriens MR, de Keizer B, Hope TA, Glastonbury CM, Pampaloni MH, Suh I. 18F Fluorocholine PET/MR Imaging in Patients with Primary Hyperparathyroidism and Inconclusive Conventional Imaging: A Prospective Pilot Study. Radiology. 2017 Aug;284(2):460-467. doi: 10.1148/radiol.2016160768. Epub 2017 Jan 25. PMID: 28121522.

References

    1. Rowlands BC. Hyperparathyroidism: An Early Historical Survey. Ann R Coll Surg Engl (1972) 51:81–90. - PMC - PubMed
    1. Askanazy M. Ueber Ostitis Deformans Ohne Osteoides Gewebe. Arch Pathanat Inst Tübingen (1904) 4:398–422.
    1. Schmorl G. Ueber Ostitis Deformans Ohne Osteoides Gewebe. Munch Med Wschr (1907) 54:494. doi: 10.25291/VR/1907-VLR-54 - DOI
    1. Molineus L. Über Die Multiplen Braunen Tumoren Bei Osteomalacie. Langenbecks Arch Klin Chir Ver Dtsch Z Chir (1913) 101:333.
    1. Poltauf. Zbl allg path Anat (1913) 24:959.

Publication types

MeSH terms

Substances