. 2022 Feb 25:13:811791.
doi: 10.3389/fpls.2022.811791. eCollection 2022.

Multi-Approach Analysis Reveals Pathways of Cold Tolerance Divergence in Camellia japonica

Affiliations

Multi-Approach Analysis Reveals Pathways of Cold Tolerance Divergence in Camellia japonica

MengLong Fan et al. Front Plant Sci. .

Abstract

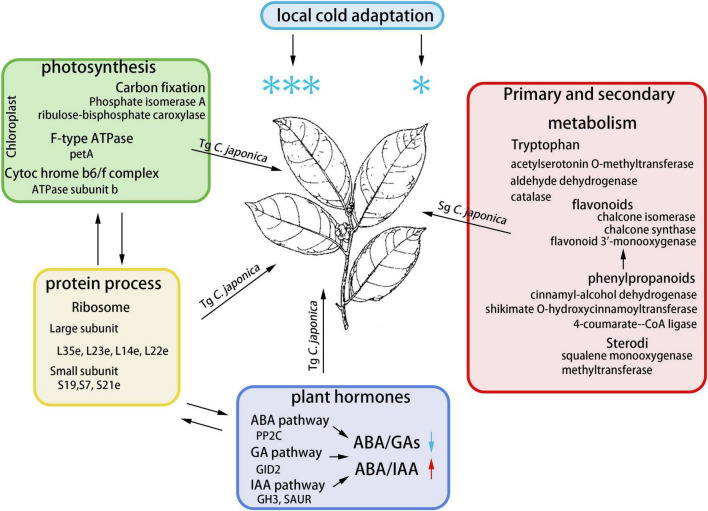
Understanding the molecular mechanism of the cold response is critical to improve horticultural plant cold tolerance. Here, we documented the physiological, transcriptome, proteome, and hormonal dynamics to cold stress in temperate genotype (Tg) and subtropical genotype (Sg) populations of Camellia japonica. Tg C. japonica suffered minimal osmotic and oxidative damage compared to Sg C. japonica under the same cold treatment. Transcriptional and translational differences increased under the cold treatment, indicating that Tg C. japonica was affected by the environment and displayed both conserved and divergent mechanisms. About 60% of the genes responding to cold had similar dynamics in the two populations, but 1,896 transcripts and 455 proteins differentially accumulated in response to the cold between Tg and Sg C. japonica. Co-expression analysis showed that the ribosomal protein and genes related to photosynthesis were upregulated in Tg C. japonica, and tryptophan, phenylpropanoid, and flavonoid metabolism were regulated differently between the two populations under cold stress. The divergence of these genes reflected a difference in cold responsiveness. In addition, the decrease in the abscisic acid (ABA)/gibberellic acid (GA) ratio regulated by biosynthetic signal transduction pathway enhanced cold resistance in Tg C. japonica, suggesting that hormones may regulate the difference in cold responsiveness. These results provide a new understanding of the molecular mechanism of cold stress and will improve cold tolerance in horticultural plants.

Keywords: Camellia japonica; co-expression; cold; plant hormone; proteome; transcriptome.


Conflict of interest statement

The authors declare that the research was conducted in the absence of any commercial or financial relationships that could be construed as a potential conflict of interest.

Figures

FIGURE 1
FIGURE 1
Divergence of cold tolerance between temperate (Tg) and subtropical (Sg) C. japonica. (A) Distributions of the two C. japonica populations. The green line represents the latitudinal difference between the Sg and Tg populations. The raw map was downloaded from Google Maps (https://www.google.com/maps) (B) phenotypic changes in leaves under the 24 h cold treatment. The dark area represents the accumulation of cold damage. (C–E) Indicate the content of relative electric conductivity, MDA, and CAT activity, respectively. (F–H) Indicate changes in the rate of relative electric conductivity, MDA, and CAT activity, respectively. Data are mean ± SD of three independent experiments, * indicates a significant difference at P < 0.05 between Tg and Sg C. japonica at a particular time by Student’s t-test. **p < 0.01, ***p < 0.001.
FIGURE 2
FIGURE 2
The transcriptome and proteome reflecting the differences between Tg and Sg C. japonica under normal conditions. (A) Number of DEGs and DEPs under the control temperature conditions. (B) The bar chart shows the significantly enriched KEGG pathways for the highly expressed DEGs and DEPs in Tg C. japonica, The abscissa represents the -log10 (p) value. (C) The bar chart shows the significantly enriched KEGG pathways for the highly expressed DEGs and DEPs in Sg C. japonica. The abscissa represents the -log10 (p) value. (D) The plot shows the significantly enriched GO terms for higher expression of DEGs and DEPs in Tg C. japonica, and the abscissa represents -log10 (p) value. (E) Plot shows the significantly enriched GO terms for the higher expression of DEGs and DEPs in Sg C. japonica. The abscissa represents -log10 (p) value.
FIGURE 3
FIGURE 3
Divergence in the response to cold between Tg and Sg C. japonica. (A) The number of DEGs and DEPs after the T1, T2, and T3 cold treatments. (B) Representation of DEGs between two camellias under the same cold treatment. Numbers in parentheses show the number of DEGs within a category. (C) Top 26 enriched KEGG pathways of these three groups.
FIGURE 4
FIGURE 4
Gene co-expression and cluster analyses using MaSigPro software. Each plot represents similarly expressed genes during the cold treatment (0, 4, 8, and 24 h). R2 > 0.6. These plots are grouped into cohorts 1, 2, and 3 according to the expression level.
FIGURE 5
FIGURE 5
Weighted gene network analysis of the response of the genes to cold. (A) Twelve modules of co-expressed genes are shown on the hierarchical cluster tree. Each branch represents a DEG. (B) Correlations of the gene expression modules, the two populations, and the 0 (CK), 4, 8, and 24 h treatments. Red and blue indicate the positive and negative correlations, respectively. The correlation coefficient and the p-value are shown within each cell. (C) Top 10 enriched GO terms of the Sg and Tg C. japonica modules within the highest correlation; bubble color indicates the -log10(p) value of the enriched GO term. (D) Top 10 enriched KEGG pathways of the Sg and Tg C. japonica modules with the highest correlation; bubble color indicates the -log10 (p) value of the enriched KEGG pathways. The pathways of concern are marked in red.
FIGURE 6
FIGURE 6
The hormone levels in the two C. japonica populations at 0, 4, 8, and 24 h of cold treatment time. (A) GA3. (B) GA4. (C) ABA. (D) IAA. (E) BR. (F) ZR. (G) ABA/GA ratio. (H) ABA/IAA ratio. Data are mean ± standard deviation (SD) (three biological replicates and three technical repeats), * symbol indicates significant difference between the two groups was determined by Student’s t-test (*P < 0.05, **P < 0.01 or ***P < 0.001).
FIGURE 7
FIGURE 7
Molecular mechanism module for the response to cold in C. japonica. We have integrated the potential pathways and genes involved in cold resistance divergence.

Similar articles

Cited by

References

    1. Ashburner M., Ball C. A., Blake J. A., Botstein D., Butler H., Cherry J. M., et al. (2000). Gene ontology: tool for the unification of biology. Nat. Genet. 25 25–29. 10.1038/75556 - DOI - PMC - PubMed
    1. Barkan A., Klipcan L., Ostersetzer O., Kawamura T., Asakura Y., Watkins K. P. (2007). The CRM domain: an RNA binding module derived from an ancient ribosome-associated protein. RNA 13 55–64. 10.1261/rna.139607 - DOI - PMC - PubMed
    1. Batista-Santos P., Lidon F. C., Fortunato A., Leitão A. E., Lopes E., Partelli F., et al. (2011). The impact of cold on photosynthesis in genotypes of Coffea spp.-Photosystem sensitivity, photoprotective mechanisms and gene expression. J. Plant Physiol. 168 792–806. 10.1016/j.jplph.2010.11.013 - DOI - PubMed
    1. Beine-Golovchuk O., Firmino A. A. P., Da ˛browska A., Schmidt S., Erban A., Walther D., et al. (2018). Plant temperature acclimation and growth rely on cytosolic ribosome biogenesis factor homologs. Plant Physiol. 176 2251–2276. 10.1104/pp.17.01448 - DOI - PMC - PubMed
    1. Charles S. A., Halliwell B. (1981). The role of calcium ions and the thioredoxin system in regulation of spinach chloroplast fructosebisphosphatase. Cell Calcium. 2 211–224. 10.1016/0143-4160(81)90037-3 - DOI