. 2022 Jan 21;13(2):950-961.
doi: 10.1364/BOE.447882. eCollection 2022 Feb 1.

Volumetric directional optical coherence tomography

Affiliations

Volumetric directional optical coherence tomography

Shuibin Ni et al. Biomed Opt Express. .

Abstract

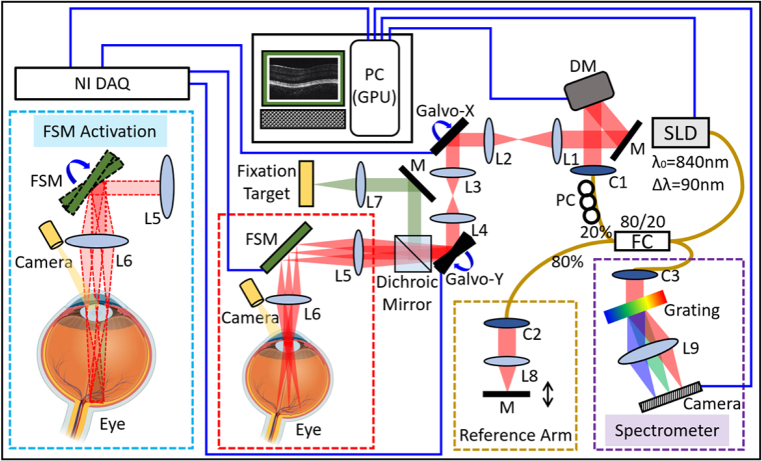
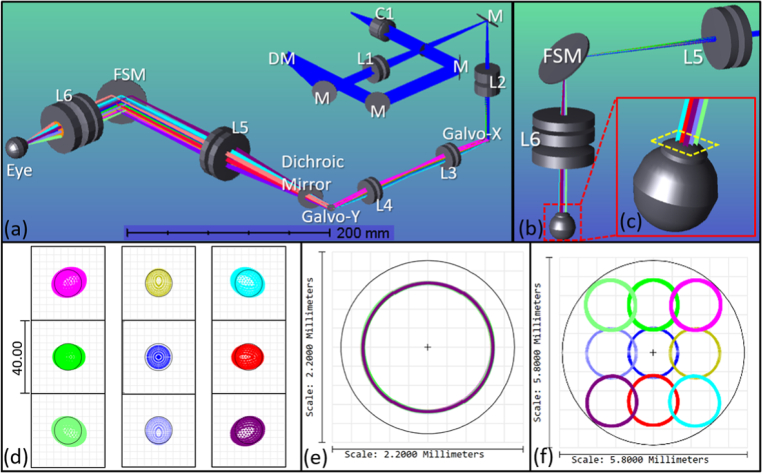
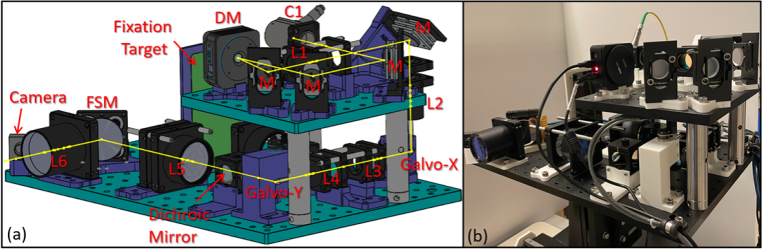
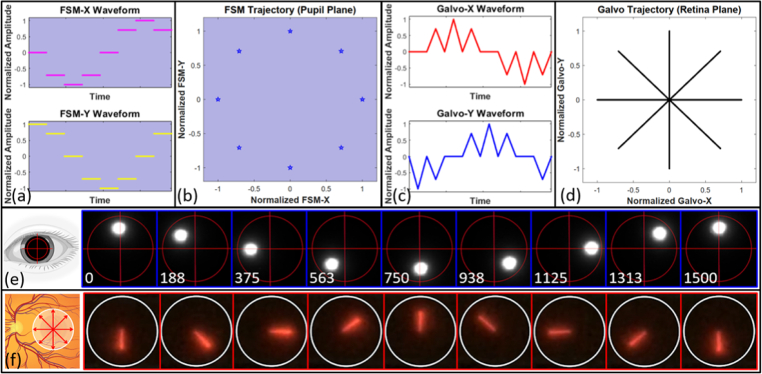
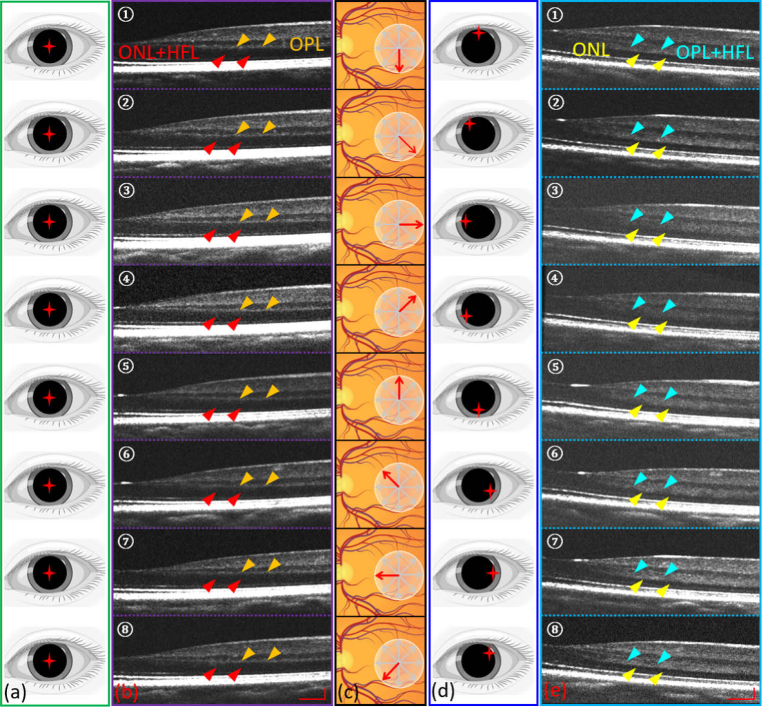
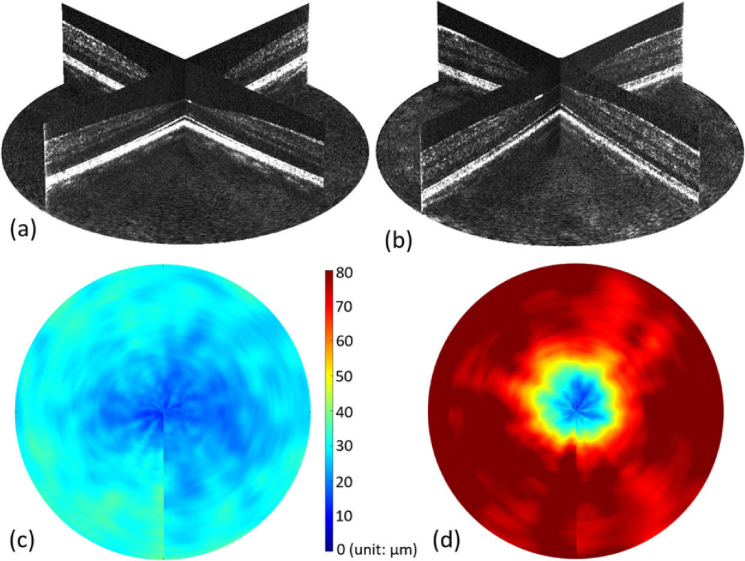
Photoreceptor loss and resultant thinning of the outer nuclear layer (ONL) is an important pathological feature of retinal degenerations and may serve as a useful imaging biomarker for age-related macular degeneration. However, the demarcation between the ONL and the adjacent Henle's fiber layer (HFL) is difficult to visualize with standard optical coherence tomography (OCT). A dedicated OCT system that can precisely control and continuously and synchronously update the imaging beam entry points during scanning has not been realized yet. In this paper, we introduce a novel imaging technology, Volumetric Directional OCT (VD-OCT), which can dynamically adjust the incident beam on the pupil without manual adjustment during a volumetric OCT scan. We also implement a customized spoke-circular scanning pattern to observe the appearance of HFL with sufficient optical contrast in continuous cross-sectional scans through the entire volume. The application of VD-OCT for retinal imaging to exploit directional reflectivity properties of tissue layers has the potential to allow for early identification of retinal diseases.


Conflict of interest statement

David Huang: Optovue Inc. (F, I, P, R). Brandon J. Lujan: Direction OCT, UC Berkeley (I). Yifan Jian: Seymour Vision (O). These potential conflicts of interest have been reviewed and managed by OHSU. Other authors declare no relevant conflicts of interest related to this article.

Figures

Fig. 1.
Fig. 1.
Schematic diagram of the VD-OCT system. The purple dashed box on the bottom right corner illustrates the spectrometer combined with a 2048-pixel camera. The dark-yellow dashed box on the bottom center shows the schematic of the reference arm. The red dashed box on the bottom center illustrates the regular OCT galvanometer scanning system. The cyan dashed box on the bottom left corner demonstrates the VD-OCT system when both the galvanometer scanner and FSM are activated synchronously. The red dot lines represent the beam envelope with different scanning angle configurations of FSM. SLD: superluminescent diode; M: mirror; DM: deformable mirror; L1-L9: lens; C1-C3: collimator; Galvo-X/Galvo-Y: the fast/slow axis of galvanometer scanner; FSM: fast steering mirror; NI DAQ: multifunctional data acquisition and control card; PC: polarization controller; FC: fiber coupler; GPU: graphics processing unit.
Fig. 2.
Fig. 2.
(a) Isometric view of the sample arm optical simulation in OpticStudio. (b). Ray trace simulation when the FSM is scanning, corresponding to the cyan dashed box in Fig. 1. (c) Zoomed-in inset of the beam trajectory in the eye model. (d). The spot diagrams with 10° FOV centered at the fovea of an eye model. The radius of Airy Disk is 7.56 µm and shown by black circle in spot diagrams. (e). Footprint diagram with different Galvo scanning angle configurations on the pupil plane. (f) Footprint diagram with different FSM scanning angle configurations on the pupil plane.
Fig. 3.
Fig. 3.
(a) 3D mechanical layout of the sample arm. (b) Photograph of the fully assembled sample arm.
Fig. 4.
Fig. 4.
(a) Drive signal waveforms of the fast and slow axis of FSM in the spoke-circular scanning pattern. (b) FSM trajectory on the pupil plane. (c) Drive signal waveforms of the fast and slow axis of Galvo in the spoke-circular scanning pattern. The waveforms for both FSM and Galvo were under-sampled along the angular axis for clarity (600 A-scans per B-scan, 2 B-scans per BM-scan, 16 B-scans per volume). (d) Galvo trajectory on the retina plane. (e) The snapshots from the video recording the imaging beam trajectory on the pupil plane. The time intervals of a period were shown in the left bottom of each snapshot (unit: ms). Red circle and crosshair were inserted into video snapshots manually to illustrate the trajectory of the imaging beam. (f) The snapshots from the video recording the entire B-scan on the retinal plane. The infrared light was visualized by the NIR detector card (VRC5, Thorlabs Inc., USA).
Fig. 5.
Fig. 5.
(a) Incident beam entry positions in the regular spoke scanning pattern. (b) Eight selected cross-sectional scans (every 45° interval in a scanning cycle) acquired by the regular spoke scanning pattern. Red arrows indicate the combined layers of ONL and HFL. Orange arrows indicate the OPL. (c) Illustration of retinal spoke scan. (d) Corresponding incident beam entry positions in the spoke-circular scanning pattern. (e) Eight selected cross-sectional scans (every 45° interval in a scanning cycle) acquired by the spoke-circular scanning pattern. Yellow arrows indicate the ONL. Cyan arrows indicate the combined layers of OPL and HFL. Scale bars in (b) and (e) are 300 µm (horizontally) and 100 µm (vertically).
Fig. 6.
Fig. 6.
(a) Selected cross-sectional scans acquired by the spoke-circular scanning pattern (“①” with red color coded), the regular spoke scanning pattern (“②” with cyan color coded), and the registration and average of the above cross-sectional scans to emphasize HFL (pointed by the green arrows in “①+②”). (b) The retinal layer thickness along various retinal eccentricities. The mean value (solid lines) and standard deviation (upper and lower bounds of the shaded areas around the solid lines) of each layer were calculated from 300 different spokes in the volume. The green line is the mean of ONL thickness [“①” in (a)] and the cyan line is the mean of OPL thickness [“②” in (a)] measured in images by the regular spoke scanning pattern. The red line is the mean of HFL [“①+②” in (a)] thickness through the registration of cross-sectional scans acquired by both scanning patterns. Scale bars in (a) are 300 µm (horizontally) and 100 µm (vertically).
Fig. 7.
Fig. 7.
(a) Screen capture of 3D volume rendering (Visualization 1) of cross-sectional scans acquired by the regular spoke scanning pattern. (b) Screen capture of 3D volume rendering (Visualization 2) of cross-sectional scans acquired by the spoke-circular scanning pattern. (c) The OPL thickness heat map centered at the fovea of the remapping volume acquired by the regular spoke scanning pattern. (d) The OPL + HFL thickness heat map centered at the fovea of the remapping volume acquired by the spoke-circular scanning pattern.

References

    1. Friedman D. S., O’Colmain B. J., Muñoz B., Tomany S. C., McCarty C., DeJong P. T. V. M., Nemesure B., Mitchell P., Kempen J., Congdon N., “Prevalence of age-related macular degeneration in the united States,” Arch. Ophthalmol. 25(4), 564–572 (1941).10.1001/archopht.1941.00870100042005 - DOI - PubMed
    1. Holz F. G., Strauss E. C., Schmitz-Valckenberg S., Van Lookeren Campagne M., “Geographic atrophy: clinical features and potential therapeutic approaches,” Ophthalmology 121(5), 1079–1091 (2014).10.1016/j.ophtha.2013.11.023 - DOI - PubMed
    1. Yehoshua Z., Rosenfeld P. J., Gregori G., Penha F., “Spectral domain optical coherence tomography imaging of dry age-related macular degeneration,” Ophthalmic Surg Lasers Imaging 41(6), 1373 (2010).10.3928/15428877-20101031-19 - DOI - PubMed
    1. Schmitz-Valckenberg S., Brinkmann C. K., Alten F., Herrmann P., Stratmann N. K., Göbel A. P., Fleckenstein M., Diller M., Jaffe G. J., Holz F. G., “Semiautomated image processing method for identification and quantification of geographic atrophy in age-related macular degeneration,” Invest. Ophthalmol. Vis. Sci. 52(10), 7640 (2011).10.1167/iovs.11-7457 - DOI - PubMed
    1. Göbel A. P., Fleckenstein M., Schmitz-Valckenberg S., Brinkmann C. K., Holz F. G., “Imaging geographic atrophy in age-related macular degeneration,” Ophthalmologica 226(4), 182–190 (2011).10.1159/000330420 - DOI - PubMed

LinkOut - more resources