. 2022 Feb 1;13(2):1102-1120.
doi: 10.1364/BOE.442087.

Versatile, do-it-yourself, low-cost spinning disk confocal microscope

Affiliations

Versatile, do-it-yourself, low-cost spinning disk confocal microscope

Aaron R Halpern et al. Biomed Opt Express. .

Abstract

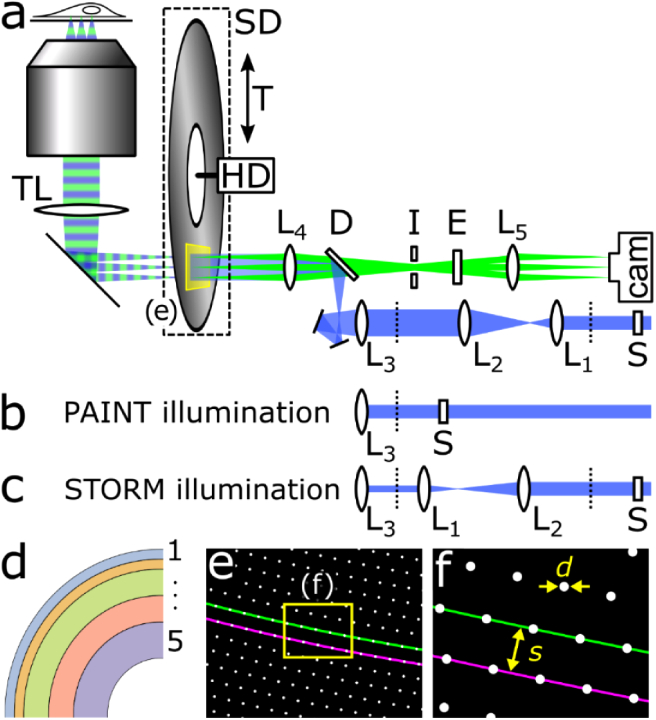
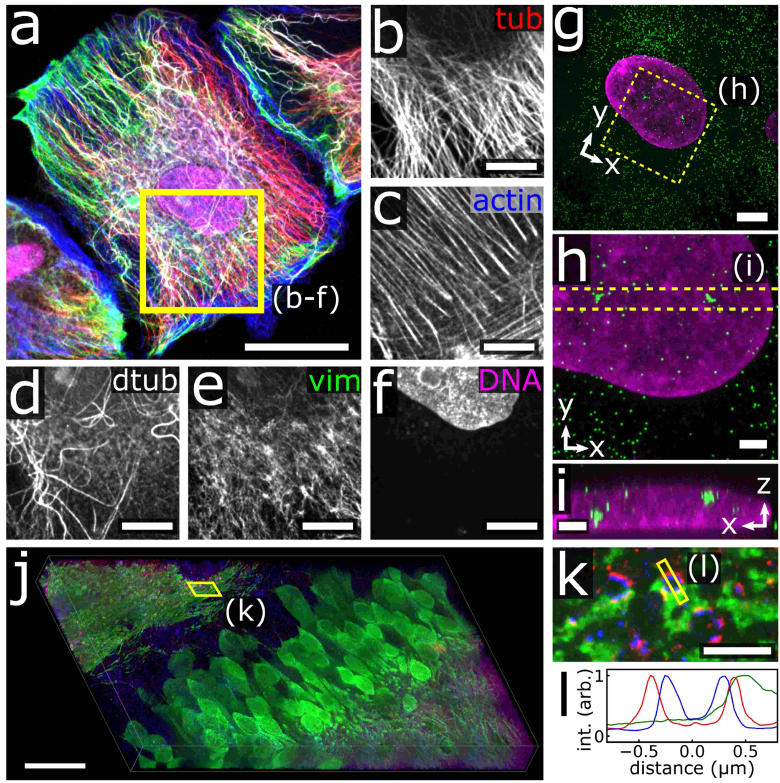
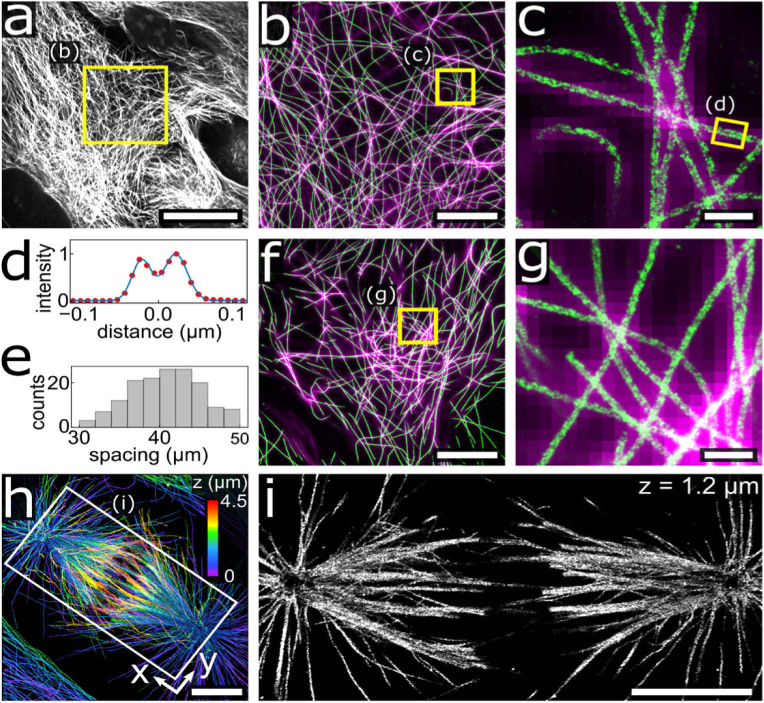
Confocal microscopy is an invaluable tool for 3D imaging of biological specimens, however, accessibility is often limited to core facilities due to the high cost of the hardware. We describe an inexpensive do-it-yourself (DIY) spinning disk confocal microscope (SDCM) module based on a commercially fabricated chromium photomask that can be added on to a laser-illuminated epifluorescence microscope. The SDCM achieves strong performance across a wide wavelength range (∼400-800 nm) as demonstrated through a series of biological imaging applications that include conventional microscopy (immunofluorescence, small-molecule stains, and fluorescence in situ hybridization) and super-resolution microscopy (single-molecule localization microscopy and expansion microscopy). This low-cost and simple DIY SDCM is well-documented and should help increase accessibility to confocal microscopy for researchers.


Conflict of interest statement

The authors declare no conflicts of interest.

Figures

Fig. 1.
Fig. 1.
Schematics of spinning disk confocal microscope, disk sectors, and pinhole array. a) Layout of the SDCM with excitation path colored in blue and emission path in green. The blue excitation beam is passed through a refractive square shaper (S) that produces a square, top-hat profile at the adjacent dashed line and is then relay-imaged to the spinning disk (SD) by lens pairs L1, L2 and L3, L4. The disk is rotated by a computer hard drive motor (HD) that is mounted on a translation stage (T) for selecting the disk sector or for bypassing the disk (epifluorescence mode). The objective lens (OL) and tube lens (TL) are housed in a commercial microscope chassis. Other listed components are the dichroic mirror (D), iris (I), emission filter (E), and camera. Alternative illumination paths for b) DNA-PAINT by repositioning S and removing L1 and L2 to achieve no magnification, and for c) SMLM by repositioning lenses L1 and L2 to achieve two-fold demagnification of the excitation beam, rather than two-fold magnification shown in a). d) Schematic of the five disk sectors used in this work. The narrow sectors 1 and 2 were designed for small area, high power density single-molecule measurements. The remaining sectors were intended for conventional imaging with 100× (3), or 60× immersion objectives (4 and 5). The parameters for each sector are listed in Table 1(e) Schematic of a selected area of the sector 3 pinhole array highlighting two neighboring Archimedean spiral paths (green and magenta). f) Zoom in view of the small area in e) with pinhole diameter d and inter-spiral spacing s for the case of s=5×d.
Fig. 2.
Fig. 2.
Simulated spinning disk illumination intensity patterns for misalignment offset. a) Schematic diagram of the misalignment offset between the Archimedean spiral origin and the actual rotational axis of the disk denoted by the cross. b) Simulated root mean square deviation (RMSD) of illumination intensity vs disk offset from the center for patterns consisting of 1-32 concentric spirals. All patterns used a constant inter-spiral spacing of 250 µm, but a pinhole arclength spacing of 2.5 µm at a radius of ∼40 mm from the spiral center, where 1 spiral completed 32 revolutions, 2 spirals completed 16 revolutions, etc. c) Simulated illumination intensity for a single spiral disk with an offset of 10 µm in a 10 µm × 4 µm area of the image plane. d) Simulated illumination intensity profiles for the single spiral disk in (c) with offsets of 0 µm (top, black), 10 µm (top, blue) and 100 µm (top, red), and for a 32-spiral disk with offset of 0 µm (bottom, black), 1100 µm (bottom, blue) and 1200 µm (bottom, red). The intensity profiles were normalized to the 0 µm offset intensity level. The simulations in (c) and (d) used pinhole diameter d = 50 µm and inter-spiral spacing s=250 µm, at a radius of ∼40 mm from the spiral center, and were simulated as viewed by a 100× lens.
Fig. 3.
Fig. 3.
Point spread function (PSF) and optical sectioning with SDCM. a) x-y view and b) x-z view of PSF measurement performed with SDCM using 100 nm fluorescent beads excited at 488 nm. Imaging was performed using a 100× 1.45 NA oil-immersion objective lens and disk sector 3 (Table 1). c-d) Lateral and axial profiles of PSF centered on the dashed yellow lines in panels a and b, respectively, with points showing measured data and lines showing the 3D Gaussian fits. e) Schematic diagram of concentrated dye assay to produce a thin fluorescent plane. The dotted black line represents the virtual image of the pinhole in the sample plane. f) Concentrated dye signal as a function of axial position using a 100× 1.45 NA oil-immersion objective lens for epifluorescence (black), SDCM with d = 50 µm and s=250 µm (blue), or SDCM with d=50 µm and s=500µm (red). g) Normalized axial profiles of the concentrated dye signal shown from panel f on a Log10 plot. Scale bars, 500 nm (a,b).
Fig. 4.
Fig. 4.
Selected biological specimens imaged with SDC microscope. (a) BS-C-1 cells stained for the cytoskeleton and DNA. The individual channels and excitation wavelength of the boxed region in a are shown in panels: (b) tyrosinated tubulin (tub, 750 nm), (c) actin (647 nm), (d) detyrosinated tubulin (dtub, 561 nm), (e) vimentin (vim, 488 nm), and (f) DNA (405 nm). (g) Maximum intensity projection of expanded RPE-1 cells stained for GAPDH mRNA (green) and DNA (magenta). (h) Zoom-in of the area highlighted in g, showing nascent mRNA clusters, and corresponding transverse projection (i) of the area highlighted in h. (j) Expanded brain immunostained for tdTomato (green), Homer (red), and Bassoon (blue) tiled and stitched using SDCM. (k) Zoomed-in view of a single plane of the boxed region in j, and corresponding line profile of a synapse in the boxed region in k. Scale bars, 30 µm (a), 10 µm (b-f), 5 µm (g), 2 µm (h,i), 25 µm (j) and 2.5 µm (k). Scale bars in expanded samples are given in pre-expansion dimensions.
Fig. 5.
Fig. 5.
Demonstration of single molecule localization microscopy using SDC microscope. (a) Single confocal z-plane of immunostained microtubules of RPE-1 cells. (b) Overlay of DNA-PAINT image (green) acquired using an SDC, and the corresponding confocal z-plane (magenta) of the highlighted region in a. (c) Zoom in of the highlighted region in b showing microtubule hollow features. (d) Cross-sectional profile (dots) and dual Gaussian fit (solid) of boxed microtubule in c, showing a 43 nm peak-to-peak separation. (e) Histogram of peak-to-peak distances for 170 microtubules from panel b. (f) STORM image of immunostained microtubules in RPE-1 cells (green) collected through SDC, and overlay of the widefield epifluorescence image (magenta). (g) Zoom in of the region in f, showing ability to resolve microtubule hollow features. (h) Maximum intensity projection of 3D STORM image of immunostained microtubules from a 4.5 µm thick dividing PTK-1 cell with z-dimension position colorized according to the color scalebar. (i) Zoom in of a 50 nm z-section from the highlighted region in h at z = 1.2 µm. Scale bars, 20 µm (a), 5 µm (b,f,h,i), 500 nm (c,g).

References

    1. Pawley J. B., ed., Handbook of Biological Confocal Microscopy , 3rd ed (Springer, 2006).
    1. Jonkman J., Brown C. M., “Any Way You Slice It—A Comparison of Confocal Microscopy Techniques,” J. Biomol. Tech. 26(2), 54–65 (2015).10.7171/jbt.15-2602-003 - DOI - PMC - PubMed
    1. Oreopoulos J., Berman R., Browne M., “Spinning-disk confocal microscopy,” in Methods Cell Biol. , 123 (Elsevier, 2014), pp. 153–175. - PubMed
    1. Wang E., Babbey C. M., Dunn K. W., “Performance comparison between the high-speed Yokogawa spinning disc confocal system and single-point scanning confocal systems,” J. Microsc. 218(2), 148–159 (2005).10.1111/j.1365-2818.2005.01473.x - DOI - PubMed
    1. Conchello J.-A., Lichtman J. W., “Optical sectioning microscopy,” Nat. Methods 2(12), 920–931 (2005).10.1038/nmeth815 - DOI - PubMed

LinkOut - more resources