. 2022 Jan 21;13(2):902-920.
doi: 10.1364/BOE.445393. eCollection 2022 Feb 1.

Optical phase modulation by natural eye movements: application to time-domain FF-OCT image retrieval

Affiliations

Optical phase modulation by natural eye movements: application to time-domain FF-OCT image retrieval

Viacheslav Mazlin et al. Biomed Opt Express. .

Abstract

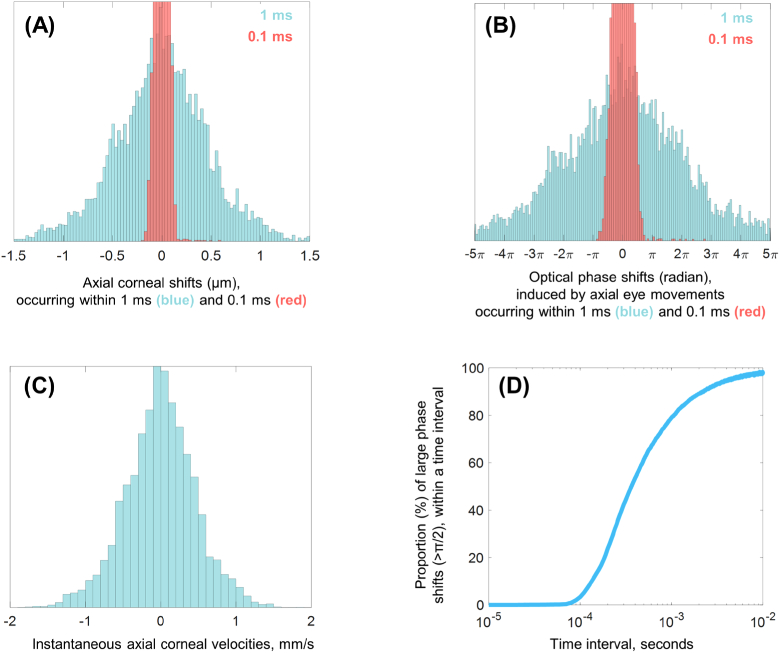
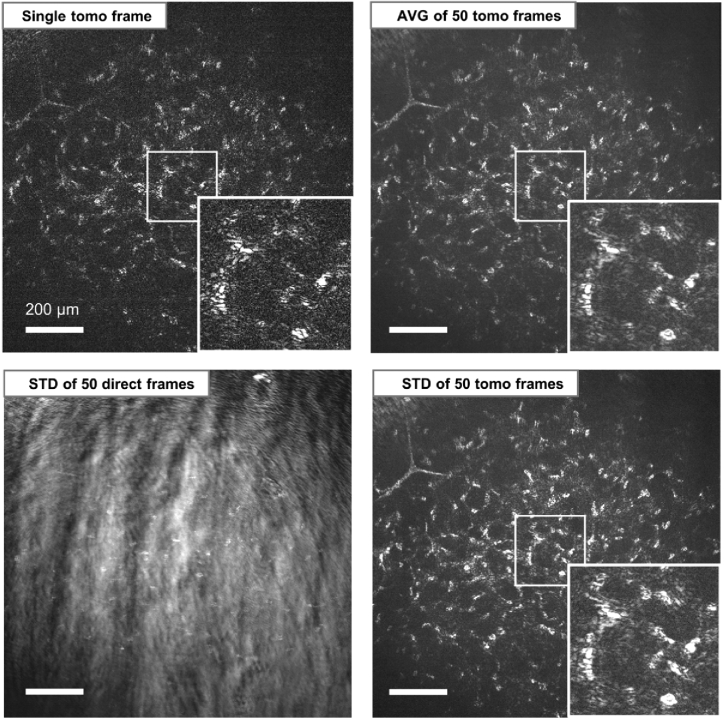
Eye movements are commonly seen as an obstacle to high-resolution ophthalmic imaging. In this context we study the natural axial movements of the in vivo human eye and show that they can be used to modulate the optical phase and retrieve tomographic images via time-domain full-field optical coherence tomography (TD-FF-OCT). This approach opens a path to a simplified ophthalmic TD-FF-OCT device, operating without the usual piezo motor-camera synchronization. The device demonstrates in vivo human corneal images under the different image retrieval schemes (2-phase and 4-phase) and different exposure times (3.5 ms, 10 ms, 20 ms). Data on eye movements, acquired with a spectral-domain OCT with axial eye tracking (180 B-scans/s), are used to study the influence of ocular motion on the probability of capturing high-signal tomographic images without phase washout. The optimal combinations of camera acquisition speed and amplitude of piezo modulation are proposed and discussed.


Conflict of interest statement

VM: (P), PX: (P), MF: (P), ACB: (P).

Figures

Fig. 1.
Fig. 1.
Detailed (A) and schematic (B) illustrations of SD-OCT, used to measure the axial eye movements. BS: beamsplitter. MO: microscope objective. Spectrometer is not shown. Interferometer is mounted on XYZ translation stages, useful for aligning with respect to the eye.
Fig. 2.
Fig. 2.
Detailed (A) and schematic (B) illustrations of TD-FF-OCT, used to image the in vivo human cornea. BS: 50:50 beamsplitter. MO: microscope objectives. The interferometer is mounted on XYZ translation stages, useful for aligning with respect to the eye. The piezo motor in the reference arm, that holds the mirror, may be disabled, leaving the axial movements of the eye to be responsible for optical phase modulation.
Fig. 3.
Fig. 3.
(A) Axial movements of in vivo human cornea, measured with SD-OCT. The source data underlying the plot are provided in Dataset 1, Ref. [34]. The long period of recording enables exploration of wide diversity of eye movements. Red square (zoomed image) highlights the linearity of eye movements on a ms time scale. The entire plot can be divided into the imaginary time windows (e.g. 1 ms, 3.5 ms, 10 ms etc.), shown in green. (B) Fourier transform of the main plot (A). Peaks corresponding to breathing at 0.34 Hz and heartbeat at 1 Hz, 2 Hz, 3 Hz are visible in agreement with the literature [1].
Fig. 4.
Fig. 4.
(A) Distributions of axial corneal position shifts during different time intervals. Data is obtained from Fig. 3(A), divided into imaginary time frames. (B) Distribution of optical phase shifts calculated from (A), assuming an 850 nm light wavelength. (C) Distribution of instantaneous axial corneal velocities. (D) Proportion of a large phase shift (> π/2) among all shifts happening during different time intervals. The graph is calculated from (B). It should be noted that large phase shifts (> 2π) also can produce a high tomographic signal, but for some OCT methods this may require additional phase unwrapping.
Fig. 5.
Fig. 5.
Distribution of possible TD-FF-OCT signals (normalized) under different sources of phase modulation. The histograms are calculated from Eq. (2) considering the experimental data in Fig. 3, 3.5 ms exposure time (2 camera frames, each frame 1.75 ms) and 850 nm light wavelength. The signal is the highest (equal to 1), when only the piezo motor contributes to phase modulation in the absence of eye movement. In case of phase modulation with axial eye movements, the tomographic signal can take only values below 0.7. As discussed below, this results from integration of continuous function of time (phase change with eye movements is a continuous function of time). The addition of discontinuity, such as made with a fast step modulation with a piezo motor, can create tomographic signals of any value. 20% denotes the arbitrary selected threshold of ‘sufficient’ tomographic signal that is used for calculating signal statistics.
Fig. 6.
Fig. 6.
Values that tomographic signal can take in the cases of modulation with eye movements and piezo motor or with eye movements only.
Fig. 7.
Fig. 7.
(A) Proportion of tomographic images in presence of eye movements depending on the exposure time and additional piezo phase shift. By tomographic images we mean images with tomographic signal above 20% (arbitrarily selected). Here the exposure time is the period required to capture a single tomographic image (reconstructed from the two camera frames). The 2D surface plot is calculated from Eq. (2) with experimental data from Fig. 3(A). (B) Normalized average signal level of tomographic images depending on the exposure time and additional phase shift. (C) Extracted slices from (A). (D) Extracted slices from (B). Color scale is similar for (A) and (B).
Fig. 8.
Fig. 8.
Comparison of TD-FF-OCT images of human corneal stroma in vivo with and without piezo modulation at different exposure times. Stromal keratocytes are resolved. Exposure time here is the period required to capture two camera frames (single tomographic image). At long exposure time of 20 ms images contain artefacts related to the defocused view of the corneal surface. All scale bars are 200 µm.
Fig. 9.
Fig. 9.
(A), (B) Comparison of axial movements of in vivo human cornea from two healthy subjects. The source data underlying the plots are provided in Dataset 1, Ref. [34]. (C), (D) Comparison of proportions of tomographic images depending on the exposure time and additional piezo phase shift for two healthy subjects. Color scale is similar for (A) and (B).
Fig. 10.
Fig. 10.
Distribution of normalized tomographic signal level under different image averaging schemes. The histograms are calculated from Eq. (2) considering the experimental data in Fig. 3, while assuming a 3.5 ms exposure time, 850 nm light wavelength and no piezo modulation. Averaging (AVG) or taking the standard deviation (STD) reduces the proportion of images with minimal (0%) and maximal (100%) signal, while increasing the proportion of mediocre signals.
Fig. 11.
Fig. 11.
Comparison of TD-FF-OCT images from in vivo human corneal stroma reconstructed from multiple frames via averaging or standard deviation. All scale bars are 200 µm.
Fig. 12.
Fig. 12.
Comparison of two- and four-phase modulation schemes. In vivo corneal images were acquired without piezo motor. The total exposure times were 3.5 ms for 2 phase and 7 ms for 4 phase images. Target images were acquired using the piezo modulation. The four-phase scheme suppresses the fringe artifacts that are typically present in uniform layers, such as the endothelium. All scale bars are 200 µm.
Fig. 13.
Fig. 13.
Sources of lateral motion and their effects on TD-FF-OCT signal. On the millisecond timescale saccades, produce small axial and large lateral shifts. The large lateral shifts create the incoherent artefacts, more precisely the defocused view of the corneal surface (yellow arrows), and reduce the tomographic signal. Both images on the right were acquired from the same plane in human cornea in vivo. Tear flow produces similar surface artefacts during one second following the blink, while the tear velocity is high.
Fig. 14.
Fig. 14.
Blood flow and TD-FF-OCT. Blood flow creates fluctuations in brightness from one image to the next one in a sequence. As a result it is visible even if the vessel lies outside of the coherence plane (or equivalently, when the reference arm is blocked). TD-FF-OCT reveals all the vessels within the depth-of-focus (DOF).

References

    1. de Kinkelder R., Kalkman J., Faber D. J., Schraa O., Kok P. H. B., Verbraak F. D., van Leeuwen T. G., “Heartbeat-induced axial motion artifacts in optical coherence tomography measurements of the retina,” Invest. Ophthalmol. Vis. Sci. 52(6), 3908 (2011).10.1167/iovs.10-6738 - DOI - PubMed
    1. Hedley M., Yan H., “Motion artifact suppression: a review of post-processing techniques,” Magn. Reson. Imaging 10(4), 627–635 (1992).10.1016/0730-725X(92)90014-Q - DOI - PubMed
    1. Huang D., Swanson E., Lin C., Schuman J., Stinson W., Chang W., Hee M., Flotte T., Gregory K., Puliafito C., et al. , “Optical coherence tomography,” Science 254(5035), 1178–1181 (1991).10.1126/science.1957169 - DOI - PMC - PubMed
    1. Drexler Wolfgang, Fujimoto James G., Optical Coherence Tomography: Technology and Applications , 2 (Springer International Publishing, 2015).
    1. Yun S. H., Tearney G. J., de Boer J. F., Bouma B. E., “Motion artifacts in optical coherence tomography with frequency-domain ranging,” Opt. Express 12(13), 2977 (2004).10.1364/OPEX.12.002977 - DOI - PMC - PubMed

LinkOut - more resources