

Integrin α6-Targeted Molecular Imaging of Central Nervous System Leukemia in Mice
- PMID: 35284414
- PMCID: PMC8905628
- DOI: 10.3389/fbioe.2022.812277
Integrin α6-Targeted Molecular Imaging of Central Nervous System Leukemia in Mice
Abstract
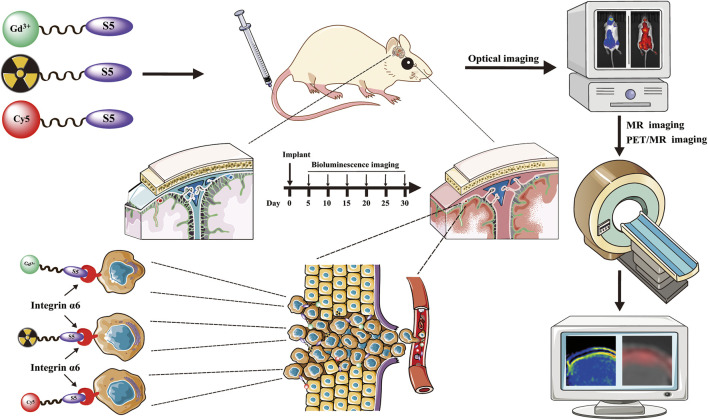
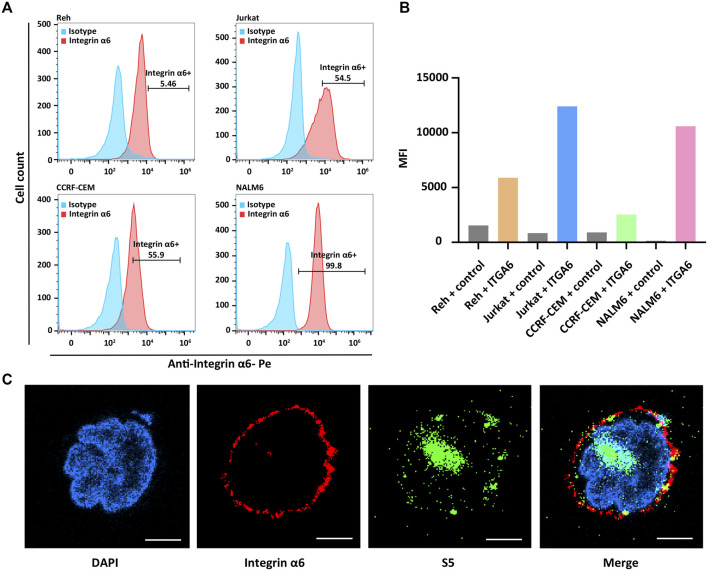
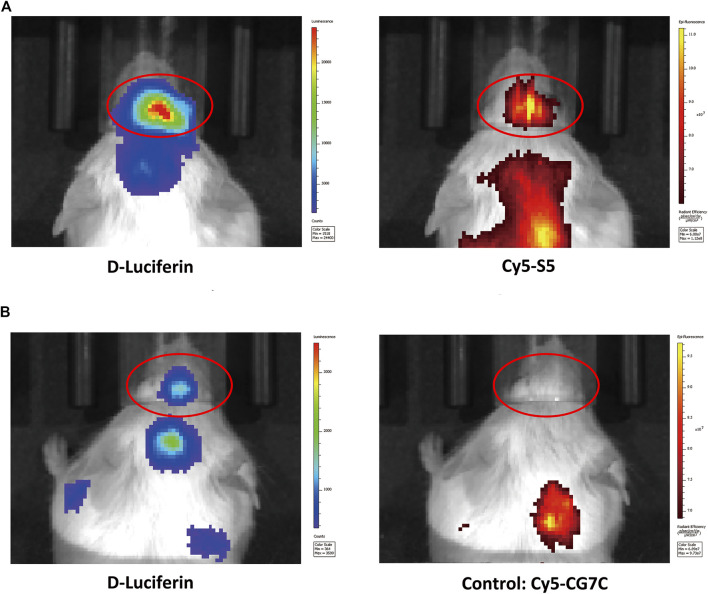
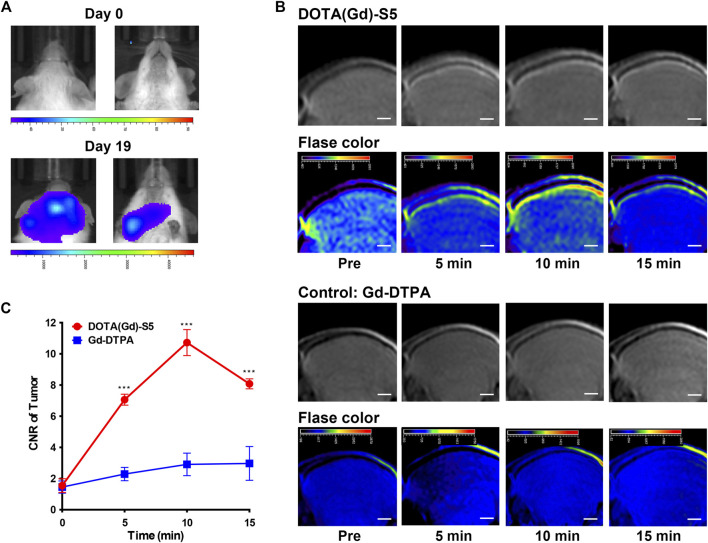
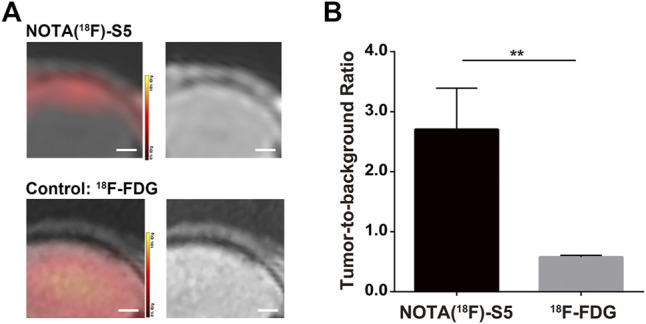
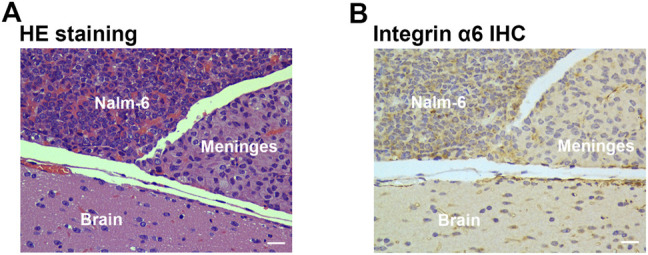
Central nervous system leukemia (CNS-L) is caused by leukemic cells infiltrating into the meninges or brain parenchyma and remains the main reason for disease relapse. Currently, it is hard to detect CNS-L accurately by clinically available imaging models due to the relatively low amount of tumor cells, confined blood supply, and the inferior glucose metabolism intensity. Recently, integrin α6-laminin interactions have been identified to mediate CNS-L, which suggests that integrin α6 may be a promising molecular imaging target for the detection of CNS-L. The acute lymphoblastic leukemia (ALL) cell line NALM6 stabled and transfected with luciferase was used to establish the CNS-L mouse model. CNS-L-bearing mice were monitored and confirmed by bioluminescence imaging. Three of our previously developed integrin α6-targeted peptide-based molecular imaging agents, Cy5-S5 for near-infrared fluorescence (NIRF), Gd-S5 for magnetic resonance (MR), and 18F-S5 for positron emission tomography (PET) imaging, were employed for the molecular imaging of these CNS-L-bearing mice. Bioluminescence imaging showed a local intensive signal in the heads among CNS-L-bearing mice; meanwhile, Cy5-S5/NIRF imaging produced intensive fluorescence intensity in the same head regions. Moreover, Gd-S5/MR imaging generated superior MR signal enhancement at the site of meninges, which were located between the skull bone and brain parenchyma. Comparatively, MR imaging with the clinically available MR enhancer Gd-DTPA did not produce the distinguishable MR signal in the same head regions. Additionally, 18F-S5/PET imaging also generated focal radio-concentration at the same head regions, which generated nearly 5-times tumor-to-background ratio compared to the clinically available PET radiotracer 18F-FDG. Finally, pathological examination identified layer-displayed leukemic cells in the superficial part of the brain parenchyma tissue, and immunohistochemical staining confirmed the overexpression of the integrin α6 within the lesion. These findings suggest the potential application of these integrin α6-targeted molecular imaging agents for the accurate detection of CNS-L.
Keywords: central nervous system leukemia; integrin α6; leukemia; molecular imaging; positron emission tomography.
Copyright © 2022 Zhang, Li, Chen, Yang, Hu, Zhang, Feng and Wang.
Conflict of interest statement
The authors declare that the research was conducted in the absence of any commercial or financial relationships that could be construed as a potential conflict of interest.
Figures
Similar articles
-
Integrin α6 targeted positron emission tomography imaging of hepatocellular carcinoma in mouse models.J Control Release. 2019 Sep 28;310:11-21. doi: 10.1016/j.jconrel.2019.08.003. Epub 2019 Aug 7. J Control Release. 2019. PMID: 31400382
-
An Optimized Integrin α6-Targeted Magnetic Resonance Probe for Molecular Imaging of Hepatocellular Carcinoma in Mice.J Hepatocell Carcinoma. 2021 Jun 24;8:645-656. doi: 10.2147/JHC.S312921. eCollection 2021. J Hepatocell Carcinoma. 2021. PMID: 34235103 Free PMC article.
-
Integrin α6-Targeted Positron Emission Tomography Imaging of Colorectal Cancer.ACS Omega. 2019 Sep 11;4(13):15560-15566. doi: 10.1021/acsomega.9b01920. eCollection 2019 Sep 24. ACS Omega. 2019. PMID: 31572857 Free PMC article.
-
Metabolic Reprogramming and Cell Adhesion in Acute Leukemia Adaptation to the CNS Niche.Front Cell Dev Biol. 2021 Dec 10;9:767510. doi: 10.3389/fcell.2021.767510. eCollection 2021. Front Cell Dev Biol. 2021. PMID: 34957100 Free PMC article. Review.
-
Skull bone marrow channels as immune gateways to the central nervous system.Nat Neurosci. 2023 Dec;26(12):2052-2062. doi: 10.1038/s41593-023-01487-1. Epub 2023 Nov 23. Nat Neurosci. 2023. PMID: 37996526 Free PMC article. Review.
Cited by
-
Promising therapeutic efficacy and safety of a novel integrin α6-targeting peptide-drug conjugate in lung adenocarcinoma.Mol Cancer. 2025 Jul 5;24(1):190. doi: 10.1186/s12943-025-02395-7. Mol Cancer. 2025. PMID: 40616126 Free PMC article.
-
Regulation and Functions of α6-Integrin (CD49f) in Cancer Biology.Cancers (Basel). 2023 Jul 2;15(13):3466. doi: 10.3390/cancers15133466. Cancers (Basel). 2023. PMID: 37444576 Free PMC article. Review.
References
-
- Blase L., Merling A., Engelmann S., Möller P., Schwartz-Albiez R. (1996). Characterization of Cell Surface-Expressed Proteochondroitin Sulfate of Pre-B Nalm-6 Cells and its Possible Role in Laminin Adhesion. Leukemia 10, 1000–1011. - PubMed
-
- Brooks D. L. P., Schwab L. P., Krutilina R., Parke D. N., Sethuraman A., Hoogewijs D., et al. (2016). ITGA6 Is Directly Regulated by Hypoxia-Inducible Factors and Enriches for Cancer Stem Cell Activity and Invasion in Metastatic Breast Cancer Models. Mol. Cancer 15, 26. 10.1186/s12943-016-0510-x - DOI - PMC - PubMed
LinkOut - more resources
Full Text Sources