. 2022 Feb;10(3):133.
doi: 10.21037/atm-22-118.

Non-targeted metabonomic analysis of plasma in patients with atherosclerosis by liquid chromatography-mass spectrometry

Affiliations

Non-targeted metabonomic analysis of plasma in patients with atherosclerosis by liquid chromatography-mass spectrometry

Xianru Xia et al. Ann Transl Med. 2022 Feb.

Abstract

Background: This study sought to analyze non-targeted plasma metabolites in patients with atherosclerosis (AS).

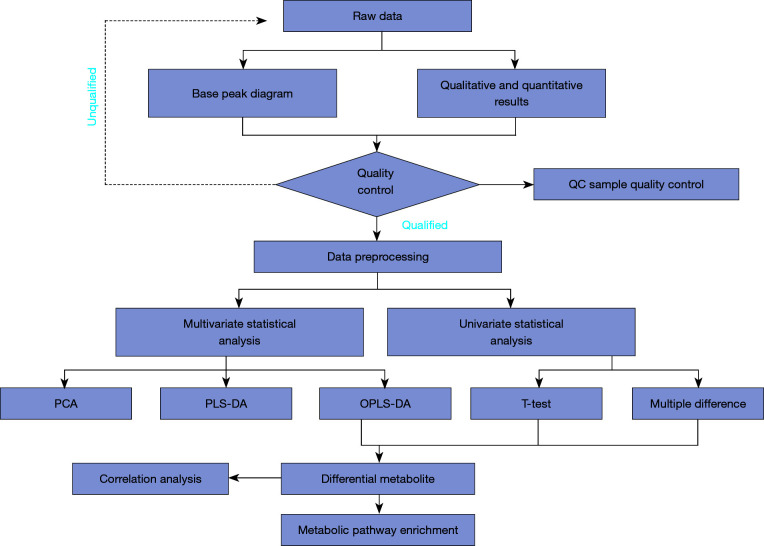
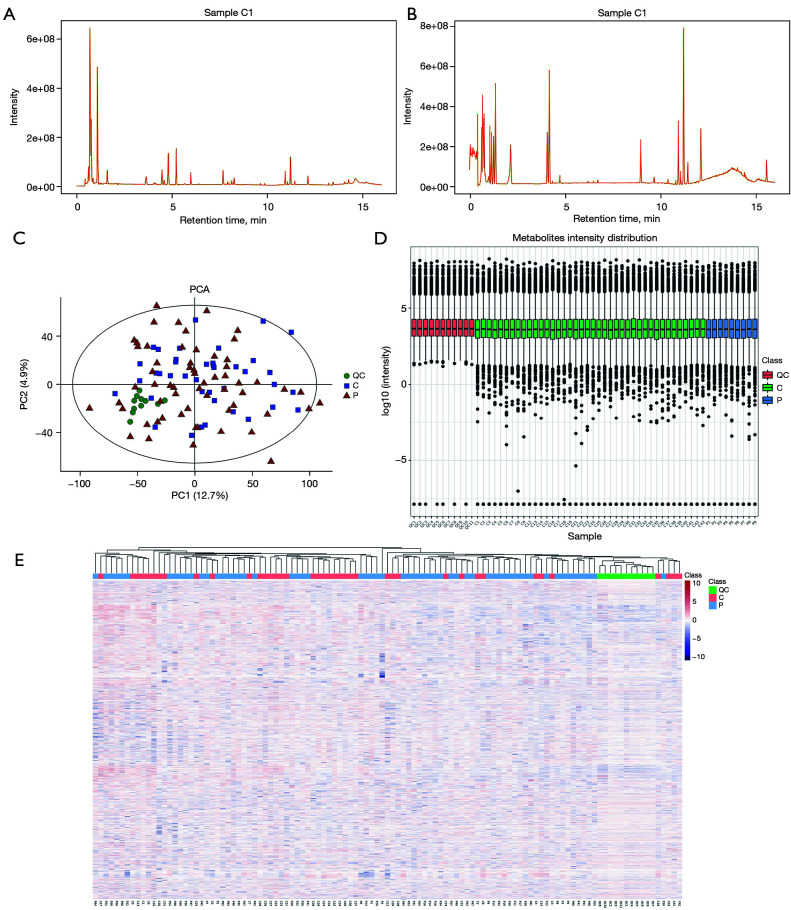
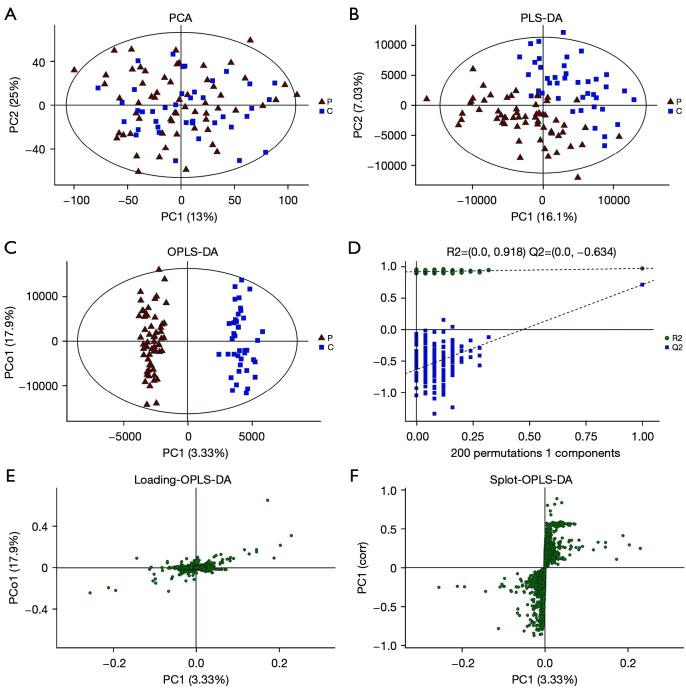
Methods: The plasma of patients with AS (the patient group) and the plasma of age-matched and gender-matched healthy individuals (the control group) at the Taihe Hospital was collected. One hundred patients were included in the study (60 in the patient group and 40 in the control group). Fasting venous plasma was collected in the morning. The metabolites in the plasma were examined by liquid chromatography-mass spectrometry (LC-MS). An unsupervised principal component analysis (PCA) was conducted to observe the overall distribution of each sample and the stability of the analysis process. Next, a supervised partial least squares-discriminant analysis (PLS-DA) and an orthogonal partial least squares-discriminant analysis (OPLS-DA) were conducted to examine the overall differences among the metabolic profiles of the groups and identify different metabolites in the groups. Pathway enrichment was analyzed using the Kyoto Encyclopedia of Genes and Genomes (KEGG) database.

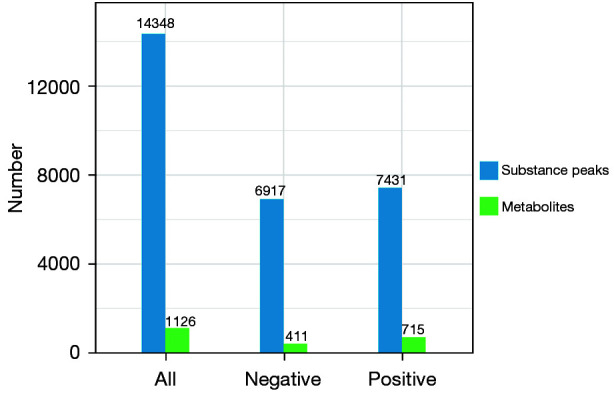
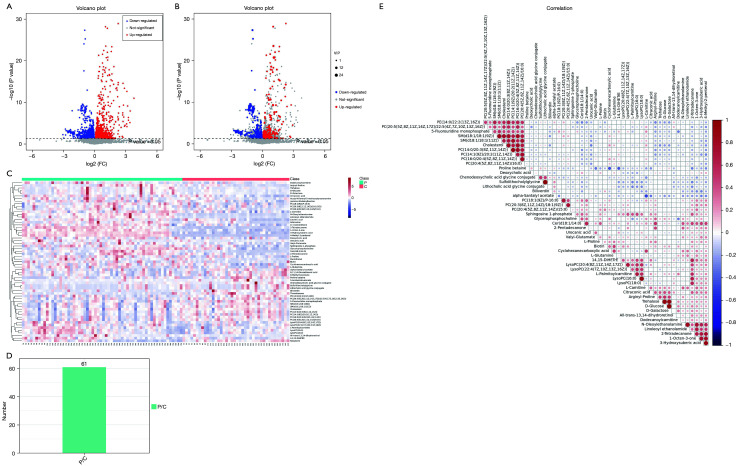
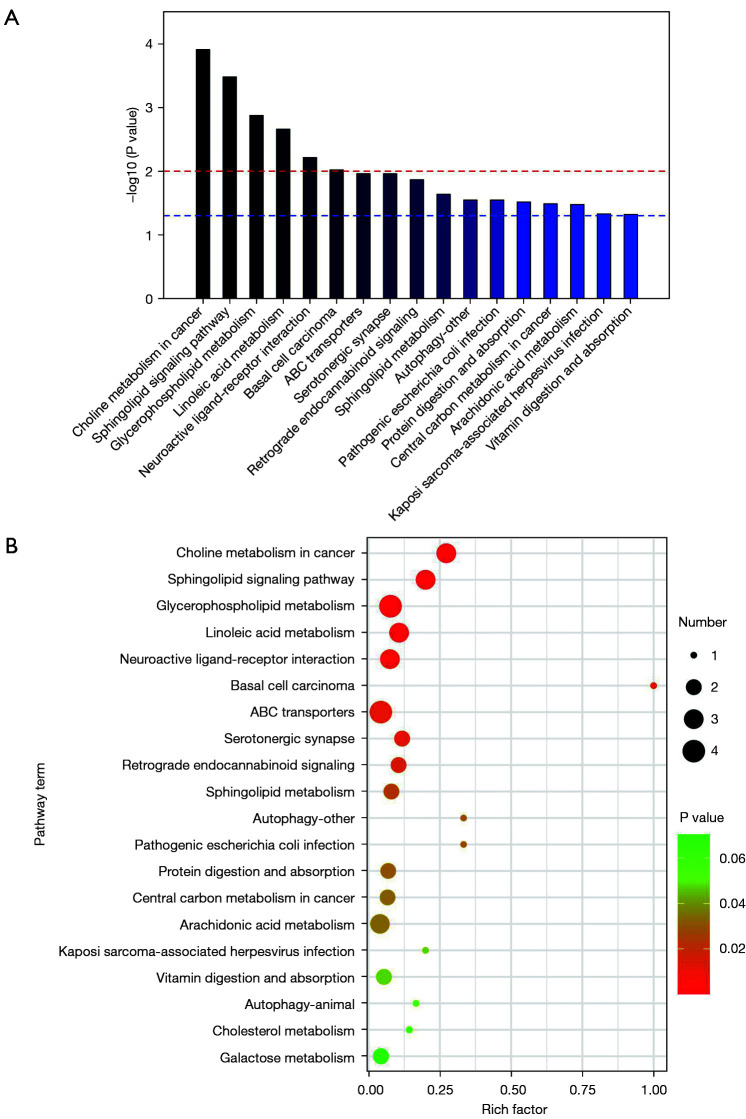
Results: In total, 1,126 different metabolites were detected in the patient and control groups. Compared to the control group, 411 species decreased, and 715 species increased in the patient group. There were 61 different metabolites with a variable weight in the projection (VIP) >1 and a P<0.05. There were 34 types of lipid metabolites, 10 types of carbon and oxygen compounds, 8 types of organic acids and derivatives, 4 types of organoheterocyclic compounds, 3 types of nitrogen-containing organic compounds, and 2 types of nucleotides and analogs. Compared to the control group, 47 species decreased, and 14 species increased in the patient group. The following 9 metabolites had the most significant differences (|log2fold change| >1; P<0.05): 2-tetradecanone, pantothenol, all-trans-13,14-dihydroretinol, linoleoyl ethanolamide, N-oleoylethanolamine, 4-methyl-2-pentenal, Cer (d18:1/14:0), chenodeoxycholic acid glycine conjugate, and 5-acetamidovalerate. The enrichment analysis results of the 61 different metabolite pathways identified 17 metabolic pathways with significant differences (P<0.05), including the choline metabolism, lipid metabolism, autophagy, amino acid metabolism, vitamin digestion, and absorption pathways.

Conclusions: There are significant differences in non-targeted plasma metabolites between patients with AS and healthy individuals. The above-mentioned 9 most significantly different metabolites may be potential markers of AS.

Keywords: Atherosclerosis (AS); difference metabolite; liquid chromatography-mass spectrometry (LC-MS) metabonomics; metabolic pathway.


Conflict of interest statement

Conflicts of Interest: All authors have completed the ICMJE uniform disclosure form (available at https://atm.amegroups.com/article/view/10.21037/atm-22-118/coif). The authors have no conflicts of interest to declare.

Figures

Figure 1
Figure 1
Flow chart of data analysis. QC, quality control; PCA, principal component analysis; PLS-DA, partial least squares-discriminant analysis; OPLS-DA, orthogonal partial least squares-discriminant analysis.
Figure 2
Figure 2
The QC results show that the detection is stable and reliable. (A) The BPC of the positive ion mode of QC1. (B) The BPC in negative ion mode of QC1. (C) PCA score chart of all samples. (D) The Y coordinates of the two-dimensional sample metabolite intensity box is the log10 value of mass spectrum intensity. (E) The abscissa of the cluster heat map of all the samples shows the sample name, and the ordinate shows the secondary classification information of the substance. The color gradient from blue to red indicates the abundance of metabolites from low to high (i.e., the redder the color, the higher the abundance of differential metabolites). QC, quality control; BPC, Base Peak Chromatogram; PCA, principal component analysis; PC, principal component; P, patient group samples; C, control group samples.
Figure 3
Figure 3
Statistical chart of substance peaks and metabolites.
Figure 4
Figure 4
There are significant differences in plasma metabolomics between the patient group and the control group. (A) The ellipse area of the PCA in the patient group and the control group represents the 95% confidence interval. (B) PLS-DA diagram of the patient group and the control group. (C) OPLS-DA diagram of the patient group and the control group. (D) Permutation diagram of the patient group and the control group. (E) Loading diagram of the patient group and the control group. (F) Splot plot of the patient group and the control group. PCA, principal component analysis; PLS-DA, partial least squares-discriminant analysis; OPLS-DA, orthogonal partial least squares-discriminant analysis; PC, principal component; P, patient group samples; C, control group samples.
Figure 5
Figure 5
Screening of differential metabolites between the patient group and the control group. (A) Map of different metabolites in the P-C group before screening. (B) Volcano map of VIP and P screenings. (C) Thermogram of different metabolites in the P-C group. (D) Statistical chart of P-C group differences in the number of metabolites. (E) Correlation analysis of the top 50 metabolites. P, patient group samples; C, control group samples; VIP, variable weight in the projection; FC, fold change.
Figure 6
Figure 6
Enrichment of differential metabolite metabolic pathways. (A) Top 20 metabolic pathway enrichment map. The P value in a metabolic pathway indicates the significance of the metabolic pathway enrichment. The P value indicated by the red line is 0.01, and that indicated by the blue line is 0.05. When the top of the column was higher than that of the blue line, the signal pathway represented by the red line was significant. (B) Top 20 bubble chart. The P value of metabolic pathway indicates the significance of enrichment. The ordinate is the name of the metabolic pathway. The abscissa is the enrichment factor (rich factor = the number of significant difference metabolites/the total number of metabolites in the pathway). The larger the rich factor, the greater the enrichment degree. The color from green to red indicates that the P value decreases in turn. The larger the dot, the more metabolites enriched on the pathway.

References

    1. Shaito A, Thuan DTB, Phu HT, et al. Herbal Medicine for Cardiovascular Diseases: Efficacy, Mechanisms, and Safety. Front Pharmacol 2020;11:422. 10.3389/fphar.2020.00422 - DOI - PMC - PubMed
    1. Schenck-Gustafsson K. Risk factors for cardiovascular disease in women. Maturitas 2009;63:186-90. 10.1016/j.maturitas.2009.02.014 - DOI - PubMed
    1. Emamat H, Totmaj AS, Tangestani H, et al. The effect of egg and its derivatives on vascular function: A systematic review of interventional studies. Clin Nutr ESPEN 2020;39:15-21. 10.1016/j.clnesp.2020.06.016 - DOI - PubMed
    1. Skuratovskaia D, Vulf M, Komar A, et al. Promising Directions in Atherosclerosis Treatment Based on Epigenetic Regulation Using MicroRNAs and Long Noncoding RNAs. Biomolecules 2019;9:226. 10.3390/biom9060226 - DOI - PMC - PubMed
    1. McLaren JE, Michael DR, Ashlin TG, et al. Cytokines, macrophage lipid metabolism and foam cells: implications for cardiovascular disease therapy. Prog Lipid Res 2011;50:331-47. 10.1016/j.plipres.2011.04.002 - DOI - PubMed