. 2022 Feb 15:24:380-393.
doi: 10.1016/j.omtm.2022.02.004. eCollection 2022 Mar 10.

Clinically relevant T cell expansion media activate distinct metabolic programs uncoupled from cellular function

Affiliations

Clinically relevant T cell expansion media activate distinct metabolic programs uncoupled from cellular function

Sarah MacPherson et al. Mol Ther Methods Clin Dev. .

Abstract

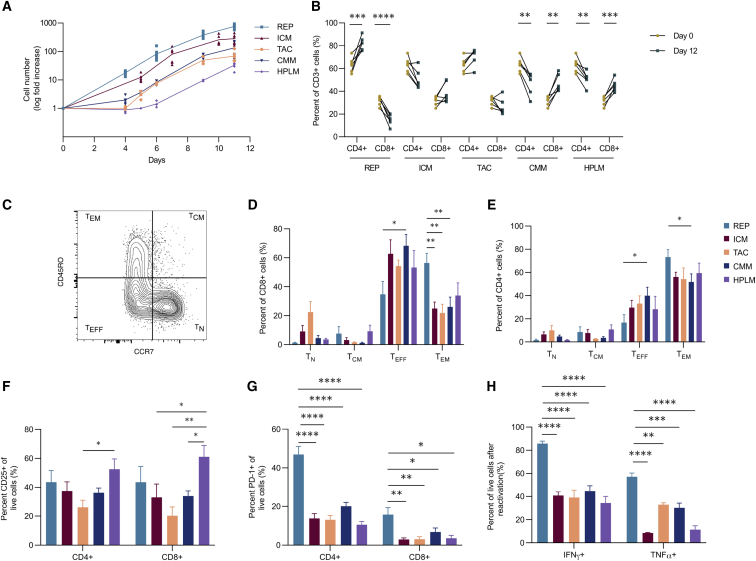
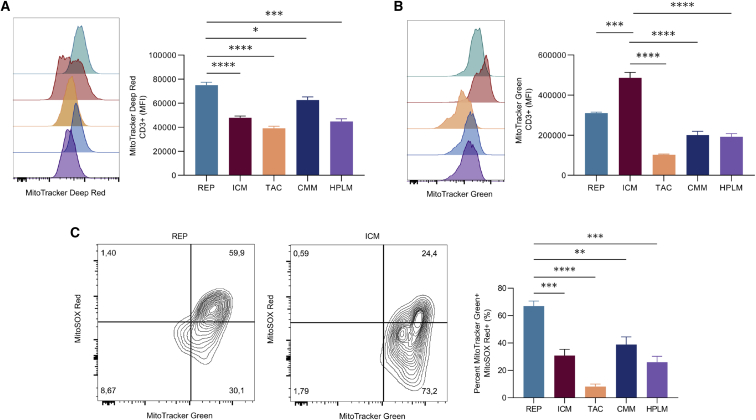
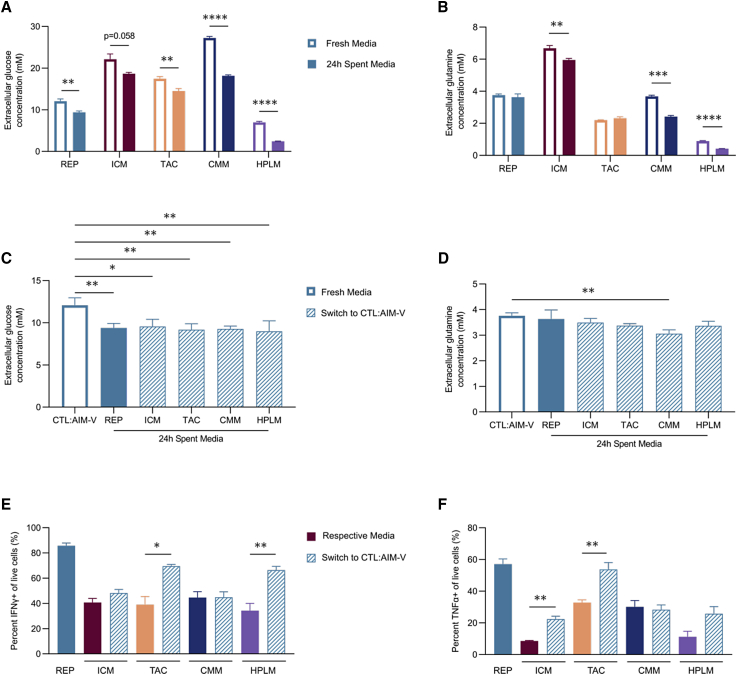
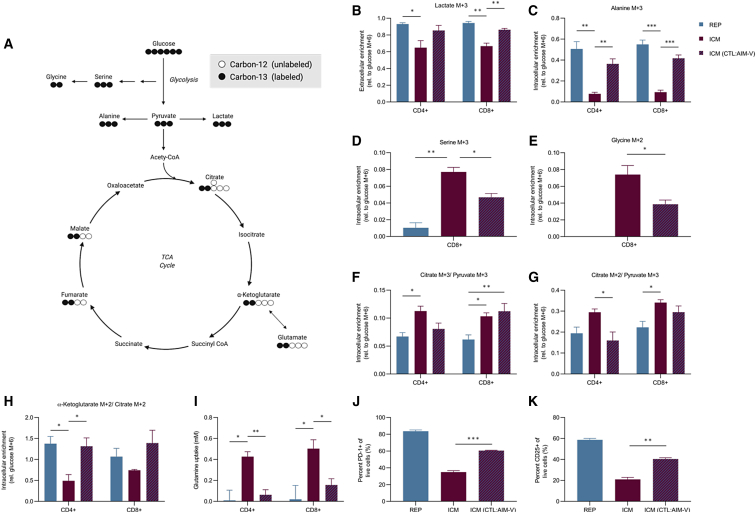
Ex vivo expansion conditions used to generate T cells for immunotherapy are thought to adopt metabolic phenotypes that impede therapeutic efficacy in vivo. The comparison of five different culture media used for clinical T cell expansion revealed unique optima based on different output variables, including proliferation, differentiation, function, activation, and mitochondrial phenotypes. The extent of proliferation and function depended on the culture media rather than stimulation conditions. Moreover, the expanded T cell end products adapted their metabolism when switched to a different media formulation, as shown by glucose and glutamine uptake and patterns of glucose isotope labeling. However, adoption of these metabolic phenotypes was uncoupled to T cell function. Expanded T cell products cultured in ascites from ovarian cancer patients displayed suppressed mitochondrial activity and function irrespective of the ex vivo expansion media. Thus, ex vivo T cell expansion media have profound impacts on metabolism and function.

Keywords: 13C tracer analysis; T cell expansion; cell-based immunotherapy; culture media; metabolism; phenotype.


Conflict of interest statement

R.J.D. is a member of the Scientific Advisory Boards of Vida Ventures and Agios Pharmaceuticals and is a founder of Atavistik Biosciences. J.R.C. is an inventor on a patent application for HPLM (PCT/US2017/061,377) assigned to the Whitehead Institute. C.S. is a Principal Scientist at STEMCELL Technologies. J.Y. is a Scientist at STEMCELL Technologies. STEMCELL Technologies provided reagents in kind for the study but were not involved in funding the study, performing experiments, or analyzing the data.

Figures

None
Graphical abstract
Figure 1
Figure 1
Expansion conditions skew proliferation, differentiation, and activation (A–G) T cells from six healthy donors were expanded in five different conditions for 12 days: CTL:AIM-V (REP), ImmunoCult-XF (ICM), TexMACS (TAC), Complete Corning media (CMM), and Human Plasma-like Medium (HPLM). (A) Log fold increase in cell number throughout the 11-day expansion is shown. (B) Proportion of CD4+ and CD8+ T cells of live CD3+ cells, pre- and post-expansion from six healthy donors, is shown. (C–E) Representative plot (C) and tabulated data for CD8+ (D) and CD4+ (E) T cells following expansion are shown: naïve (TN), central memory (TCM), effector (TEFF), and effector memory (TEM). (F and G) Percentage of (F) CD25+ and (G) PD-1+ CD4+ and CD8+ T cells is shown. (H) Percentage of IFNγ+ and TNF-α+ cells after CD3/CD28 reactivation following expansion is shown (n = 3). Bar graphs represent mean of n = 6 (A–G) and (H) n = 3 + SEM from healthy donors. Statistical significance was calculated using a Student’s t test (B) or a one-way ANOVA (D–H); ∗p < 0.05, ∗∗p < 0.01, ∗∗∗p < 0.001, and ∗∗∗∗p < 0.0001.
Figure 2
Figure 2
T cell products exhibit different mitochondrial phenotypes T cells from three healthy donors were expanded in five different conditions for 12 days. (A and B) Representative plot (left) and tabulated data (right) for median fluorescence intensity (MFI) of mitochondrial activity (MitoTracker Deep Red) and (B) mitochondrial mass (MitoTracker Green) are shown. (C) Representative plot (left) and tabulated data (right) for percentage of mitochondrial mass high and mitochondrial ROS high (MitoSOX Red) live populations are shown. Bar graphs represent mean of n = 3 + SEM from healthy donors. Statistical significance was calculated by one-way ANOVA (∗p < 0.05, ∗∗p < 0.01, ∗∗∗p < 0.001, and ∗∗∗∗p < 0.0001).
Figure 3
Figure 3
Cell culture media dictate nutrient uptake but are uncoupled to T cell function (A–D) T cells from three healthy donors were expanded in five different conditions for 11 days. Glucose and glutamine concentrations in the media were measured between days 11 and 12. (A and B) Extracellular (A) glucose and (B) glutamine concentrations in the fresh media (white bars) and spent media after culture for 24 h (solid bars) are shown. (C and D) On day 11, expanded T cells from all five conditions were switched to the REP media (CTL:AIM-V) for 24 h. Extracellular (C) glucose and (D) glutamine concentrations in fresh CTL:AIM-V (blue open), spent media after culture for 24 h with REP-expanded cells (blue closed) and the four other expansion products in CTL:AIM-V (dashed open) are shown. (E and F) On day 12, T cells from all five conditions underwent CD3/CD28 reactivation for 2 days in their respective conditions (solid bars) or were switched to CTL:AIM-V (blue dashed bars). Percentage of (E) IFNγ+ and (F) TNF-α+ cells is shown. Bar graphs represent mean n = 3 + SEM from healthy donors. Statistical significance was calculated by one-way ANOVA (A, B, E, and F) or Student’s t test (C and D); ∗p < 0.05, ∗∗p < 0.01, ∗∗∗p < 0.001, and ∗∗∗∗p < 0.0001.
Figure 4
Figure 4
Culture media influences glucose utilization and the metabolic profile of T cells (A) Schematic of [U-13C]glucose metabolism; circles represent the carbons for each metabolite. CoA, coenzyme A. (B–K) Three healthy donors were expanded in REP and ICM for 11 days. On day 11, CD4+ and CD8+ cells were isolated and incubated in the following [U-13C]glucose conditions for 24 h: REP cells in CTL:AIM-V (blue bar), ICM cells in ImmunoCult-XF (red bar), and ICM cells cultured in CTL:AIM-V (red and blue dashes). (B) Extracellular lactate M+3 relative to extracellular glucose M+6 enrichment is shown. (C) Intracellular alanine M+3 relative to intracellular glucose M+6 enrichment is shown. (D and E) CD8+ intracellular enrichment of (D) serine M+3 and (E) glycine M+2 relative to intracellular glucose M+6 enrichment is shown. (F and G) Pyruvate carboxylase activity (F; citrate M+3/pyruvate M+3) and pyruvate dehydrogenase activity (G; citrate M+2/pyruvate M+3) are shown. (H) Proportion of intracellular α-ketoglutarate M+2 to citrate M+2 enrichment is shown. (I) Glutamine uptake (mM) from days 11 to 12 in CD4+ and CD8+ T cells is shown. (J and K) Percentage of PD-1+ (J) and CD25+ (K) cells is shown. Data are shown as mean of n = 3 + SEM from healthy donors. Statistical significance was calculated by Student’s t tests (∗p < 0.05, ∗∗p < 0.01, and ∗∗∗p < 0.001).
Figure 5
Figure 5
T cell products exhibit different metabolic and functional phenotypes in the ascites tumor microenvironment T cells from three healthy donors were expanded in five different conditions over 12 days. On day 12, T cell products were reactivated (CD3/CD28) in ascites, and T cell metabolism and function was assessed after 2 days. (A) Schematic of experimental timeline is shown. Created with BioRender.com. (B) Percentage of live cells in ascites supernatant is shown. (C) MFI of mitochondrial activity (MitoTracker Deep Red) in the ascites is shown. (D and E) Percentage of (D) PD-1 and (E) IFNγ+ and TNF-α+ cells in the ascites is shown. Data are shown as mean of n = 3 + SEM from healthy donors. Statistical significance was calculated by one-way ANOVA (∗p < 0.05, ∗∗p < 0.01, ∗∗∗p < 0.001, and ∗∗∗∗p < 0.0001).

References

    1. Maude S.L., Laetsch T.W., Buechner J., Rives S., Boyer M., Bittencourt H., Bader P., Verneris M.R., Stefanski H.E., Myers G.D., et al. Tisagenlecleucel in children and young adults with B-cell lymphoblastic leukemia. N. Engl. J. Med. 2018;378:439–448. - PMC - PubMed
    1. Neelapu S.S., Locke F.L., Bartlett N.L., Lekakis L.J., Miklos D.B., Jacobson C.A., Braunschweig I., Oluwole O.O., Siddiqi T., Lin Y., et al. Axicabtagene ciloleucel CAR T-cell therapy in refractory large B-cell lymphoma. N. Engl. J. Med. 2017;377:2531–2544. - PMC - PubMed
    1. Schubert M.-L., Hoffmann J.-M., Dreger P., Müller-Tidow C., Schmitt M. Chimeric antigen receptor transduced T cells: tuning up for the next generation. Int. J. Cancer. 2018;142:1738–1747. - PubMed
    1. Martinez M., Moon E.K. CAR T cells for solid tumors: new strategies for finding, infiltrating, and surviving in the tumor microenvironment. Front. Immunol. 2019;10:128. - PMC - PubMed
    1. Radvanyi L.G., Bernatchez C., Zhang M., Fox P.S., Miller P., Chacon J., Wu R., Lizee G., Mahoney S., Alvarado G., et al. Specific lymphocyte subsets predict response to adoptive cell therapy using expanded autologous tumor-infiltrating lymphocytes in metastatic melanoma patients. Clin. Cancer Res. Off. J. Am. Assoc. Cancer Res. 2012;18:6758–6770. - PMC - PubMed

LinkOut - more resources