

Gene co-expression reveals the modularity and integration of C4 and CAM in Portulaca
- PMID: 35285495
- PMCID: PMC9157154
- DOI: 10.1093/plphys/kiac116
Gene co-expression reveals the modularity and integration of C4 and CAM in Portulaca
Abstract
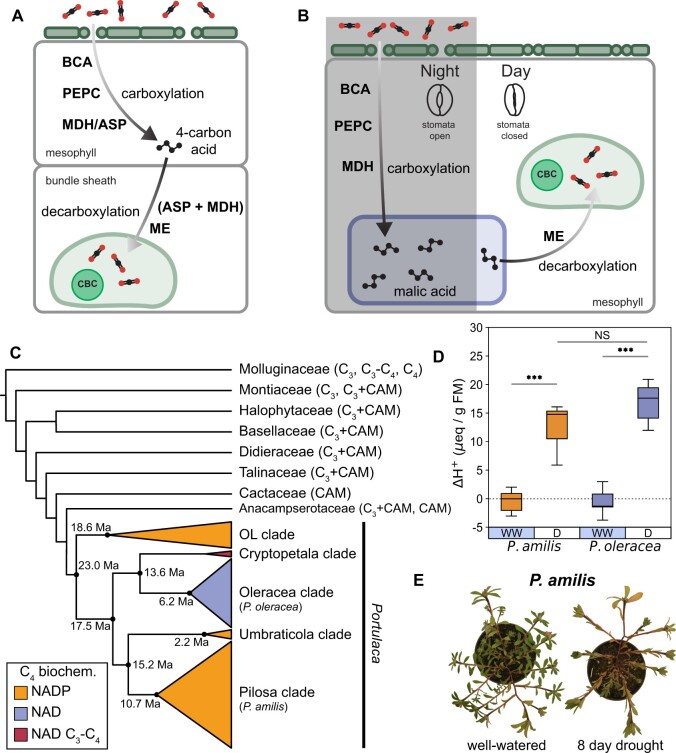
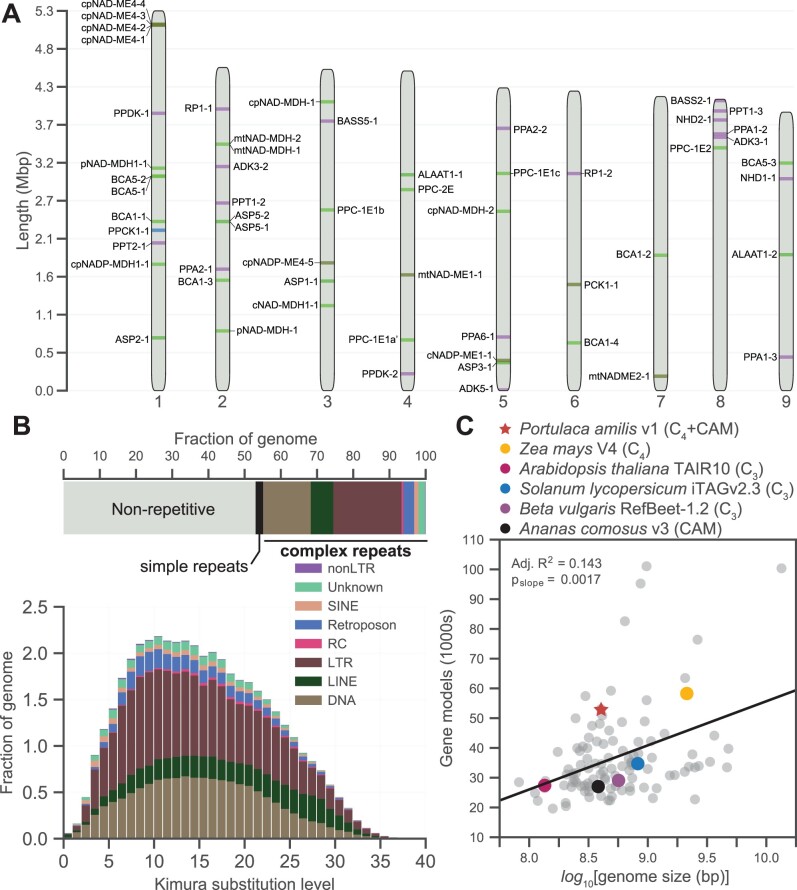
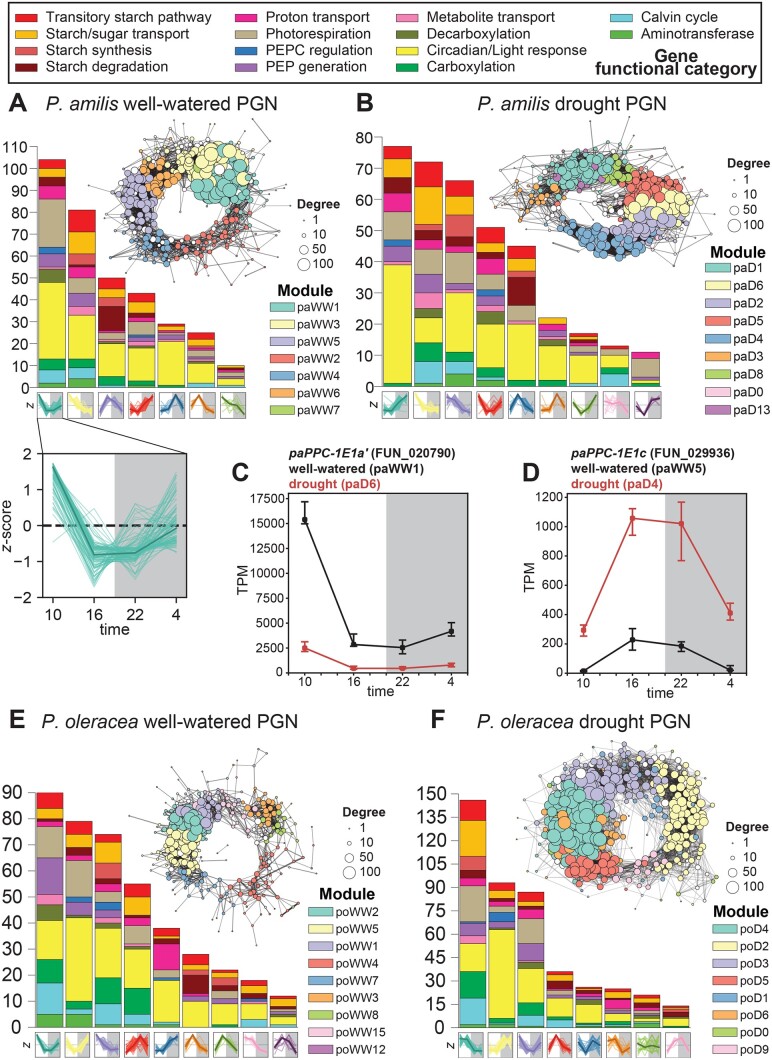
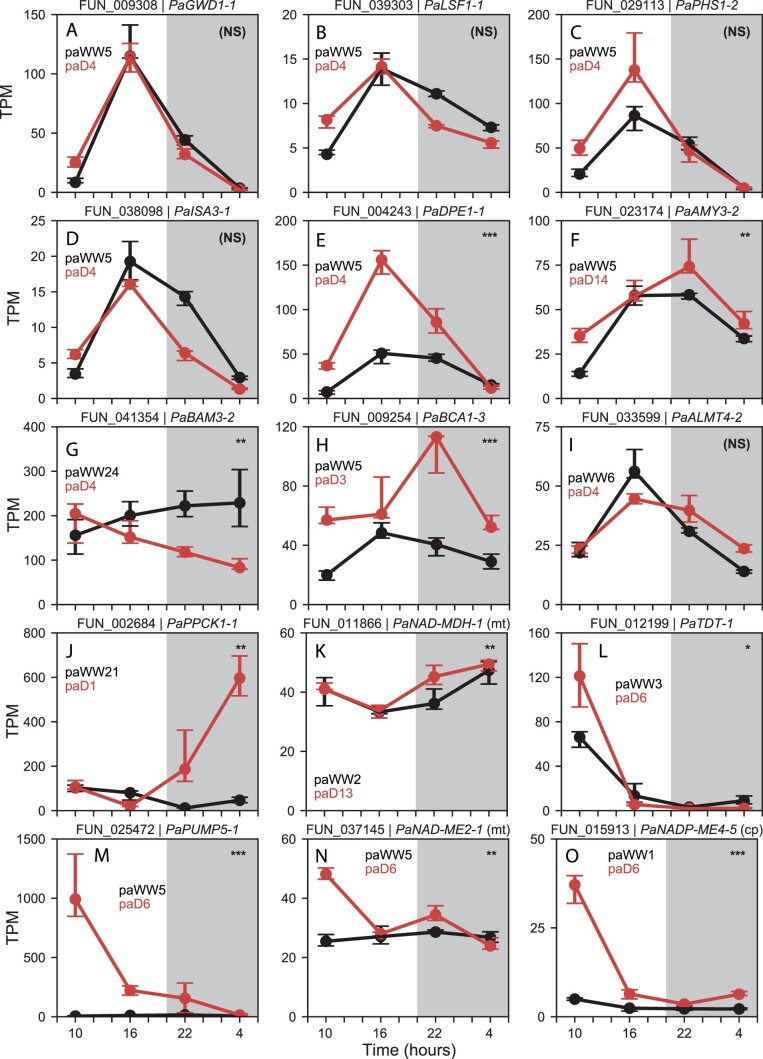
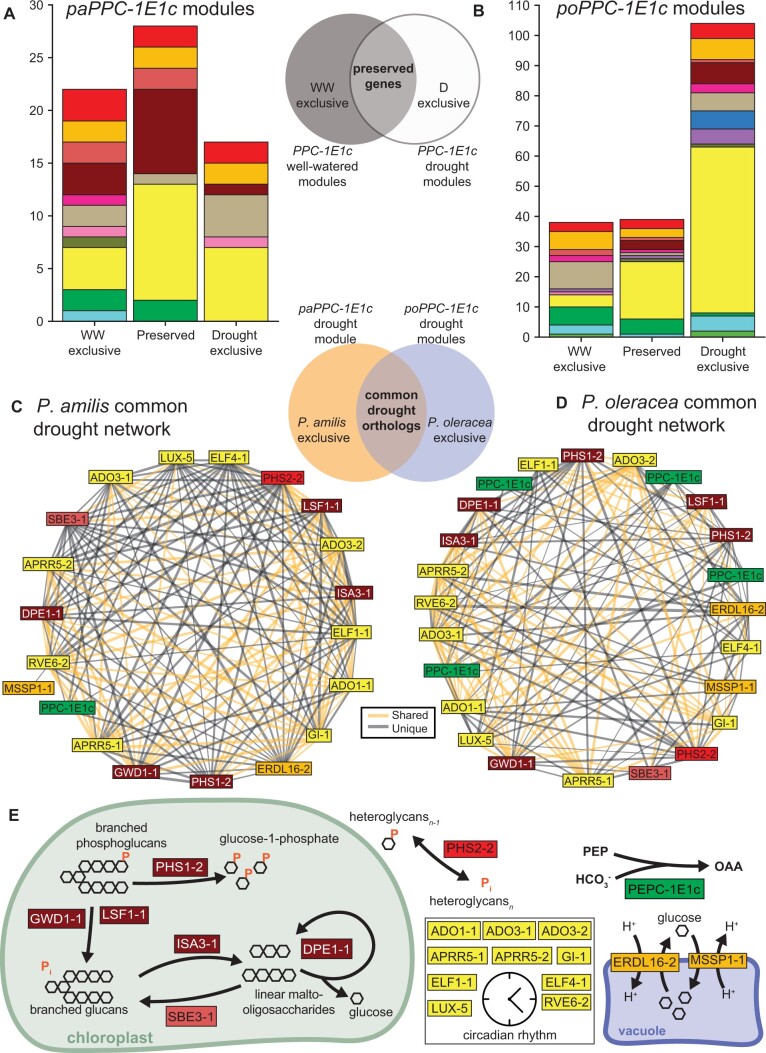
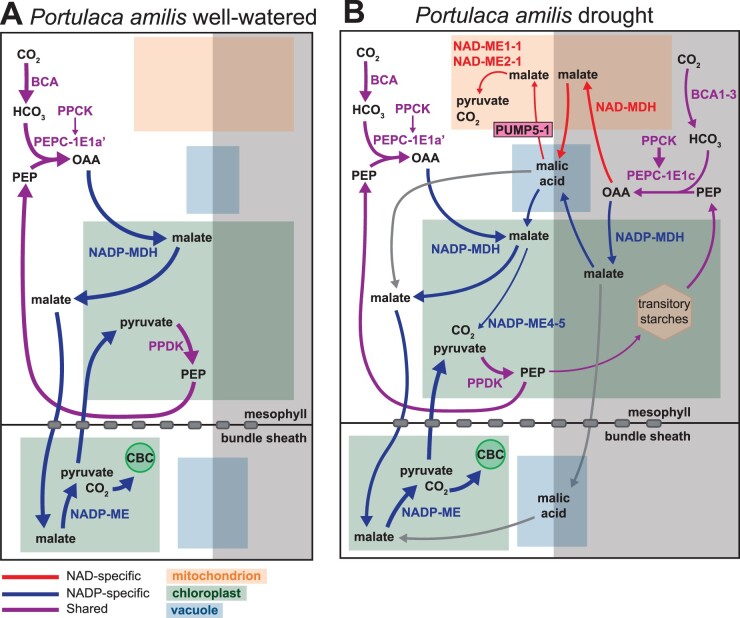
C4 photosynthesis and Crassulacean acid metabolism (CAM) have been considered as largely independent adaptations despite sharing key biochemical modules. Portulaca is a geographically widespread clade of over 100 annual and perennial angiosperm species that primarily use C4 but facultatively exhibit CAM when drought stressed, a photosynthetic system known as C4 + CAM. It has been hypothesized that C4 + CAM is rare because of pleiotropic constraints, but these have not been deeply explored. We generated a chromosome-level genome assembly of Portulaca amilis and sampled mRNA from P. amilis and Portulaca oleracea during CAM induction. Gene co-expression network analyses identified C4 and CAM gene modules shared and unique to both Portulaca species. A conserved CAM module linked phosphoenolpyruvate carboxylase to starch turnover during the day-night transition and was enriched in circadian clock regulatory motifs in the P. amilis genome. Preservation of this co-expression module regardless of water status suggests that Portulaca constitutively operate a weak CAM cycle that is transcriptionally and posttranscriptionally upregulated during drought. C4 and CAM mostly used mutually exclusive genes for primary carbon fixation, and it is likely that nocturnal CAM malate stores are shuttled into diurnal C4 decarboxylation pathways, but we found evidence that metabolite cycling may occur at low levels. C4 likely evolved in Portulaca through co-option of redundant genes and integration of the diurnal portion of CAM. Thus, the ancestral CAM system did not strongly constrain C4 evolution because photosynthetic gene networks are not co-regulated for both daytime and nighttime functions.
© American Society of Plant Biologists 2022. All rights reserved. For permissions, please email: journals.permissions@oup.com.
Figures
Similar articles
-
A matter of time: regulatory events behind the synchronization of C4 and crassulacean acid metabolism in Portulaca oleracea.J Exp Bot. 2022 Aug 11;73(14):4867-4885. doi: 10.1093/jxb/erac163. J Exp Bot. 2022. PMID: 35439821
-
Exploring C4-CAM plasticity within the Portulaca oleracea complex.Sci Rep. 2020 Aug 28;10(1):14237. doi: 10.1038/s41598-020-71012-y. Sci Rep. 2020. PMID: 32859905 Free PMC article.
-
Optional use of CAM photosynthesis in two C4 species, Portulaca cyclophylla and Portulaca digyna.J Plant Physiol. 2017 Jul;214:91-96. doi: 10.1016/j.jplph.2017.01.010. Epub 2017 Feb 1. J Plant Physiol. 2017. PMID: 28511087
-
The photosynthetic plasticity of crassulacean acid metabolism: an evolutionary innovation for sustainable productivity in a changing world.New Phytol. 2011 Aug;191(3):619-633. doi: 10.1111/j.1469-8137.2011.03781.x. Epub 2011 Jun 16. New Phytol. 2011. PMID: 21679188 Review.
-
Facultative crassulacean acid metabolism (CAM) plants: powerful tools for unravelling the functional elements of CAM photosynthesis.J Exp Bot. 2014 Jul;65(13):3425-41. doi: 10.1093/jxb/eru063. Epub 2014 Mar 18. J Exp Bot. 2014. PMID: 24642847 Review.
Cited by
-
A chromosome-level genome assembly provides insights into the local adaptation of Tamarix austromongolica in the Yellow River Basin, China.DNA Res. 2024 Aug 1;31(4):dsae021. doi: 10.1093/dnares/dsae021. DNA Res. 2024. PMID: 38946223 Free PMC article.
-
As right as rain: deciphering drought-related metabolic flexibility in the C4-CAM Portulaca.J Exp Bot. 2022 Aug 11;73(14):4615-4619. doi: 10.1093/jxb/erac179. J Exp Bot. 2022. PMID: 35950459 Free PMC article.
-
The diverse diaspora of CAM: a pole-to-pole sketch.Ann Bot. 2023 Nov 25;132(4):597-625. doi: 10.1093/aob/mcad067. Ann Bot. 2023. PMID: 37303205 Free PMC article. Review.
-
Reconciling continuous and discrete models of C4 and CAM evolution.Ann Bot. 2023 Nov 25;132(4):717-725. doi: 10.1093/aob/mcad125. Ann Bot. 2023. PMID: 37675944 Free PMC article.
-
A high-quality Bougainvillea genome provides new insights into evolutionary history and pigment biosynthetic pathways in the Caryophyllales.Hortic Res. 2023 Jun 13;10(8):uhad124. doi: 10.1093/hr/uhad124. eCollection 2023 Aug. Hortic Res. 2023. PMID: 37554346 Free PMC article.
References
-
- Abraham PE, Yin H, Borland AM, Weighill D, Lim SD, Paoli HCD, Engle N, Jones PC, Agh R, Weston DJ, et al. (2016) Transcript, protein and metabolite temporal dynamics in the CAM plant Agave. Nat Plants 2: 16178 - PubMed
-
- Bailey TL, Elkan C (1994) Fitting a mixture model by expectation maximization to discover motifs in biopolymers. Proceedings of the Second International Conference on Intelligent Systems for Molecular Biology. AAAI Press, Menlo Park, CA, pp 28–36 - PubMed
Publication types
MeSH terms
Substances
LinkOut - more resources
Full Text Sources
Miscellaneous
