. 2022 Oct 12;71(6):1290-1306.
doi: 10.1093/sysbio/syac022.

Assessing Bayesian Phylogenetic Information Content of Morphological Data Using Knowledge From Anatomy Ontologies

Affiliations

Assessing Bayesian Phylogenetic Information Content of Morphological Data Using Knowledge From Anatomy Ontologies

Diego S Porto et al. Syst Biol. .

Abstract

Morphology remains a primary source of phylogenetic information for many groups of organisms, and the only one for most fossil taxa. Organismal anatomy is not a collection of randomly assembled and independent "parts", but instead a set of dependent and hierarchically nested entities resulting from ontogeny and phylogeny. How do we make sense of these dependent and at times redundant characters? One promising approach is using ontologies-structured controlled vocabularies that summarize knowledge about different properties of anatomical entities, including developmental and structural dependencies. Here, we assess whether evolutionary patterns can explain the proximity of ontology-annotated characters within an ontology. To do so, we measure phylogenetic information across characters and evaluate if it matches the hierarchical structure given by ontological knowledge-in much the same way as across-species diversity structure is given by phylogeny. We implement an approach to evaluate the Bayesian phylogenetic information (BPI) content and phylogenetic dissonance among ontology-annotated anatomical data subsets. We applied this to data sets representing two disparate animal groups: bees (Hexapoda: Hymenoptera: Apoidea, 209 chars) and characiform fishes (Actinopterygii: Ostariophysi: Characiformes, 463 chars). For bees, we find that BPI is not substantially explained by anatomy since dissonance is often high among morphologically related anatomical entities. For fishes, we find substantial information for two clusters of anatomical entities instantiating concepts from the jaws and branchial arch bones, but among-subset information decreases and dissonance increases substantially moving to higher-level subsets in the ontology. We further applied our approach to address particular evolutionary hypotheses with an example of morphological evolution in miniature fishes. While we show that phylogenetic information does match ontology structure for some anatomical entities, additional relationships and processes, such as convergence, likely play a substantial role in explaining BPI and dissonance, and merit future investigation. Our work demonstrates how complex morphological data sets can be interrogated with ontologies by allowing one to access how information is spread hierarchically across anatomical concepts, how congruent this information is, and what sorts of processes may play a role in explaining it: phylogeny, development, or convergence. [Apidae; Bayesian phylogenetic information; Ostariophysi; Phenoscape; phylogenetic dissonance; semantic similarity.].


Figures

Figure 1.
Figure 1.
Comparison of the “true” species phylogeny with trees inferred from different data subsets. a) “True” species phylogeny. Squares and circles indicates hypothetical ecological/functional factors shared by some species (e.g., habitat: squares: fresh water; circles: marine). b) Ontology relations among anatomy entity concepts represented as a clustering dendrogram. Node with a star indicates related anatomical entities that share true phylogenetic information. Node with a triangle indicates related anatomical entities that are jointly influenced by convergent evolution but provide no phylogenetic information. c) Trees inferred from characters of “premaxilla,” “maxilla,” “dentary,” and “infraorbital” are congruent and indicates true phylogenetic information. d) Trees inferred from characters of “pectoral fin,” “pelvic fin,” and “dorsal fin” are congruent among themselves but not with the “true” species phylogeny, thus indicating convergence, in this case, associated with other ecological/functional factors (squares and circles). DEN formula image dentary; DF formula image dorsal fin; IO formula image infraorbital; MX formula image maxilla; PCF formula image pectoral fin; PMX formula image premaxilla; PVF formula image pelvic fin; sp1…sp50, species in a data set. For colors, please refer to the online version of this paper available at https://doi.org/10.1093/sysbio/syac022.
Figure 2.
Figure 2.
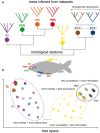
Diagrammatic representation of the relationship between ontology structure, represented as a clustering dendrogram, and a hypothetical posterior tree space. a) Ontology hierarchy of anatomy entity concepts referring to data subsets used to infer posterior distribution of trees (only one tree shown above each term). The hierarchy is represented as a clustering dendrogram based on semantic similarity distances among anatomy entity concepts. b) Representation of a hypothetical posterior tree space. Axes indicate topological distances among distinct trees in the posterior distribution. Each circle indicates a discrete tree topology. Shade intensity is proportional to the posterior probability of each topology. Dotted ellipses indicate the hypothetical area of the tree space occupied by inferred trees in the posterior of some data subsets. DEN formula image dentary; DF formula image dorsal fin; IO formula image infraorbital; MX formula image maxilla; PCF formula image pectoral fin; PMX formula image premaxilla; PVF formula image pelvic fin. For colors, please refer to the online version of this paper available at https://doi.org/10.1093/sysbio/syac022.
Figure 3.
Figure 3.
Diagrammatic representation of main steps of the ontobayes analysis. a) Ontology terms referring to anatomical entities of the fish anatomy. b) Terms in the ontology are related to other terms by ontological relations (e.g., is_a, part_of), which can be represented as a graph. c) Semantic similarity metrics derived from such a graph (e.g., Jaccard, Resnik) can be employed to build a clustering dendrogram for terms. d) The structure of such a dendrogram can then be used to guide comparison of subsets of characters linked to the same or related ontology terms. e) Each subset is used to produce posterior probability distributions of phylogenetic tree topologies which are used to estimate Information Theory metrics (i.e., entropy, information, dissonance). AN formula image organismal anatomy; AO formula image anatomy ontology; BI formula image Bayesian inference; C1…C30, characters in a matrix; DEN formula image dentary; DF formula image dorsal fin; E1…E2, entropy of posterior distributions; IO formula image infraorbital; MT formula image character matrices; MX formula image maxilla; PCF formula image pectoral fin; PMX formula image premaxilla; PVF formula image pelvic fin; sp1…sp50, species in a matrix; SS formula image semantic similarity dendrogram. For colors, please refer to the online version of this paper available at https://doi.org/10.1093/sysbio/syac022.
Figure 4.
Figure 4.
Bayesian phylogenetic information content for all anatomical entities linked to Uberon terms in the FISH data set. Clustering dendrograms in (a) and (b) are obtained from pairwise semantic similarity between terms converted to a distance matrix. Barplots in middle column show information content of individual trait subsets defined by ontology terms relative to mean information across all subsets. Filled circles in trait dendrograms show (a) Bayesian phylogenetic information content and (b) phylogenetic dissonance among trait subsets defined by the ontology terms subtended by each node relative to respective mean values across all subsets. Bar lengths and circles have no absolute scale and are proportional to the relative maximum amount of (a) information or (b) dissonance observed. Arrowheads indicate clusters of terms in the semantic similarity dendrogram comprising groups of relatively highly informative individual data subsets. Bottom left and right boxes contain explanatory diagrams on how to interpret results in this figure. For colors, please refer to the online version of this paper available at https://doi.org/10.1093/sysbio/syac022.
Figure 5.
Figure 5.
Clade-specific Bayesian phylogenetic information components in the FISH data set. Heatmap shows which clades (columns) from a reference phylogenetic species tree (below) are supported by each subset defined by ontology terms (rows) in the reference trait dendrogram (right). Species tree is based on all characters. Trait clustering dendrogram is obtained from pairwise semantic similarity between terms converted to a distance matrix. Dashed boxes indicate two major clusters of data subsets. Heatmap color shade intensity is proportional to posterior probability. Barplots at bottom right show proportion of trait subsets supporting a given clade in the phylogenetic species tree. N1…N8, nodes referring to clades in the phylogenetic species tree. For colors, please refer to the online version of this paper available at https://doi.org/10.1093/sysbio/syac022.
Figure 6.
Figure 6.
Boxplots showing estimated (a) Bayesian phylogenetic information and (b) phylogenetic dissonance across replicated analyses for standard data subsets relative to resampled data subsets. Values above the dotted line indicate values higher than the median of the respective resampled data subsets. Note that information is higher and dissonance is lower for all ontology-based data subsets except IO than random subsets sampled of the same size, but without respect to ontology. CB formula image ceratobranchial bone; DEN formula image dentary; EB formula image epibranchial bone; IO formula image infraorbital; PMX formula image premaxilla; MX formula image maxilla. The “r” prefix denotes resampled subsets. For colors, please refer to the online version of this paper available at https://doi.org/10.1093/sysbio/syac022.

References

    1. Arendt D. 2008. The evolution of cell types in animals: emerging principles from molecular studies. Nat. Rev. Genet. 9:868–882. - PubMed
    1. Arendt D., Musser J.M., Baker C.V., Bergman A., Cepko C., Erwin D.H., Pavlicev M., Schlosser G., Widder S., Laubichler M.D., Wagner G.P.. 2016. The origin and evolution of cell types. Nat. Rev. Genet. 17:744–757. - PubMed
    1. Balhoff J.P., Dahdul W.M., Kothari C.R., Lapp H., Lundberg J.G., Mabee P., Midford P.E., Westerfield M., Vision T.J.. 2010. Phenex: ontological annotation of phenotypic diversity. PLoS One. 5:e10500. - PMC - PubMed
    1. Bandelt H.J., Dress A.W.. 1992. Split decomposition: a new and useful approach to phylogenetic analysis of distance data. Mol. Phylogenet. Evol. 1:242–252. - PubMed
    1. Bard J., Rhee S.Y., Ashburner M.. 2005. An ontology for cell types. Genome Biol. 6:1–5. - PMC - PubMed

Publication types