. 2022 Apr 13;96(7):e0190421.
doi: 10.1128/jvi.01904-21. Epub 2022 Mar 14.

Multiple Respiratory Syncytial Virus (RSV) Strains Infecting HEp-2 and A549 Cells Reveal Cell Line-Dependent Differences in Resistance to RSV Infection

Affiliations

Multiple Respiratory Syncytial Virus (RSV) Strains Infecting HEp-2 and A549 Cells Reveal Cell Line-Dependent Differences in Resistance to RSV Infection

Anubama Rajan et al. J Virol. .

Abstract

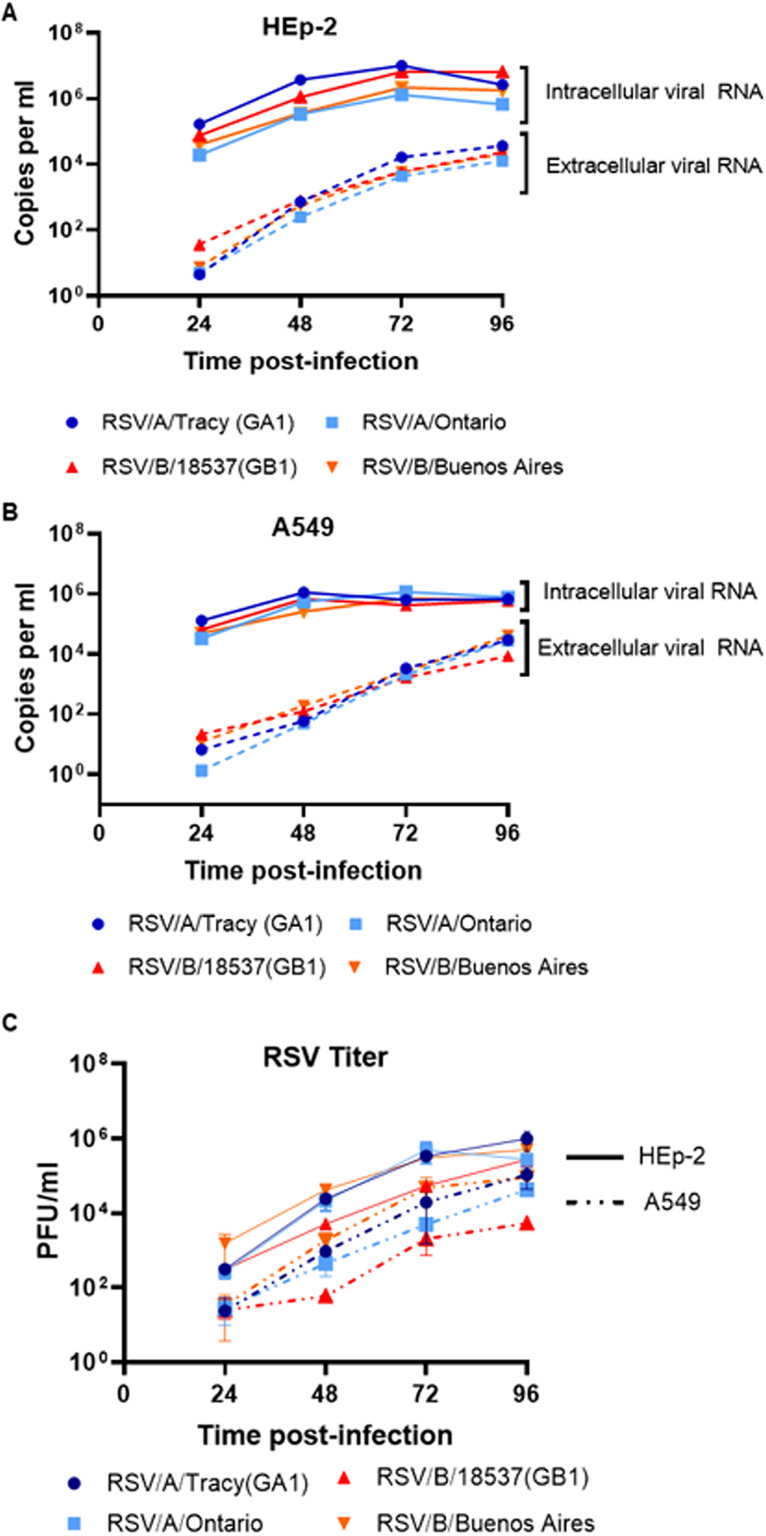
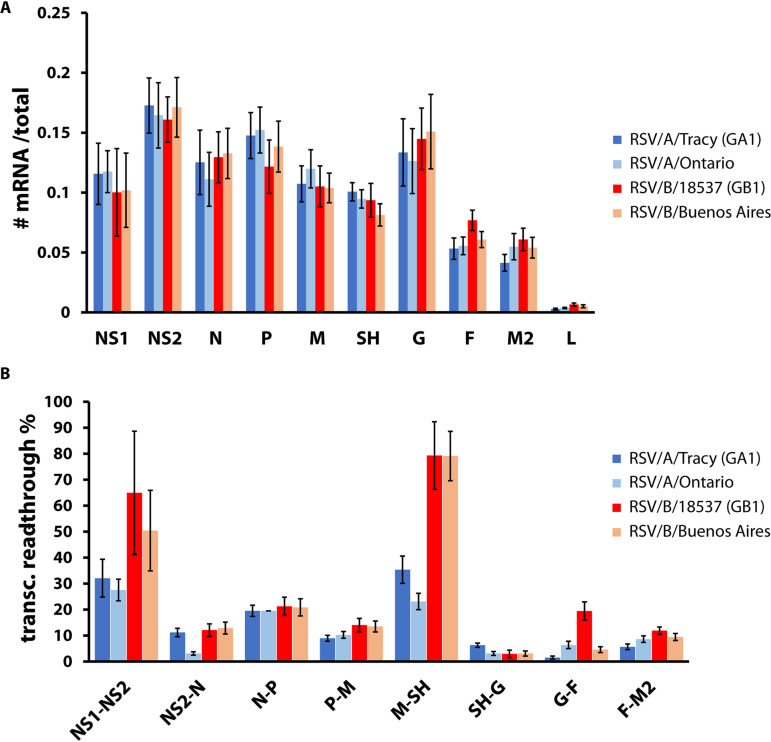
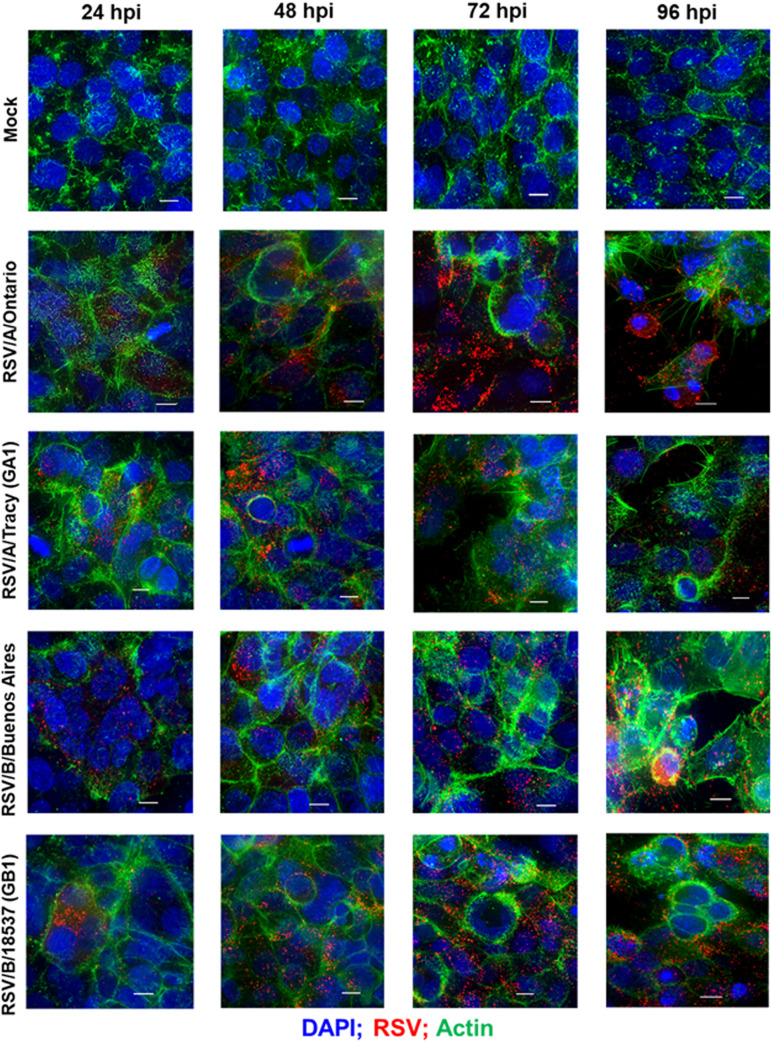
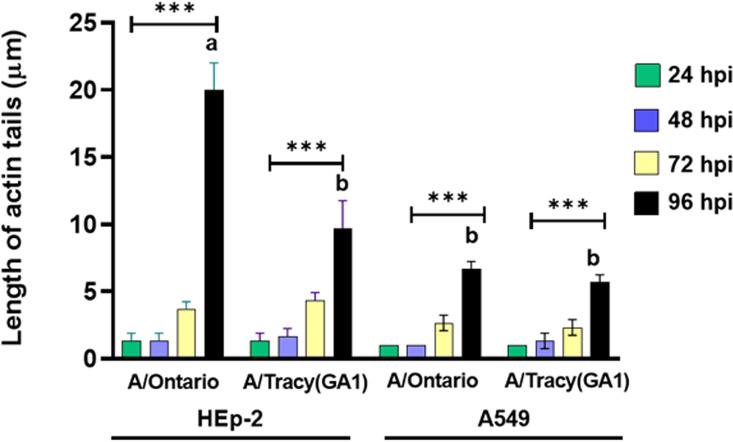
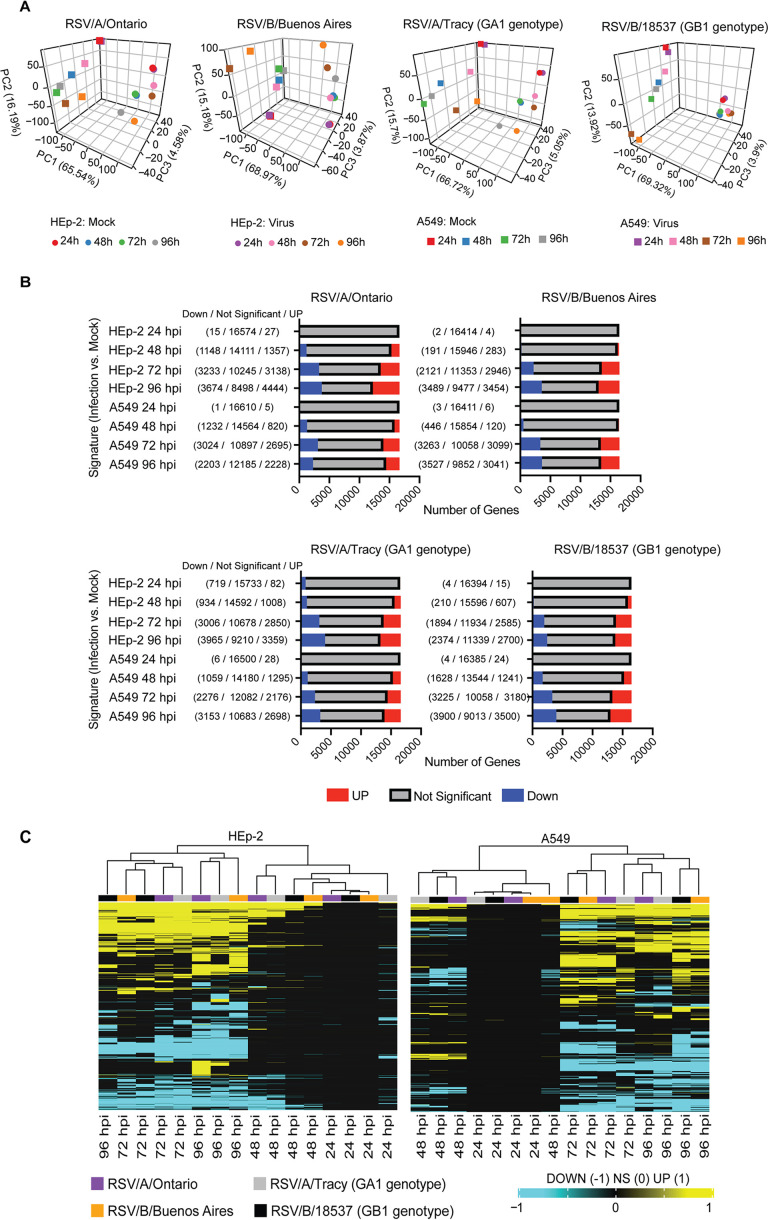
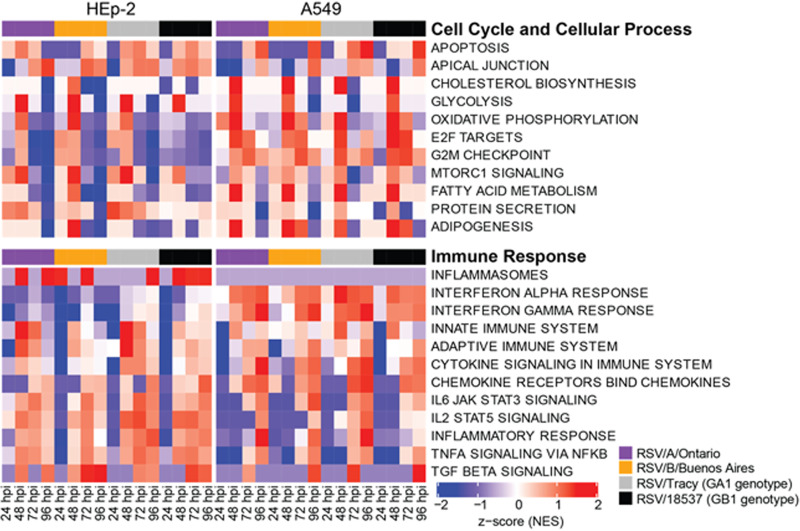
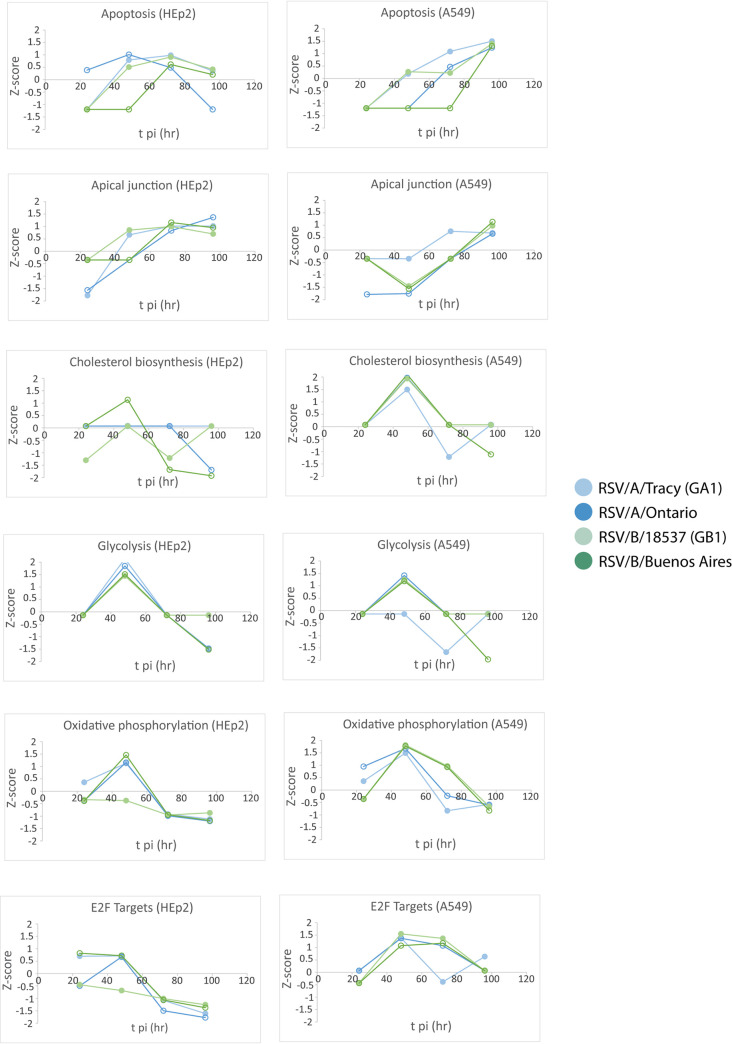
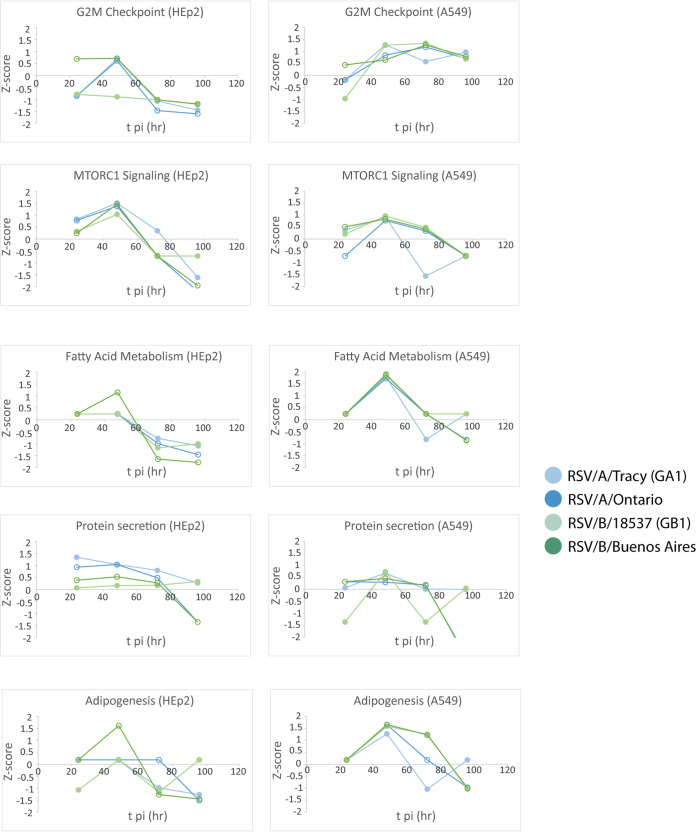
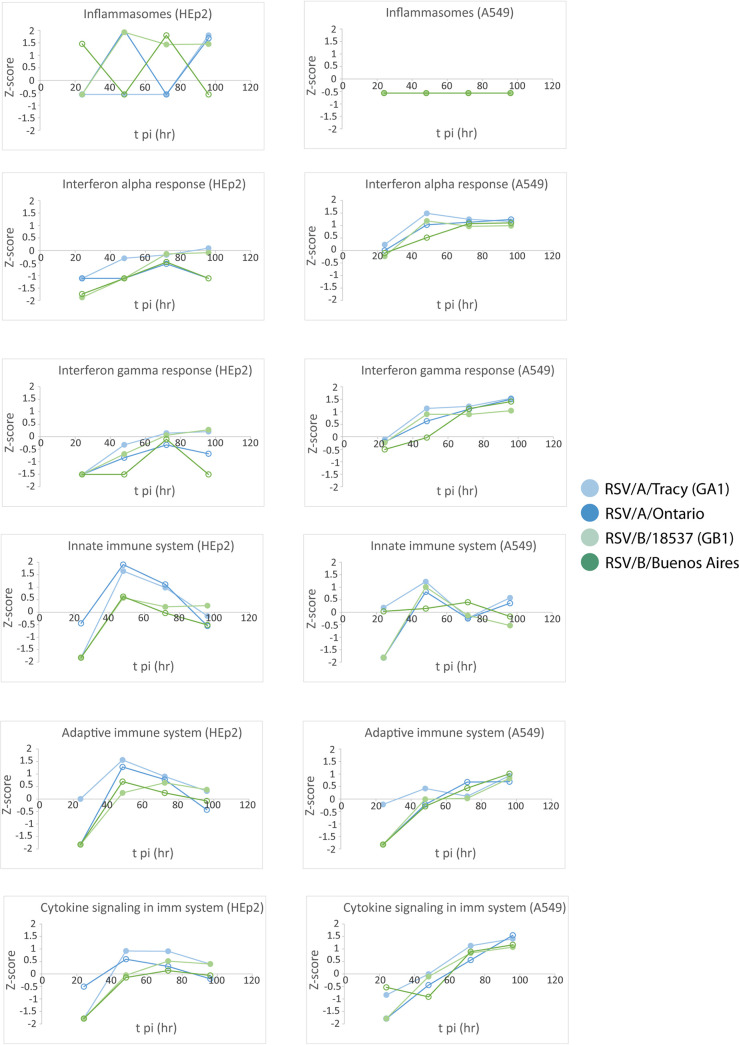
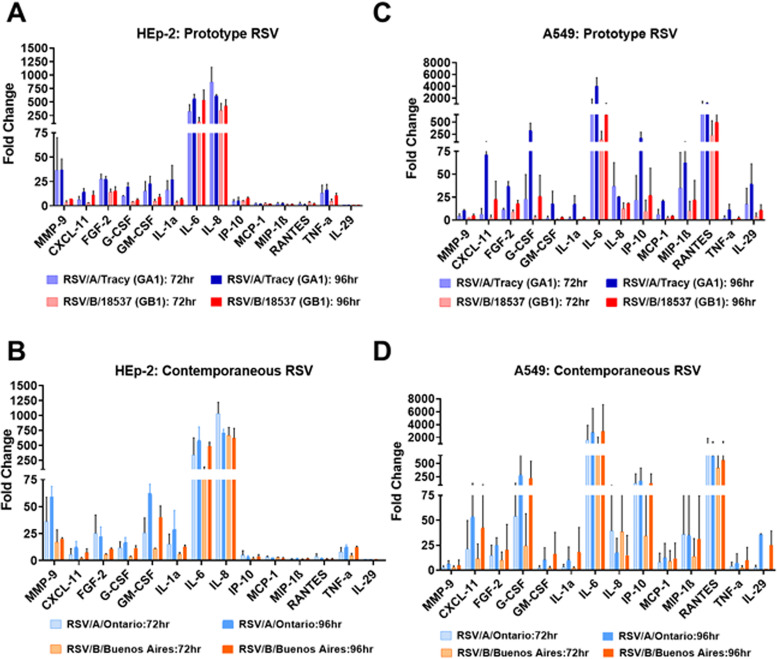
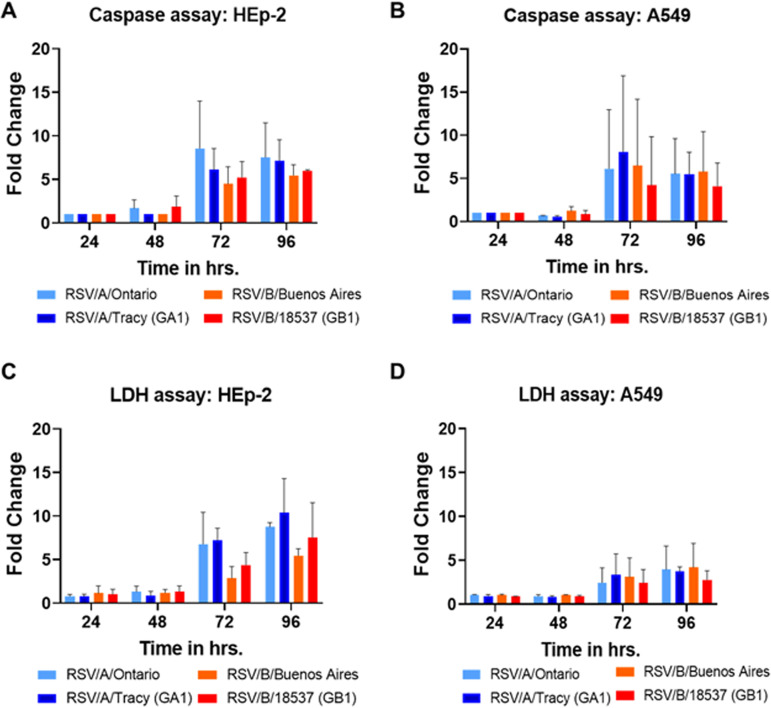
Respiratory syncytial virus (RSV) is a leading cause of pediatric acute respiratory infection worldwide. There are currently no approved vaccines or antivirals to combat RSV disease. A few transformed cell lines and two historic strains have been extensively used to study RSV. Here, we reported a thorough molecular and cell biological characterization of HEp-2 and A549 cells infected with one of four strains of RSV representing both major subgroups as well as historic and more contemporary genotypes (RSV/A/Tracy [GA1], RSV/A/Ontario [ON], RSV/B/18537 [GB1], and RSV/B/Buenos Aires [BA]) via measurements of viral replication kinetics and viral gene expression, immunofluorescence-based imaging of gross cellular morphology and cell-associated RSV, and measurements of host response, including transcriptional changes and levels of secreted cytokines and growth factors. IMPORTANCE Infection with the respiratory syncytial virus (RSV) early in life is essentially guaranteed and can lead to severe disease. Most RSV studies have involved either of two historic RSV/A strains infecting one of two cell lines, HEp-2 or A549 cells. However, RSV contains ample variation within two evolving subgroups (A and B), and HEp-2 and A549 cell lines are genetically distinct. Here, we measured viral action and host response in both HEp-2 and A549 cells infected with four RSV strains from both subgroups and representing both historic and more contemporary strains. We discovered a subgroup-dependent difference in viral gene expression and found A549 cells were more potently antiviral and more sensitive, albeit subtly, to viral variation. Our findings revealed important differences between RSV subgroups and two widely used cell lines and provided baseline data for experiments with model systems better representative of natural RSV infection.

Keywords: A549; HEp-2; RSV; cytokines; host gene expression; viral gene expression.


Conflict of interest statement

The authors declare no conflict of interest.

Figures

FIG 1
FIG 1
Viral load and replication kinetics of RSV infection. HEp-2 and A549 cells were infected with RSV (RSV/A/Tracy [GA1], RSV/A/Ontario [ON], RSV/B/18537 [GB1], RSVB/Buenos Aires [BA]) at a multiplicity of infection (MOI) of 0.01. Samples were collected at 24, 48, 72, and 96 h postinoculation (hpi). RNA was isolated from media (extracellular) and cell lysate (intracellular) and copy numbers of RSV nucleocapsid (N) gene RNA were determined using quantitative real-time PCR (qRT-PCR). Levels of RSV N gene RNA in (A) HEp-2 cells at different time points after RSV inoculation, and (B) A549 cells at different time points after RSV inoculation. (C) Extracellular live virus was collected from the media of HEp-2 and A549 inoculated cell cultures. The extracellular virus concentrations were determined by a quantitative plaque assay and reported as log10 plaque forming unit (PFU)/mL in HEp-2 cells. Data shown are from two individual experiments with two replicates per group in each experiment and are represented as mean ± SD.
FIG 2
FIG 2
RSV gene expression. HEp-2 cells were infected with RSV (RSV/A/Tracy [GA1], RSV/A/Ontario, RSV/B/18537 [GB1], RSV/B/Buenos Aires) at a multiplicity of infection (MOI) of 0.01. Samples were collected at 24 and 48 h postinoculation (hpi). RNA was isolated from cell lysates and prepared for and subjected to high-throughput short-read sequencing. (A) Relative mRNA levels are comparable across the four RSV strains tested. For each time point and each of 10 RSV genes, the average read depth across the gene’s coding sequence was divided by the total number of reads mapping to all 10 viral coding sequences. Data shown are averages ± SD of results for 24 and 48 hpi. (B) Transcriptional readthrough at particular gene junctions varied between RSV subgroups and strains. For each time point and each of eight RSV gene junctions, the average read depth across the gene junction was divided by the average read depth across the nearest upstream coding sequence. Data shown are averages ± SD of results for 24 and 48 hpi.
FIG 3
FIG 3
RSV infectivity pattern and cellular damage in HEp-2 cells visualized by immunofluorescence micrographs. Representative epifluorescence deconvolution micrographs of HEp-2 cells labeled or nuclei (DAPI), RSV (M2-1; red), and Actin (green). Cells were either mock-treated or infected with RSV/A/Tracy (GA1), RSV/A/Ontario (ON), RSV/B/18537 (GB1), or RSV/B/Buenos Aires (BA) at a multiplicity of infection of 0.01 for 24, 48, 72, or 96 h. Scale bars indicate 10 μm.
FIG 4
FIG 4
RSV infectivity pattern and cellular damage in A549 cells visualized by immunofluorescence micrographs. Representative epifluorescence deconvolution micrographs of A549 cells labeled for nuclei (DAPI), RSV (M2-1; red), and Actin (green). Cells were either mock-treated or infected with RSV/A/Tracy (GA1), RSV/A/Ontario (ON), RSV/B/18537 (GB1), or RSV/B/Buenos Aires (BA) at a multiplicity of infection of 0.01 for 24, 48, 72, or 96 h. Scale bars indicate 10 μm.
FIG 5
FIG 5
Quantification of the length of actin tails in RSV/A-infected HEp-2 and A549 cells. Data shown were gathered from three independent samples with three replicates per group in each experiment and are represented as mean ± SD. Asterisks indicate statistical significance determined by two-way ANOVA with Tukey’s multiple-comparison test, P < 0.001 (***). Bars with different letters are significantly different from each other, P < 0.01.
FIG 6
FIG 6
RNA sequencing analysis of RSV infections of HEp-2 and A549 cells. (A) Principal-component analysis of RSV/A/Ontario- (ON), RSV/B/Buenos Aires- (BA), RSV/A/Tracy- (GA1), and RSV/B/18537- (GB1) infected HEp-2 and A549 cells demonstrating the variability observed in the samples (HEp-2 versus A549 and infected versus mock-infected controls). (B) Total number of significant genes identified for the RSV/A/Ontario-, RSV/B/Buenos Aires-, RSV/A/Tracy-, and RSV/B/18537-infected group in HEp-2 and A549 cells (adjusted P < 0.05). (C) Samples were hierarchically clustered based on the union of differentially expressed genes across all comparisons (false discovery rate [FDR] <0.05 and fold change exceeding 1.5×). Genes were converted to 1 for upregulated; −1 for downregulated; and 0 for no significant upregulation or downregulation in a particular signature. Samples were clustered using the Euclidean distance.
FIG 7
FIG 7
Select reactome and hallmark gene ontology pathways identified from a gene set enrichment analysis by filtering for the top 10 normalized enrichment scores (NES) for each category. A false discovery rate of 0.05 was used in the pathway filtering.
FIG 8
FIG 8
Normalized enrichment scores (NES) through time for gene set enrichment analysis (GSEA) identified cellular and metabolic pathways enriched for upregulated or downregulated genes relative to mock.
FIG 9
FIG 9
Normalized enrichment scores (NES) through time for gene set enrichment analysis (GSEA) identified immune pathways enriched for upregulated or downregulated genes relative to mock.
FIG 10
FIG 10
Normalized enrichment scores (NES) through time for gene set enrichment analysis (GSEA) identified cellular and metabolic pathways enriched for upregulated or downregulated genes relative to mock.
FIG 11
FIG 11
Normalized enrichment scores (NES) through time for gene set enrichment analysis (GSEA) identified immune pathways enriched for upregulated or downregulated genes relative to mock.
FIG 12
FIG 12
Profiles of released cytokines and chemokines from HEp-2 and A549 cells. Cells were infected with RSV/A/Tracy (GA1), RSV/B/18537 (GB1), RSV/A/Ontario (ON), or RSV/B/Buenos Aires (BA) at a multiplicity of infection (MOI) of 0.01. The cultured supernatants were harvested from mock-infected and RSV-infected cells at 24, 48, 72, or 96 h postinoculation (hpi). Profiles of cytokines and chemokines released into the supernatant were determined by a multiplex Luminex cytokine assay. The fold change of each cytokine or chemokine between virus- and mock-infected cells are shown. Fold changes of cytokines and chemokines released from HEp-2 cells infected with (A) historic RSV strains (RSV/A/Tracy (GA1) and RSV/B/18537 (GB1)) and (B) contemporary RSV strains (RSV/A/Ontario [ON] and RSV/B/Buenos Aires). Fold changes of cytokines and chemokines released from A549 cells infected with historic RSV strains (C) and contemporary RSV (D) strains. At least two independent experiments were performed, and ratios are presented as mean ± SD.
FIG 13
FIG 13
Caspase and lactate dehydrogenase (LDH) assays on HEp-2 and A549 cells infected with RSV strains. Cells were infected with RSV/A/Tracy (GA1), RSV/B/18537 (GB1), RSV/A/Ontario (ON), or RSV/B/Buenos Aires at a multiplicity of infection (MOI) of 0.01. The cultured supernatants were harvested from mock-infected and RSV-infected cells at 24, 48, 72, 96 h postinoculation (hpi). Fold changes of caspase released from (A) HEp-2 cells and (B) A549 cells are shown. Fold changes of LDH released from (C) HEp-2 cells and (D) A549 cells are shown. At least two independent experiments were performed, and ratios are presented as mean ± SD.

Similar articles

Cited by

References

    1. Zlateva KT, Lemey P, Moes E, Vandamme AM, Van Ranst M. 2005. Genetic variability and molecular evolution of the human respiratory syncytial virus subgroup B attachment G protein. J Virol 79:9157–9167. 10.1128/JVI.79.14.9157-9167.2005. - DOI - PMC - PubMed
    1. Schobel SA, Stucker KM, Moore ML, Anderson LJ, Larkin EK, Shankar J, Bera J, Puri V, Shilts MH, Rosas-Salazar C, Halpin RA, Fedorova N, Shrivastava S, Stockwell TB, Peebles RS, Hartert TV, Das SR. 2016. Respiratory Syncytial Virus whole-genome sequencing identifies convergent evolution of sequence duplication in the C-terminus of the G gene. Sci Rep 6:26311. 10.1038/srep26311. - DOI - PMC - PubMed
    1. Hotard AL, Laikhter E, Brooks K, Hartert TV, Moore ML. 2015. Functional analysis of the 60-nucleotide duplication in the respiratory syncytial virus buenos aires strain attachment glycoprotein. J Virol 89:8258–8266. 10.1128/JVI.01045-15. - DOI - PMC - PubMed
    1. Hillyer P, Shepard R, Uehling M, Krenz M, Sheikh F, Thayer KR, Huang L, Yan L, Panda D, Luongo C, Buchholz UJ, Collins PL, Donnelly RP, Rabin RL. 2018. Differential responses by human respiratory epithelial cell lines to respiratory syncytial virus reflect distinct patterns of infection control. J Virol 92:e02202-17. 10.1128/JVI.02202-17. - DOI - PMC - PubMed
    1. Munday DC, Emmott E, Surtees R, Lardeau CH, Wu W, Duprex WP, Dove BK, Barr JN, Hiscox JA. 2010. Quantitative proteomic analysis of A549 cells infected with human respiratory syncytial virus. Mol Cell Proteomics 9:2438–2459. 10.1074/mcp.M110.001859. - DOI - PMC - PubMed

MeSH terms

Substances