. 2022 Mar;130(3):37007.
doi: 10.1289/EHP9791. Epub 2022 Mar 14.

Per- and Polyfluoroalkyl Substances and Risk of Myocardial Infarction and Stroke: A Nested Case-Control Study in Sweden

Affiliations

Per- and Polyfluoroalkyl Substances and Risk of Myocardial Infarction and Stroke: A Nested Case-Control Study in Sweden

Tessa Schillemans et al. Environ Health Perspect. 2022 Mar.

Abstract

Background: Per- and polyfluoroalkyl substances (PFAS) are widespread and persistent pollutants that have been associated with elevated cholesterol levels. However, data on incident cardiovascular disease (CVD) is lacking.

Objectives: We investigated the association of exposure to PFAS with risk of myocardial infarction and stroke and, subsidiary, with baseline blood lipids.

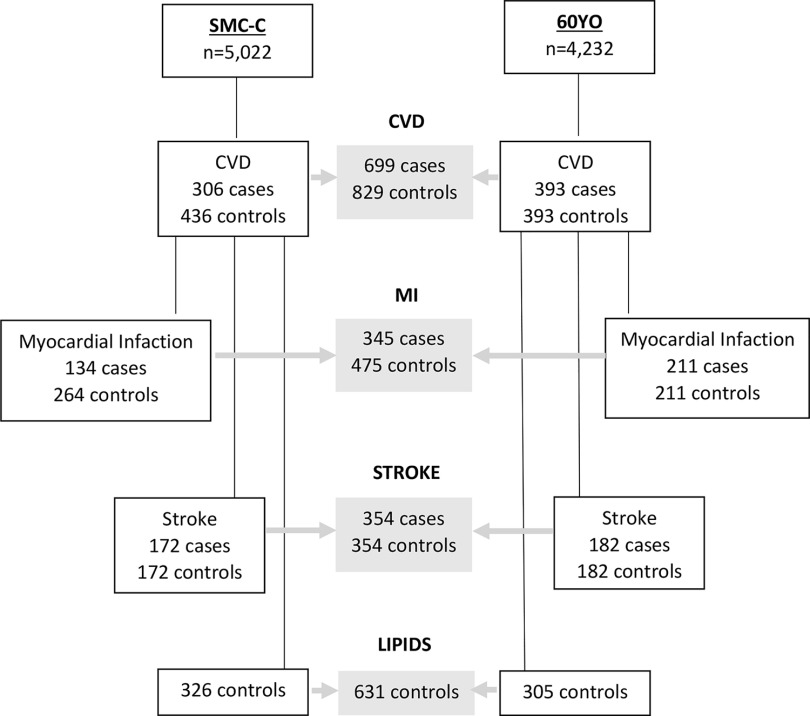
Methods: This population-based nested case-control study included first incident myocardial infarction and stroke cases with matched controls from two Swedish cohorts: the Swedish Mammography Cohort-Clinical (SMC-C) and the Cohort of 60-year-olds (60YO). Baseline blood sampling occurred during 2003-2009 and 1997-1999 with follow-up through 2017 and 2014 for the SMC-C and the 60YO, respectively. Eight plasma PFAS concentrations were measured using targeted liquid chromatography-triple quadrupole mass spectrometry. Five of these were quantifiable in both cohorts; individual values and their standardized sum were categorized into tertiles based on the controls. First incident myocardial infarction (n=345) and ischemic stroke (n=354) cases were ascertained via linkage to the National Inpatient Register and the Cause of Death Register. Controls were randomly selected from each cohort after matching for age, sex, and sample date. Baseline blood lipids were measured in plasma or serum after overnight fasting.

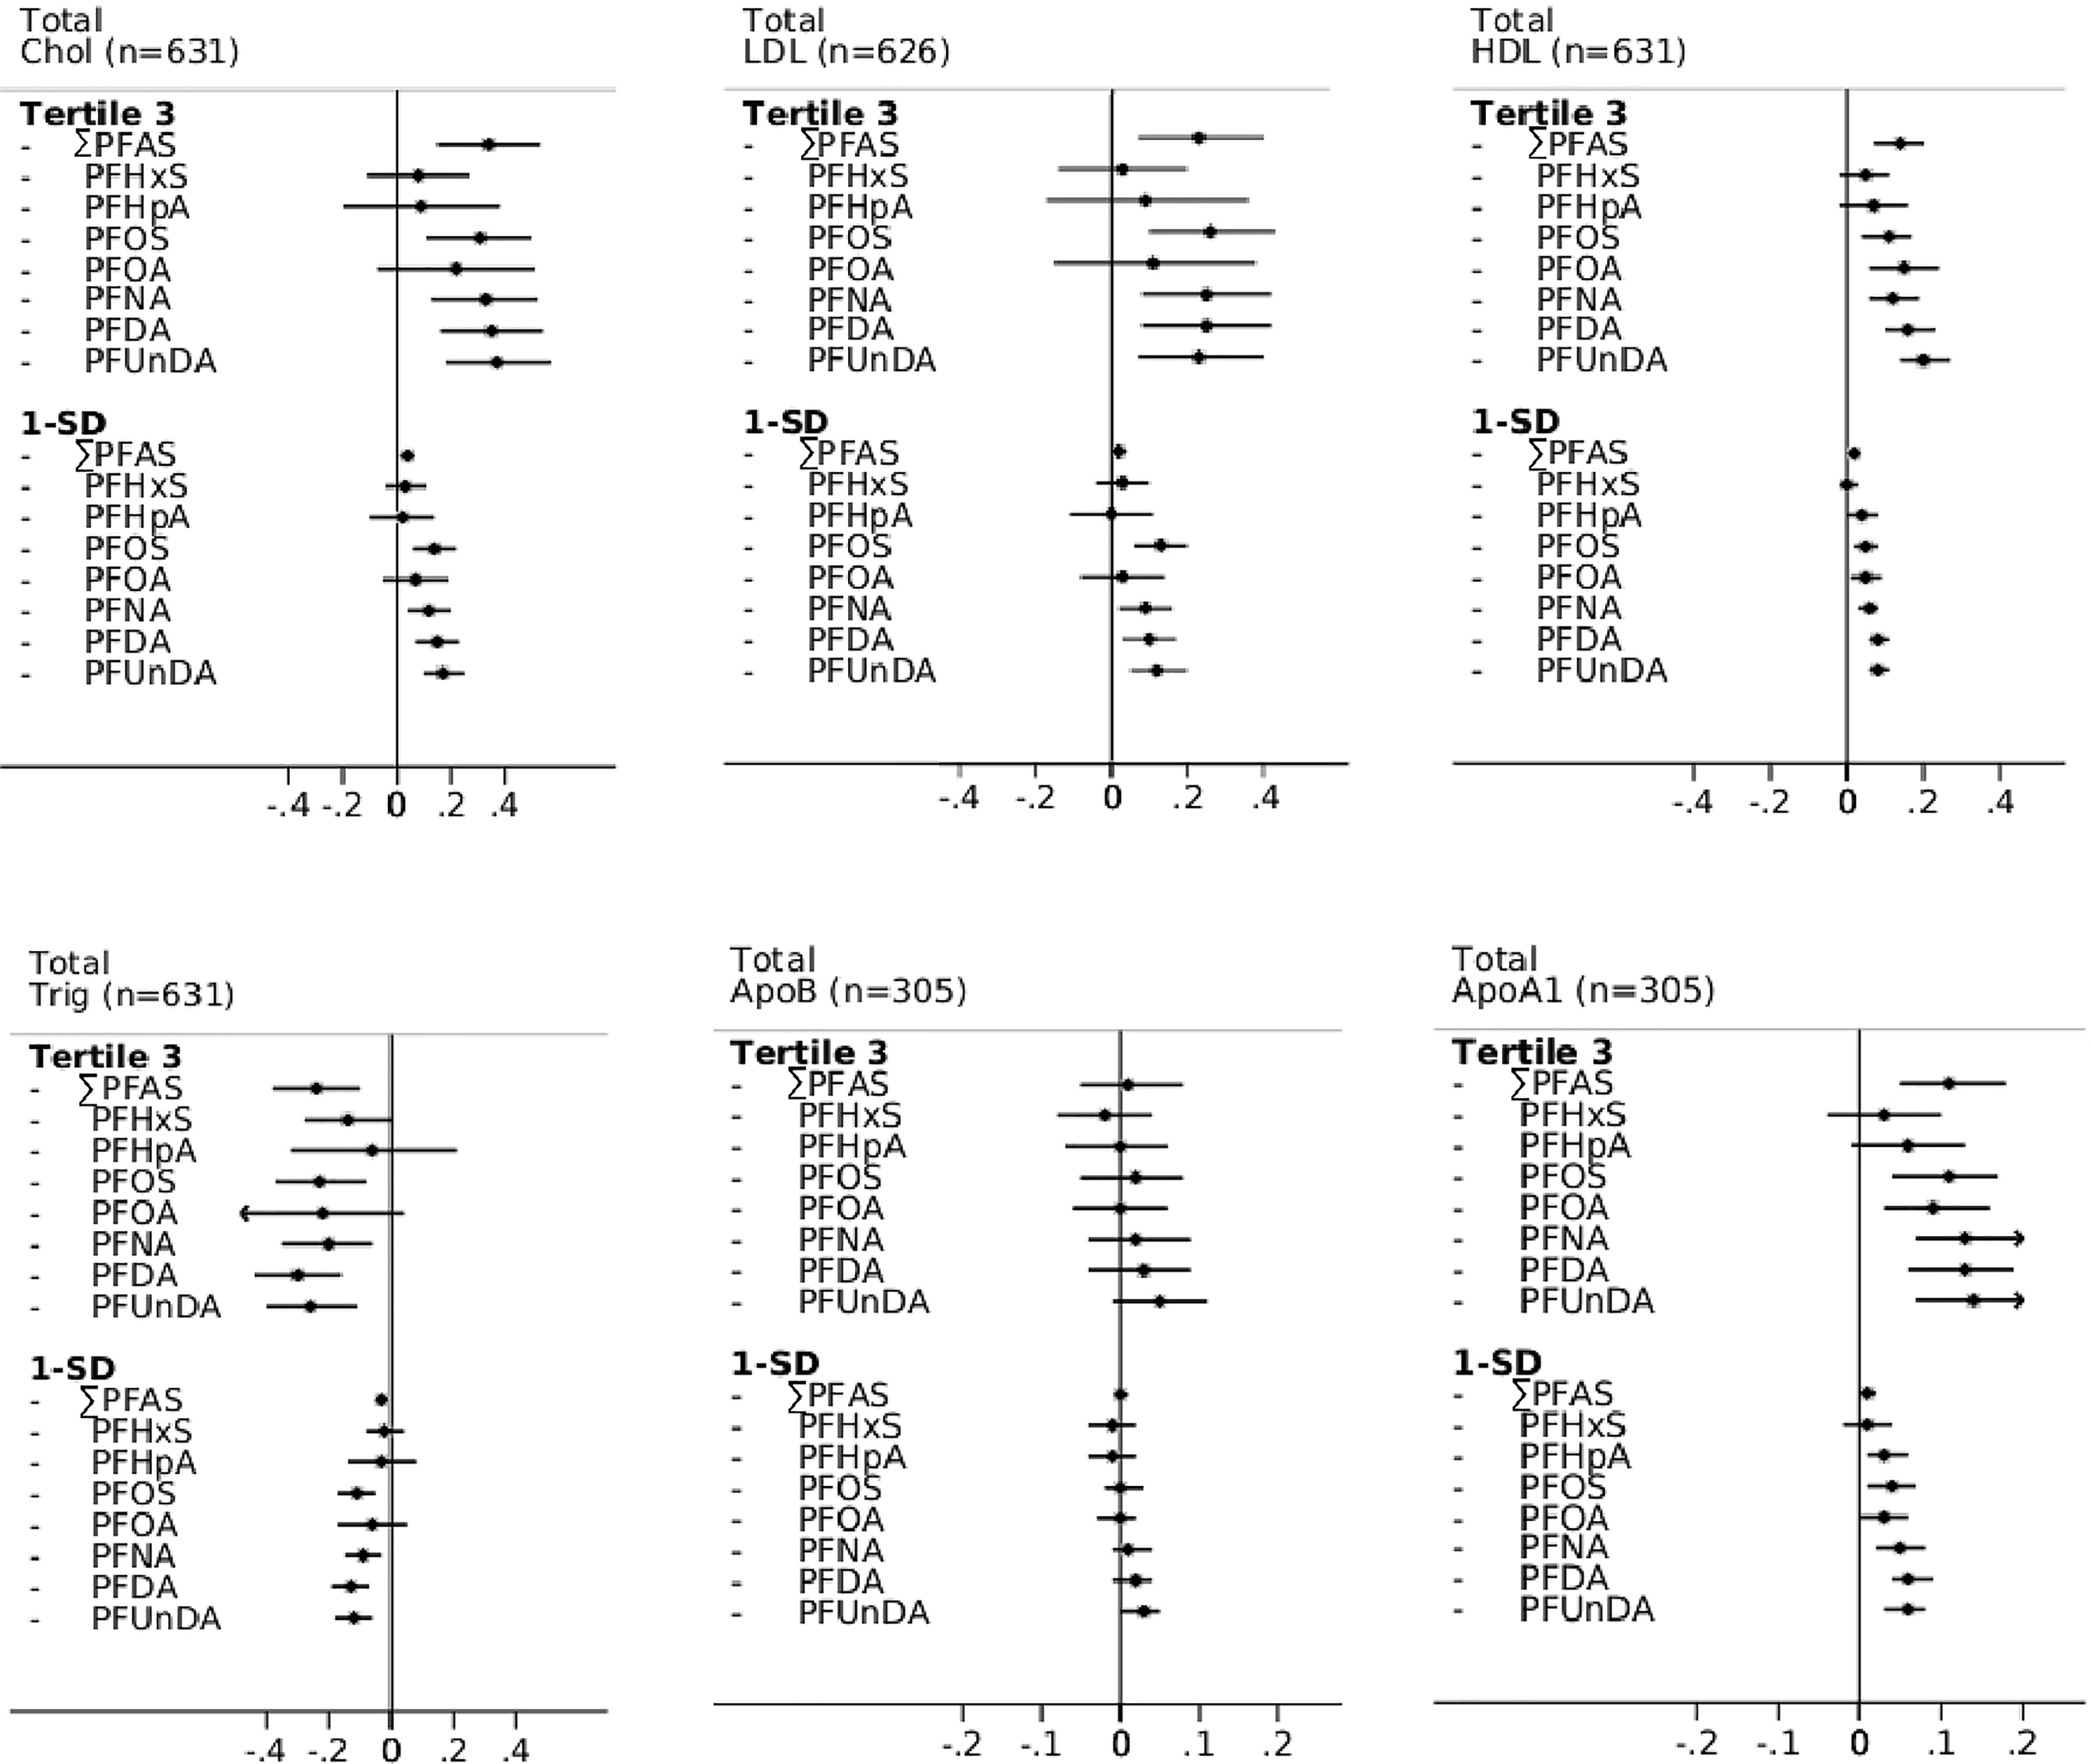
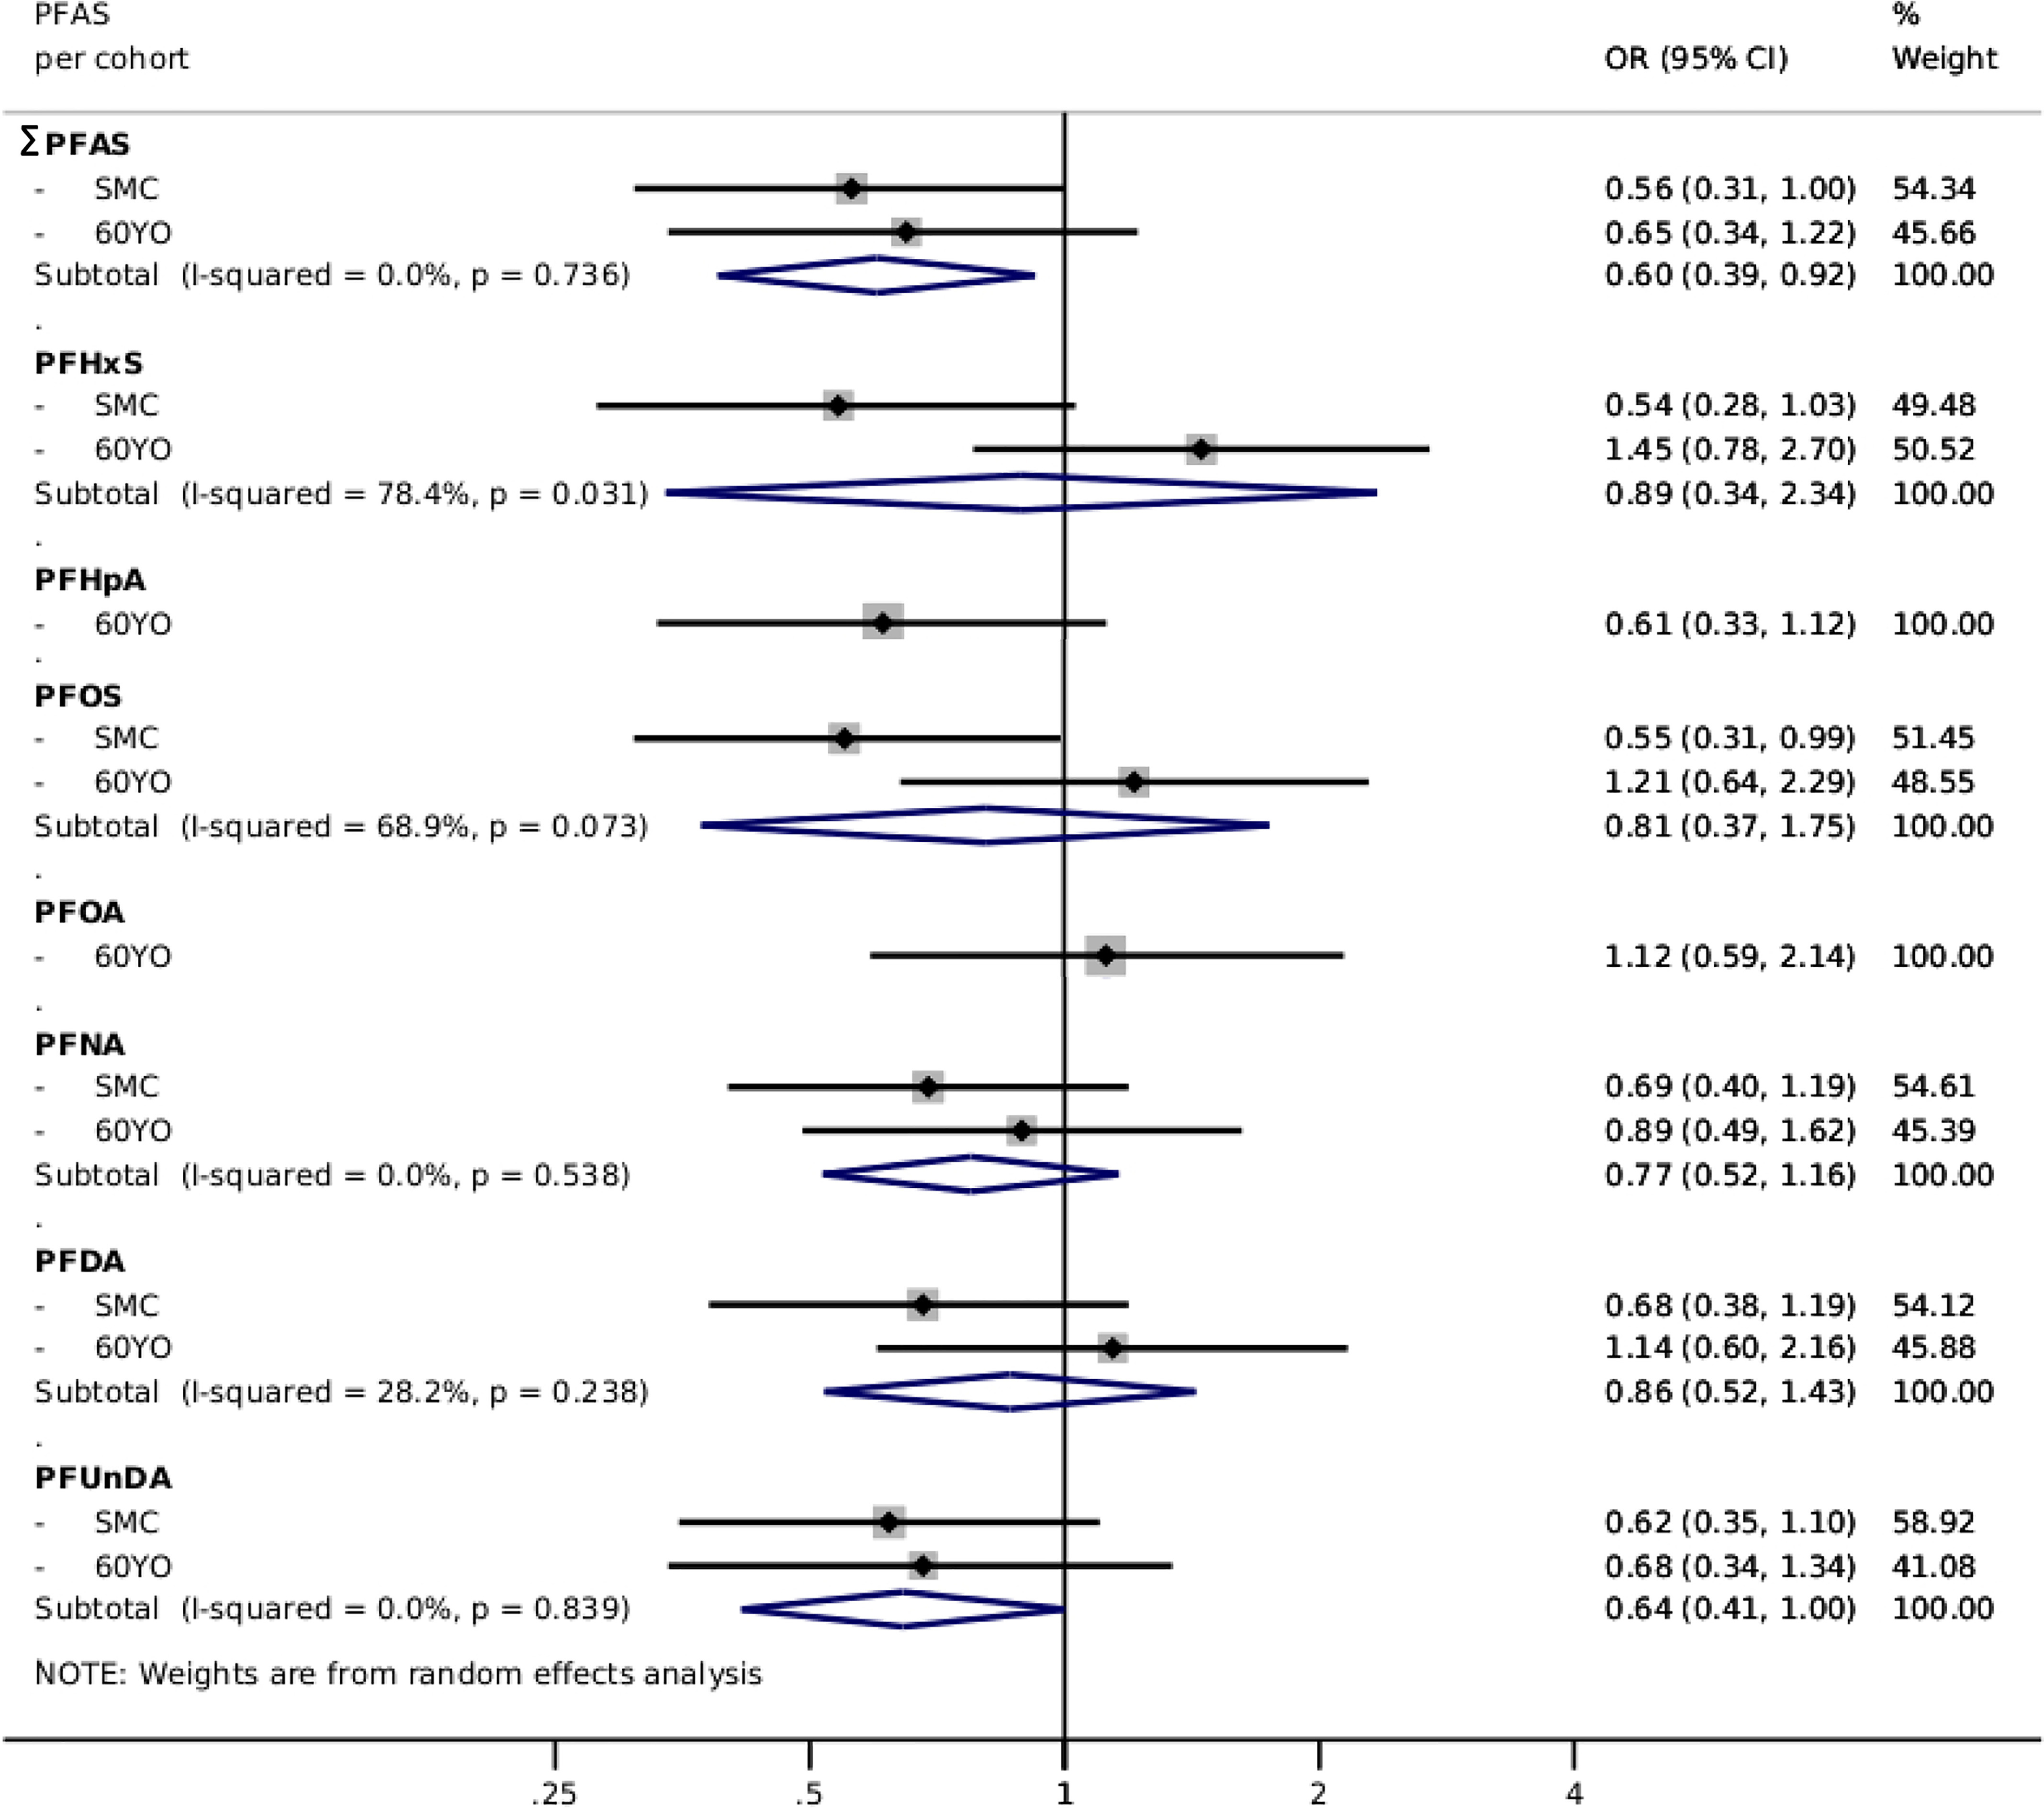
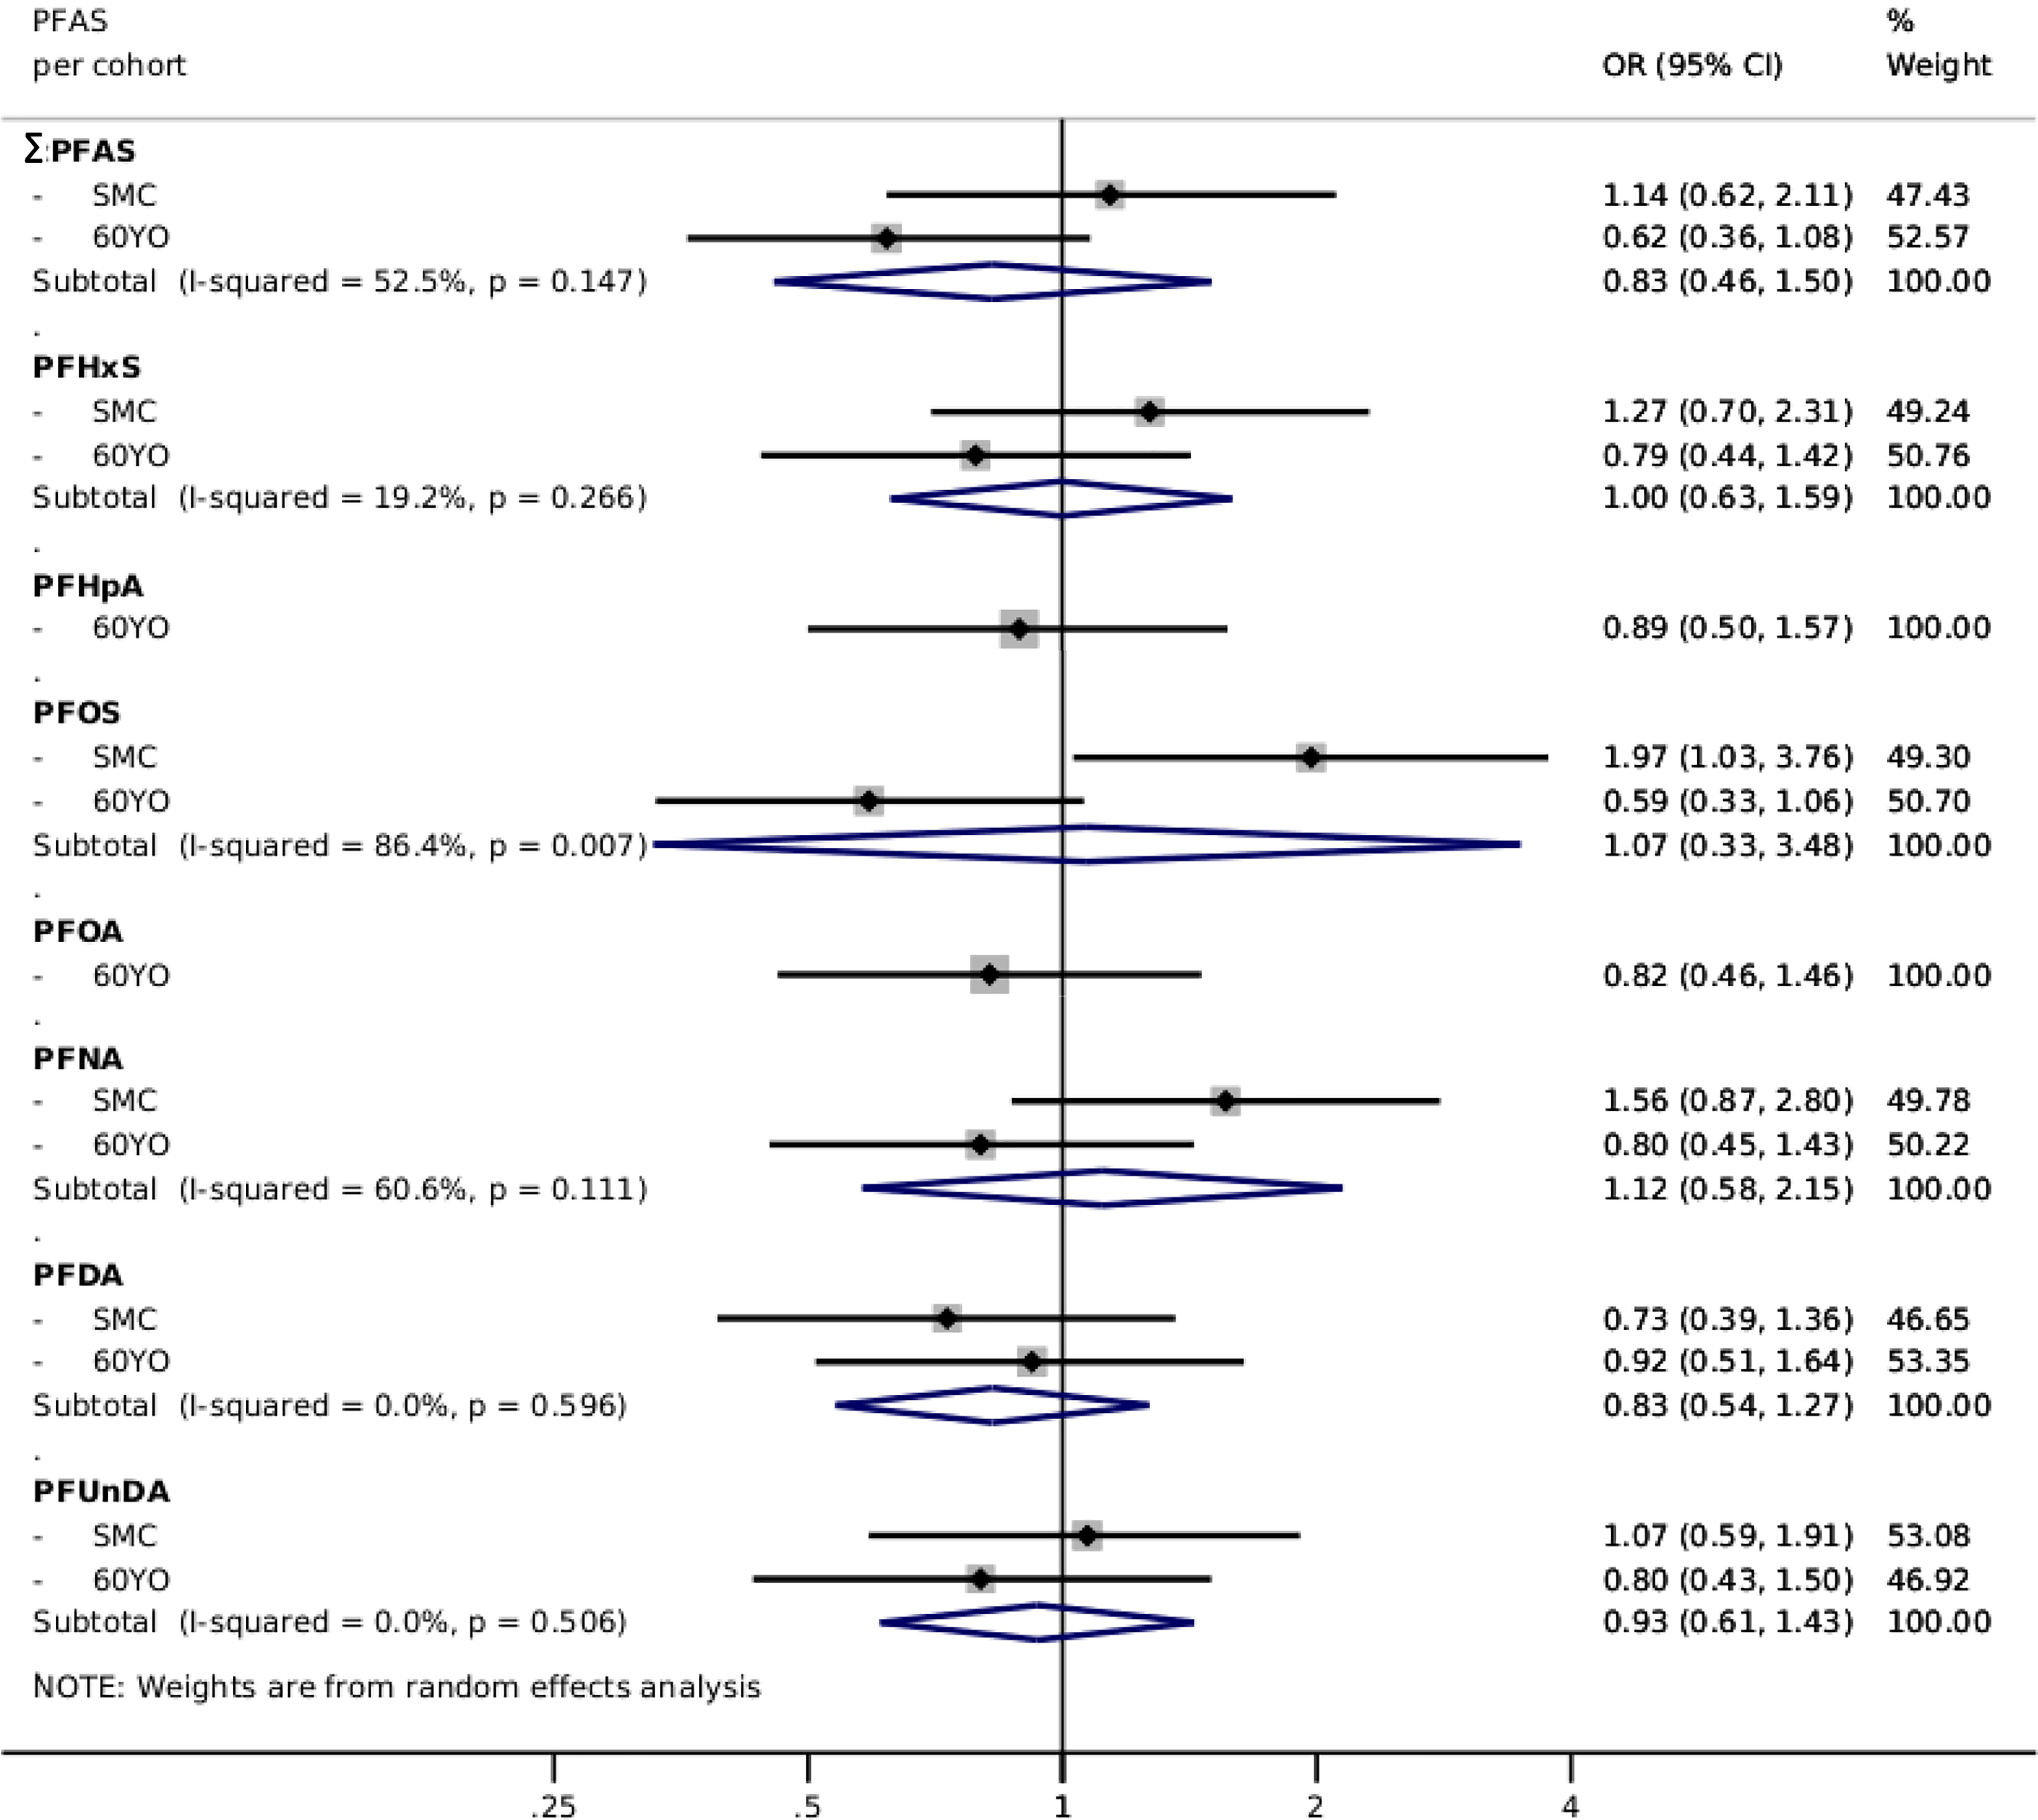
Results: Among the 1,528 case-control subjects, the mean (standard deviation) age was 66 (7.7) y and 67% of them were women. In multivariable-adjusted analyses, the third tertile of the standardized sum of five PFAS associated with higher cholesterol and lower triglyceride levels among controls at baseline (n=631). The corresponding results were odds ratios=0.70 [95% confidence interval (CI): 0.53, 0.93] for CVD, 0.60 (95% CI: 0.39, 0.92) for myocardial infarction, and 0.83 (95% CI: 0.46, 1.50) for stroke.

Discussion: This study indicated that exposure to PFAS, although associated with increased cholesterol levels, did not associate with an increased risk of myocardial infarction, stroke, or their composite end point. The findings improve our knowledge on potential health effects of environmental contaminants in the CVD context. https://doi.org/10.1289/EHP9791.


Figures

Figure 1 is a flowchart having five steps. Step 1: There are 5,022 cases of Swedish Mammography Cohort-Clinical cohort and 4,232 cases of 60 year-olds. Step 2: Cardiovascular disease: 306 cases and 436 controls under Swedish Mammography Cohort-Clinical cohort, and 393 cases and 393 controls under 60 years-old. There is a total 699 cases and 829 controls. Step 3: Myocardial Infarction: 134 cases and 264 controls under Swedish Mammography Cohort-Clinical cohort, and 211 cases and 211 controls under 60 years-old. There is a total 345 cases and 475 controls. Step 4: Stroke: 172 cases and 172 controls under Swedish Mammography Cohort-Clinical cohort, and 182 cases and 182 controls under 60 years-old. There is a total 354 cases and 354 controls. Step 5: Lipids: 326 controls under Swedish Mammography Cohort-Clinical cohort, and 305 controls under 60 years-old. There is a total 631 controls.
Figure 1.
Flow chart of the prospective nested case–control design and the cross-sectional assessment of lipids using two pooled Swedish cohorts, SMC-C and 60YO. For MI in the SMC-C, there is a 1:1 match in four cases, due to missing missing/broken samples. For lipid analyses, controls without a matched case (due to missing/broken samples) that were excluded from the CVD/MI/stroke analyses were included in the lipid analyses, whereas controls used in both MI and stroke data sets were used only once. Controls on lipid-lowering medication at baseline and missing lipid concentrations were excluded (n=5 additional for LDL analyses). Note: 60YO, Cohort of 60-year-olds; CVD, cardiovascular disease; LDL, low-density lipoprotein; MI, myocardial infarction; SMC-C, Swedish Mammography Cohort-Clinical cohort.
Figure 2 is a set of six error bar graphs titled total cholesterol, total low-density lipoprotein, total high-density lipoprotein, total triglycerides, total Apolipoprotein B, and total Apolipoprotein A1, plotting 1 standard deviation (bottom to top), including perfluoroundecanoic acid, perfluorodecanoic acid, perfluorononanoic acid, perfluorooctanoic acid, perfluorooctane sulfonate, perfluoroheptanoic acid, perfluorohexane sulfonic acid, summed per- and polyfluoroalkyl substances and Tertile 3 (bottom to top), including perfluoroundecanoic acid, perfluorodecanoic acid, perfluorononanoic acid, perfluorooctanoic acid, perfluorooctane sulfonate, perfluoroheptanoic acid, perfluorohexane sulfonic acid, summed per- and polyfluoroalkyl substances (y-axis) across Adjusted lowercase beta coefficients (95 percent Confidence intervals), ranging from negative 0.4 to 0.4 in increments of 0.2; negative 0.4 to 0.4 in increments of 0.2; negative 0.4 to 0.4 in increments of 0.2; negative 0.4 to 0.4 in increments of 0.2; negative 0.2 to 0.2 in increments of 0.1; and negative 0.2 to 0.2 in increments of 0.1 (x-axis), respectively.
Figure 2.
Multivariable-adjusted cross-sectional associations in controls between baseline PFAS plasma concentrations and total cholesterol, LDL, HDL, triglycerides, apoB, and apoA1 of two Swedish pooled cohorts (SMC-C baseline: 2003–2009 and 60YO baseline: 1997–1999), estimated using linear mixed effects models—apoB, apoA1, PFHpA, and PFOA results are from the 60YO cohort alone. Adjusted β-coefficients (95% CIs) are presented according to PFAS tertiles (using Tertile 1 as reference), as well as by 1-SD increment in natural log-transformed plasma PFAS concentrations (ng/mL). Models were adjusted for age, sex, sampling date, education, BMI, diabetes, hypertension, family history of CVD, smoking habits, physical activity, and healthy diet score. Individual PFAS were standardized (rescaled with mean=0 and SD=1) and summed (ΣPFAS). Note: 60YO, Cohort of 60-year-olds; BMI, body mass index; apo, apolipoprotein; Chol, cholesterol; CI, confidence interval; CVD, cardiovascular disease; HDL, high-density lipoprotein; LDL, low-density lipoprotein; PFDA, perfluorodecanoic acid; PFAS, per- and polyfluoroalkyl substances; PFHpA, perfluoroheptanoic acid; PFHxS, perfluorohexane sulfonic acid; PFNA, perfluorononanoic acid; PFOA, perfluorooctanoic acid; PFOS, perfluorooctane sulfonate; PFUnDA, perfluoroundecanoic acid; SD, standard deviation; SMC-C, Swedish Mammography Cohort-Clinical cohort; Trig, triglycerides.
Figure 3 is a forest plot, plotting per- and polyfluoroalkyl substances per cohort (bottom to top), including perfluoroundecanoic acid: Swedish Mammography Cohort-Clinical cohort, 60 years-old, and subtotal (uppercase i squared equals 0.0 percent, lowercase p equals 0.839); perfluorodecanoic acid: Swedish Mammography Cohort-Clinical cohort, 60 years-old, and subtotal (uppercase i squared equals 28.2 percent, lowercase p equals 0.238); perfluorononanoic acid: Swedish Mammography Cohort-Clinical cohort, 60 years-old, and subtotal (uppercase i squared equals 0.0 percent, lowercase p equals 0.538); perfluorooctanoic acid: 60 years-old; perfluorooctane sulfonate: Swedish Mammography Cohort-Clinical cohort, 60 years-old, and subtotal (uppercase i squared equals 68.9 percent, lowercase p equals 0.073); perfluoroheptanoic acid: 60 years-old; perfluorohexane sulfonic acid: Swedish Mammography Cohort-Clinical cohort, 60 years-old, and subtotal (uppercase i squared equals 78.4 percent, lowercase p equals 0.031); and summed per- and polyfluoroalkyl substances: Swedish Mammography Cohort-Clinical cohort, 60 years-old, and subtotal (uppercase i squared equals 0.0 percent, lowercase p equals 0.736) (y-axis) across random effects meta-analysis, ranging from 0.25 to 0.5 in increments of 0.25, 0.5 to 1 in increments of 0.5, 1 to 2 in unit increments, and 2 to 4 in increments of 2 (x-axis) for odds ratio (95 percent confidence intervals) and percentage of weight.
Figure 3.
Multivariable-adjusted risk of myocardial infarction, presented as pooled ORs (95% CIs) from two Swedish cohorts (SMC-C: n=398 and 60YO: n=422) using random effects meta-analysis, comparing the third tertile of each PFAS with the first tertile—PFHpA and PFOA results are from the 60YO cohort alone. Estimations adjusted according to Model 2: sex, age, sampling date, education, BMI, diabetes, hypertension, family history of CVD, smoking habits, physical activity, and healthy diet score. Individual PFAS were standardized (rescaled with mean=0 and SD=1) and summed (ΣPFAS). Note: 60YO, Cohort of 60-year-olds; BMI, body mass index; CI, confidence interval; CVD, cardiovascular disease; OR, odds ratio; PFAS, per- and polyfluoroalkyl substances; PFDA, perfluorodecanoic acid; PFHpA, perfluoroheptanoic acid; PFHxS, perfluorohexane sulfonic acid; PFNA, perfluorononanoic acid; PFOA, perfluorooctanoic acid; PFOS, perfluorooctane sulfonate; PFUnDA, perfluoroundecanoic acid; SD, standard deviation; SMC-C, Swedish Mammography Cohort-Clinical cohort.
Figure 4 is a forest plot, plotting per- and polyfluoroalkyl substances per cohort (bottom to top), including perfluoroundecanoic acid: Swedish Mammography Cohort-Clinical cohort, 60 years-old, and subtotal (uppercase i squared equals 0.0 percent, lowercase p equals 0.506); perfluorodecanoic acid: Swedish Mammography Cohort-Clinical cohort, 60 years-old, and subtotal (uppercase i squared equals 0.0 percent, lowercase p equals 0.596); perfluorononanoic acid: Swedish Mammography Cohort-Clinical cohort, 60 years-old, and subtotal (uppercase i squared equals 60.6 percent, lowercase p equals 0.111); perfluorooctanoic acid: 60 years-old; perfluorooctane sulfonate: Swedish Mammography Cohort-Clinical cohort, 60 years-old, and subtotal (uppercase i squared equals 86.4 percent, lowercase p equals 0.007); perfluoroheptanoic acid: 60 years-old; perfluorohexane sulfonic acid: Swedish Mammography Cohort-Clinical cohort, 60 years-old, and subtotal (uppercase i squared equals 19.2 percent, lowercase p equals 0.266); and summed per- and polyfluoroalkyl substances: Swedish Mammography Cohort-Clinical cohort, 60 years-old, and subtotal (uppercase i squared equals 52.5 percent, lowercase p equals 0.147) (y-axis) across random effects meta-analysis, ranging from 0.25 to 0.5 in increments of 0.25, 0.5 to 1 in increments of 0.5, 1 to 2 in unit increments, and 2 to 4 in increments of 2 (x-axis) for odds ratio (95 percent confidence intervals) and percentage of weight.
Figure 4.
Multivariable-adjusted risk of stroke, presented as pooled ORs (95% CIs) from two Swedish cohorts (SMC-C: n=344 and 60YO: n=364) using random effects meta-analysis, comparing the third tertile of each PFAS with the first tertile—PFHpA and PFOA results are from the 60YO cohort alone. Estimations adjusted according to Model 2: sex, age, sampling date, education, BMI, diabetes, hypertension, family history of CVD, smoking habits, physical activity, and healthy diet score. Individual PFAS were standardized (rescaled with mean=0 and SD=1) and summed (ΣPFAS). Note: 60YO, Cohort of 60-year-olds; BMI, body mass index; CI, confidence interval; CVD, cardiovascular disease; OR, odds ratio; PFAS, per- and polyfluoroalkyl substances; PFDA, perfluorodecanoic acid; PFHpA, perfluoroheptanoic acid; PFHxS, perfluorohexane sulfonic acid; PFNA, perfluorononanoic acid; PFOA, perfluorooctanoic acid; PFOS, perfluorooctane sulfonate; PFUnDA, perfluoroundecanoic acid; SD, standard deviation; SMC-C, Swedish Mammography Cohort-Clinical cohort.

Similar articles

Cited by

References

    1. Abe T, Takahashi M, Kano M, Amaike Y, Ishii C, Maeda K, et al. . 2017. Activation of nuclear receptor CAR by an environmental pollutant perfluorooctanoic acid. Arch Toxicol 91(6):2365–2374, PMID: , 10.1007/s00204-016-1888-3. - DOI - PubMed
    1. Alhassan A, Young J, Lean MEJ, Lara J. 2017. Consumption of fish and vascular risk factors: a systematic review and meta-analysis of intervention studies. Atherosclerosis 266:87–94, PMID: , 10.1016/j.atherosclerosis.2017.09.028. - DOI - PubMed
    1. ATSDR (Agency for Toxic Substances and Disease Registry). 2021. Toxicological profile for perfluoroalkyls. Atlanta, GA: ATSDR. https://www.atsdr.cdc.gov/ToxProfiles/tp200.pdf [accessed 10 March 2022]. - PubMed
    1. Bagley BD, Chang SC, Ehresman DJ, Eveland A, Zitzow JD, Parker GA, et al. . 2017. Perfluorooctane sulfonate-induced hepatic steatosis in male Sprague Dawley rats is not attenuated by dietary choline supplementation. Toxicol Sci 160(2):284–298, PMID: , 10.1093/toxsci/kfx185. - DOI - PubMed
    1. Behr AC, Kwiatkowski A, Ståhlman M, Schmidt FF, Luckert C, Braeuning A, et al. . 2020. Impairment of bile acid metabolism by perfluorooctanoic acid (PFOA) and perfluorooctanesulfonic acid (PFOS) in human HepaRG hepatoma cells. Arch Toxicol 94(5):1673–1686, PMID: , 10.1007/s00204-020-02732-3. - DOI - PMC - PubMed

Publication types