Five-Year Trends in US Children's Health and Well-being, 2016-2020
- PMID: 35285883
- PMCID: PMC8922203
- DOI: 10.1001/jamapediatrics.2022.0056
Five-Year Trends in US Children's Health and Well-being, 2016-2020
Erratum in
-
Change to Open Access Status.JAMA Pediatr. 2022 Jul 1;176(7):729. doi: 10.1001/jamapediatrics.2022.0858. JAMA Pediatr. 2022. PMID: 35377400 Free PMC article. No abstract available.
-
Coding Error and Errors in Estimates.JAMA Pediatr. 2023 Mar 1;177(3):323. doi: 10.1001/jamapediatrics.2022.5657. JAMA Pediatr. 2023. PMID: 36622657 Free PMC article. No abstract available.
Abstract
Importance: Ensuring the well-being of the 73 million children in the United States is critical for improving the nation's health and influencing children's long-term outcomes as they grow into adults.
Objective: To examine recent trends in children's health-related measures, including significant changes between 2019 and 2020 that might be attributed to the COVID-19 pandemic.
Design, setting, and participants: Annual data were examined from the National Survey of Children's Health (2016-2020), a population-based, nationally representative survey of randomly selected children. Participants were children from birth to age 17 years living in noninstitution settings in all 50 states and the District of Columbia whose parent or caregiver responded to an address-based survey by mail or web. Weighted prevalence estimates account for probability of selection and nonresponse. Adjusted logistic regression models tested for significant trends over time.
Main outcomes and measures: Diverse measures pertaining to children's current health conditions, positive health behaviors, health care access and utilization, and family well-being and stressors.
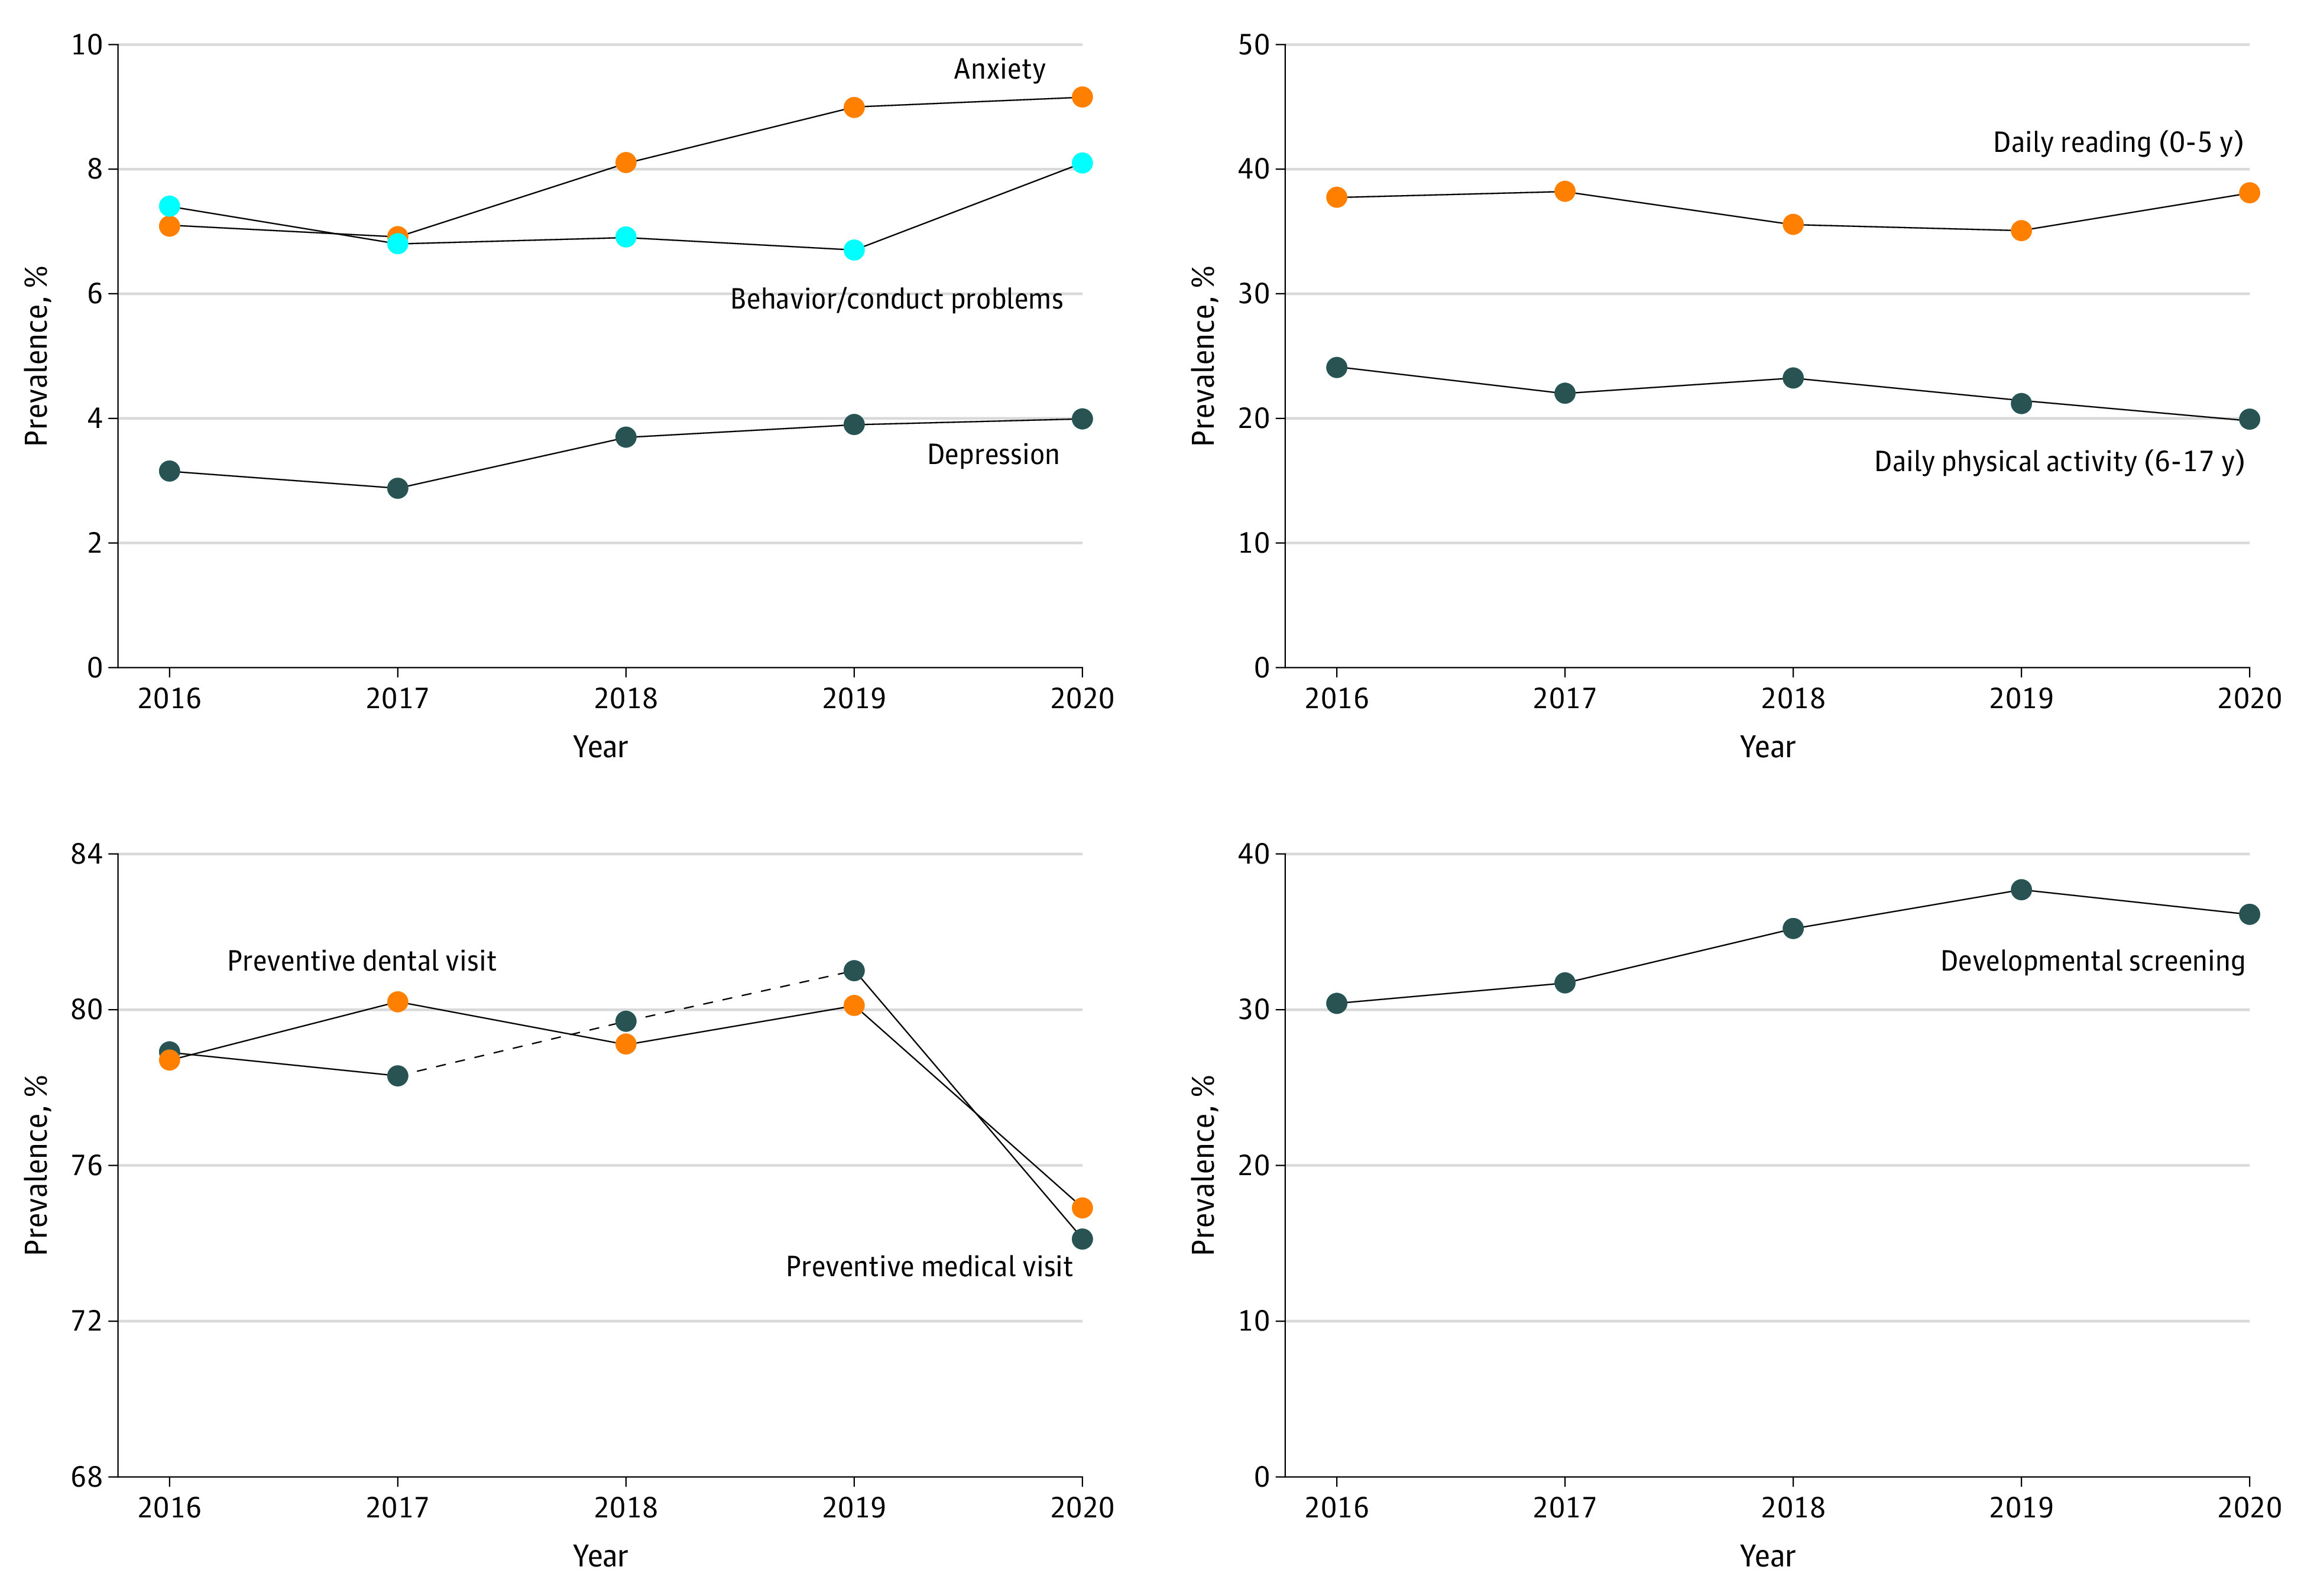
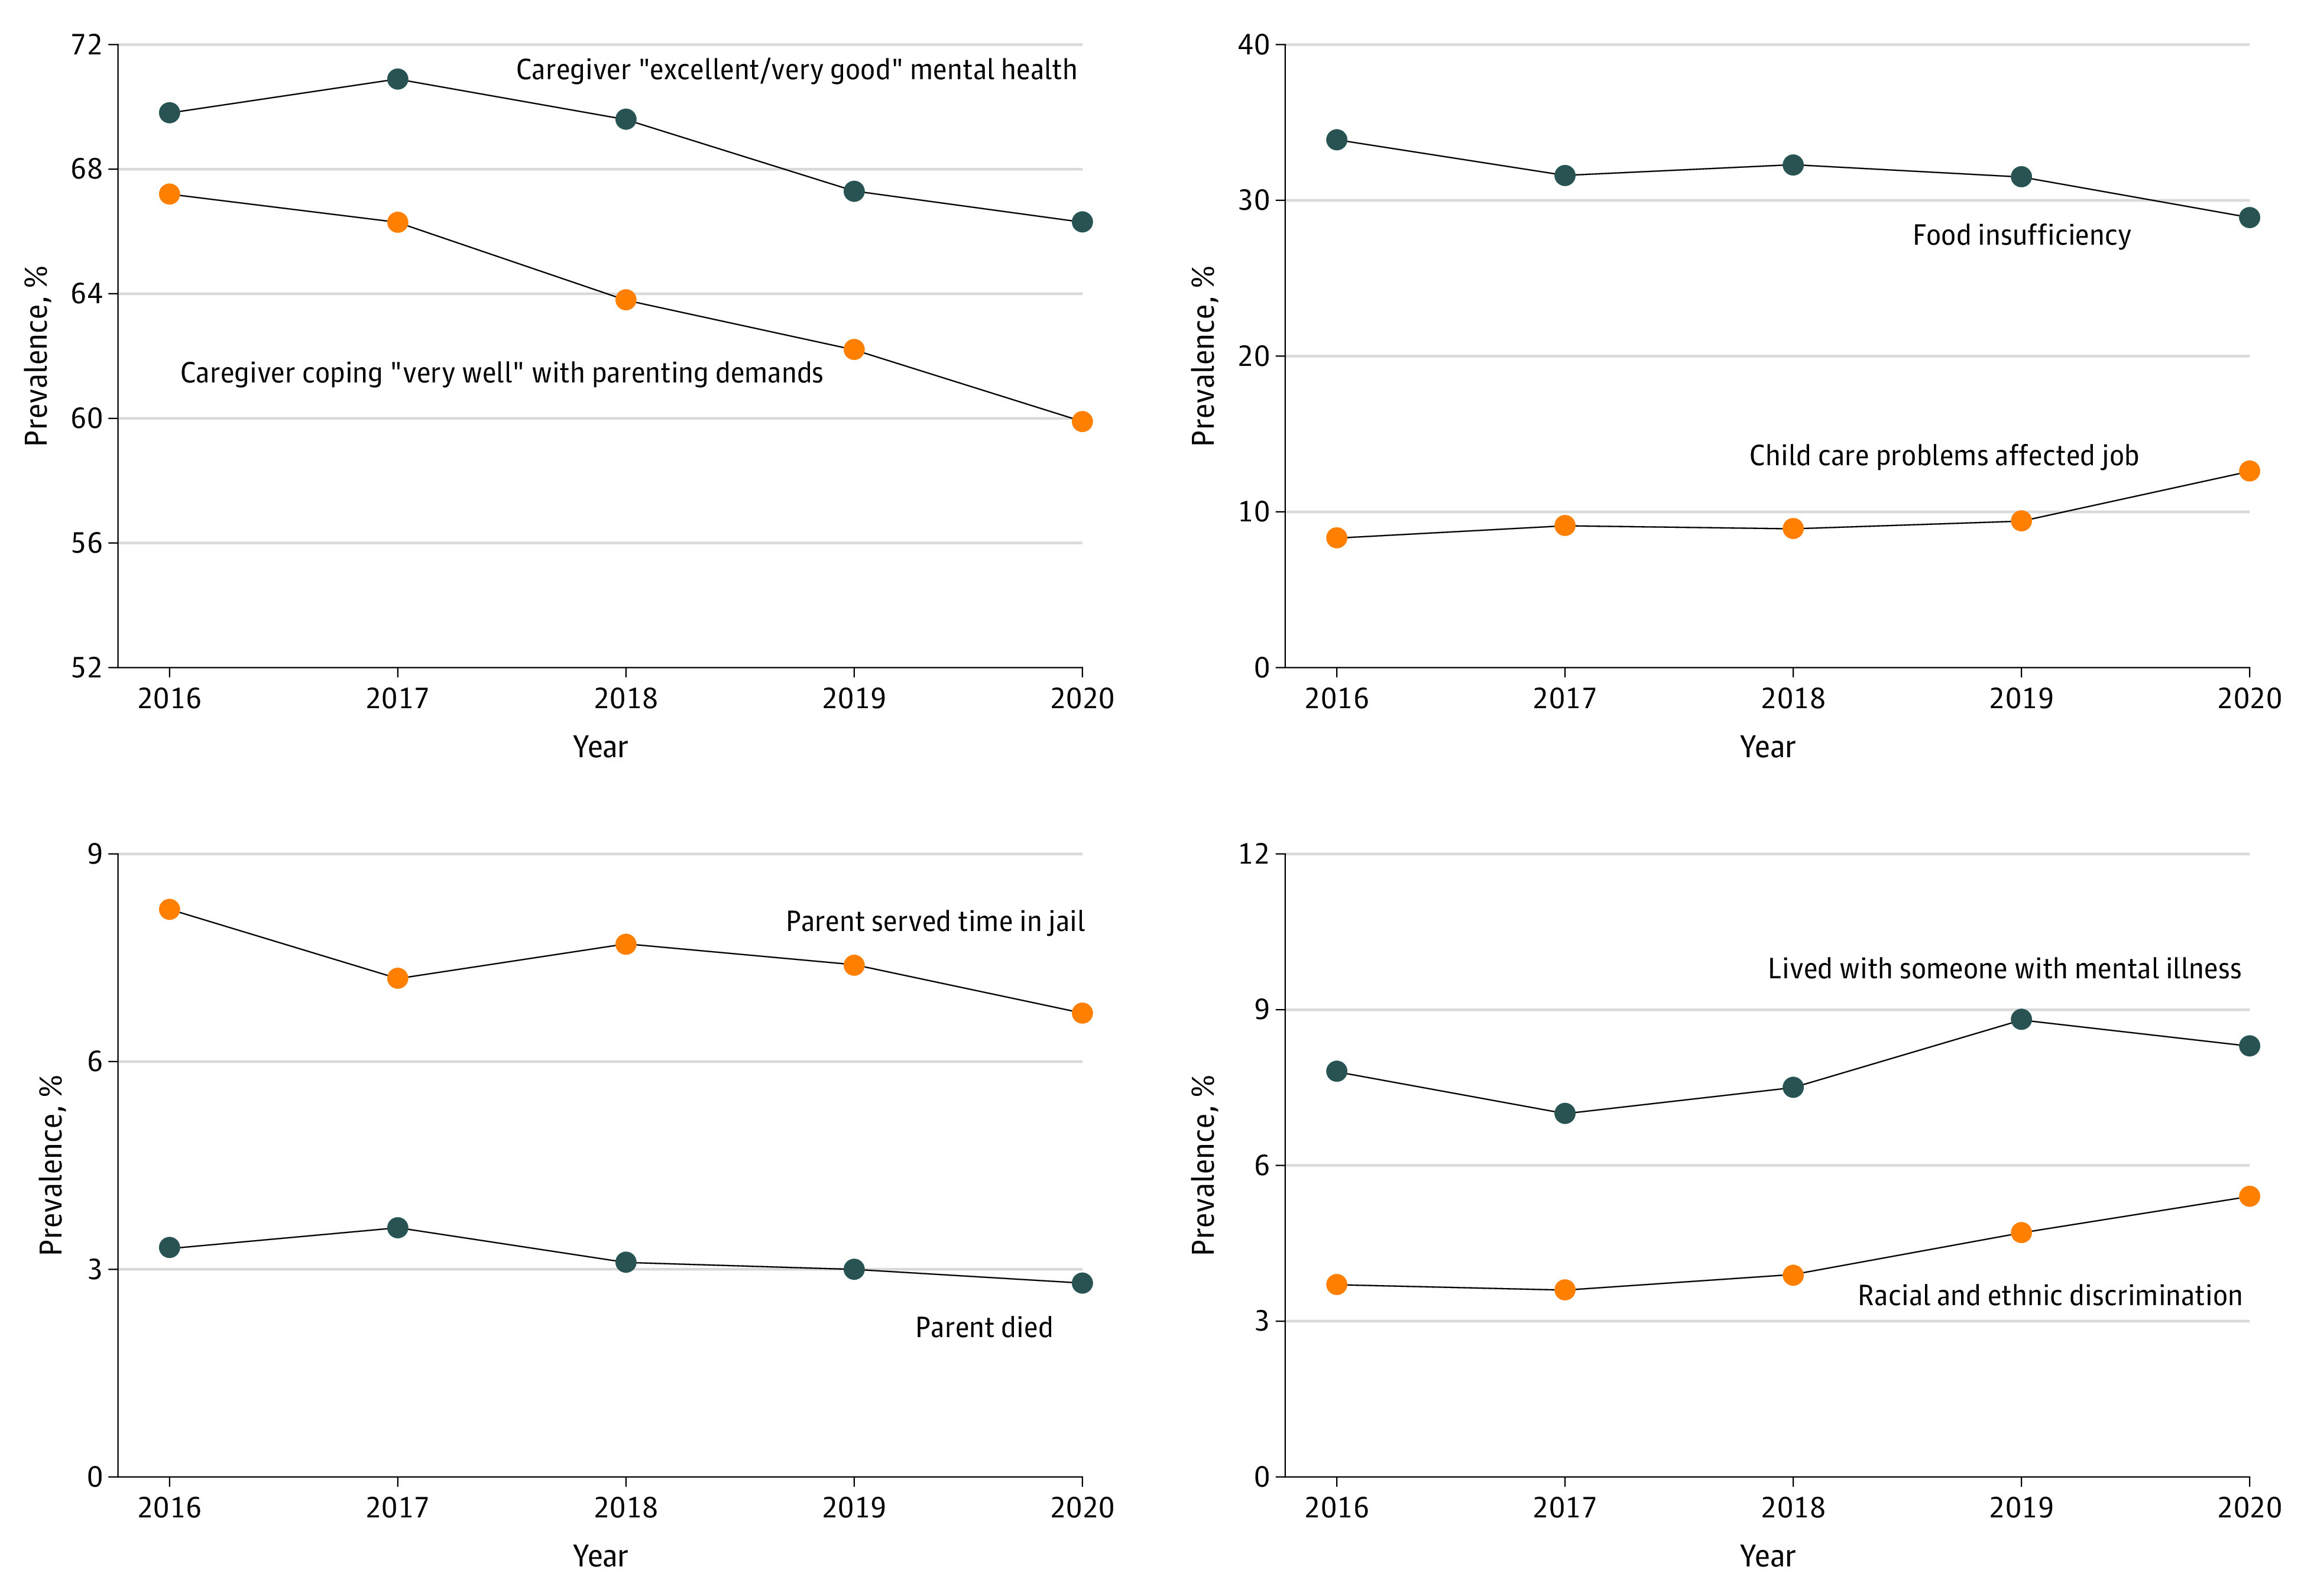
Results: A total of 174 551 children were included (annual range = 21 599 to 50 212). Between 2016 and 2020, there were increases in anxiety (7.1% [95% CI, 6.6-7.6] to 9.2% [95% CI, 8.6-9.8]; +29%; trend P < .001) and depression (3.1% [95% CI, 2.9-3.5] to 4.0% [95% CI, 3.6-4.5]; +27%; trend P < .001). There were also decreases in daily physical activity (24.2% [95% CI, 23.1-25.3] to 19.8% [95% CI, 18.9-20.8]; -18%; trend P < .001), parent or caregiver mental health (69.8% [95% CI, 68.9-70.8] to 66.3% [95% CI, 65.3-67.3]; -5%; trend P < .001), and coping with parenting demands (67.2% [95% CI, 66.3-68.1] to 59.9% [95% CI, 58.8-60.9]; -11%; trend P < .001). In addition, from 2019 to 2020, there were increases in behavior or conduct problems (6.7% [95% CI, 6.1-7.4] to 8.1% [95% CI, 7.5-8.8]; +21%; P = .001) and child care disruptions affecting parental employment (9.4% [95% CI, 8.0-10.9] to 12.6% [95% CI, 11.2-14.1]; +34%; trend P = .001) as well as decreases in preventive medical visits (81.0% [95% CI, 79.7-82.3] to 74.1% [95% CI, 72.9-75.3]; -9%; trend P < .001).
Conclusions and relevance: Recent trends point to several areas of concern that can inform future research, clinical care, policy decision making, and programmatic investments to improve the health and well-being of children and their families. More analyses are needed to elucidate varying patterns within subpopulations of interest.
Conflict of interest statement
Figures
Comment in
-
Adversity and Opportunity-The Pandemic's Paradoxical Effect on Child Health and Well-being.JAMA Pediatr. 2022 Jul 1;176(7):e220063. doi: 10.1001/jamapediatrics.2022.0063. Epub 2022 Jul 5. JAMA Pediatr. 2022. PMID: 35285893 No abstract available.
References
-
- The Annie E. Casey Foundation . Total population by child and adult populations in the United States. Kids Count Data Center. 2020. https://datacenter.kidscount.org/
-
- Health Resources and Services Administration, Maternal and Child Health Bureau . Children with special health care needs: NSCH data brief, July 2020. https://mchb.hrsa.gov/sites/default/files/mchb/programs-impact/nsch-cshc...