Effects of State Opioid Prescribing Laws on Use of Opioid and Other Pain Treatments Among Commercially Insured U.S. Adults
- PMID: 35286141
- PMCID: PMC9277518
- DOI: 10.7326/M21-4363
Effects of State Opioid Prescribing Laws on Use of Opioid and Other Pain Treatments Among Commercially Insured U.S. Adults
Erratum in
-
Correction: Effects of State Opioid Prescribing Laws on Use of Opioid and Other Pain Treatments Among Commercially Insured U.S. Adults.Ann Intern Med. 2022 Sep;175(9):1342. doi: 10.7326/L22-0250. Epub 2022 Jun 14. Ann Intern Med. 2022. PMID: 35696693 No abstract available.
Abstract
Background: There is concern that state laws to curb opioid prescribing may adversely affect patients with chronic noncancer pain, but the laws' effects are unclear because of challenges in disentangling multiple laws implemented around the same time.
Objective: To study the association between state opioid prescribing cap laws, pill mill laws, and mandatory prescription drug monitoring program query or enrollment laws and trends in opioid and guideline-concordant nonopioid pain treatment among commercially insured adults, including a subgroup with chronic noncancer pain conditions.
Design: Thirteen treatment states that implemented a single law of interest in a 4-year period and unique groups of control states for each treatment state were identified. Augmented synthetic control analyses were used to estimate the association between each state law and outcomes.
Setting: United States, 2008 to 2019.
Patients: 7 694 514 commercially insured adults aged 18 years or older, including 1 976 355 diagnosed with arthritis, low back pain, headache, fibromyalgia, and/or neuropathic pain.
Measurements: Proportion of patients receiving any opioid prescription or guideline-concordant nonopioid pain treatment per month, and mean days' supply and morphine milligram equivalents (MME) of prescribed opioids per day, per patient, per month.
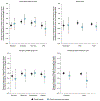
Results: Laws were associated with small-in-magnitude and non-statistically significant changes in outcomes, although CIs around some estimates were wide. For adults overall and those with chronic noncancer pain, the 13 state laws were each associated with a change of less than 1 percentage point in the proportion of patients receiving any opioid prescription and a change of less than 2 percentage points in the proportion receiving any guideline-concordant nonopioid treatment, per month. The laws were associated with a change of less than 1 in days' supply of opioid prescriptions and a change of less than 4 in average monthly MME per day per patient prescribed opioids.
Limitations: Results may not be generalizable to non-commercially insured populations and were imprecise for some estimates. Use of claims data precluded assessment of the clinical appropriateness of pain treatments.
Conclusion: This study did not identify changes in opioid prescribing or nonopioid pain treatment attributable to state laws.
Primary funding source: National Institute on Drug Abuse.
Figures


Comment in
-
Effects of State Opioid Prescribing Laws on Use of Opioid and Other Pain Treatments Among Commercially Insured U.S. Adults.Ann Intern Med. 2022 Oct;175(10):W118. doi: 10.7326/L22-0247. Ann Intern Med. 2022. PMID: 36252257 No abstract available.
Similar articles
-
Effects of U.S. State Medical Cannabis Laws on Treatment of Chronic Noncancer Pain.Ann Intern Med. 2023 Jul;176(7):904-912. doi: 10.7326/M23-0053. Epub 2023 Jul 4. Ann Intern Med. 2023. PMID: 37399549 Free PMC article.
-
Protocol: mixed-methods study to evaluate implementation, enforcement, and outcomes of U.S. state laws intended to curb high-risk opioid prescribing.Implement Sci. 2018 Feb 26;13(1):37. doi: 10.1186/s13012-018-0719-8. Implement Sci. 2018. PMID: 29482599 Free PMC article.
-
Changes in Initial Opioid Prescribing Practices After the 2016 Release of the CDC Guideline for Prescribing Opioids for Chronic Pain.JAMA Netw Open. 2021 Jul 1;4(7):e2116860. doi: 10.1001/jamanetworkopen.2021.16860. JAMA Netw Open. 2021. PMID: 34255047 Free PMC article.
-
The effect of targeted insurer-mandated prescription monitoring on opioid prescribing patterns.J Am Pharm Assoc (2003). 2020 Jul-Aug;60(4):559-564. doi: 10.1016/j.japh.2019.12.019. Epub 2020 Feb 6. J Am Pharm Assoc (2003). 2020. PMID: 32033899 Review.
-
Exemptions to state laws regulating opioid prescribing for patients with cancer-related pain: A summary.Cancer. 2021 Sep 1;127(17):3137-3144. doi: 10.1002/cncr.33639. Epub 2021 May 27. Cancer. 2021. PMID: 34043811 Free PMC article. Review.
Cited by
-
Firearm injury hospitalizations and handgun purchaser licensing laws: longitudinal evaluation of state-level purchaser licensure requirements on firearm violence, 2000-2016.Inj Epidemiol. 2024 Aug 23;11(1):39. doi: 10.1186/s40621-024-00522-4. Inj Epidemiol. 2024. PMID: 39180063 Free PMC article.
-
A Longitudinal Multivariable Analysis: State Policies and Opioid Dispensing in Medicare Beneficiaries Undergoing Surgery.J Gen Intern Med. 2024 Nov;39(15):2942-2951. doi: 10.1007/s11606-024-08888-3. Epub 2024 Jul 17. J Gen Intern Med. 2024. PMID: 39020230
-
Medicare Opioid Policy and Opioid Use in Beneficiaries With Disabilities.JAMA Intern Med. 2025 Apr 1;185(4):422-430. doi: 10.1001/jamainternmed.2024.7810. JAMA Intern Med. 2025. PMID: 39928325
-
"Cookbook medicine": Exploring the impact of opioid prescribing limits legislation on clinical practice and patient experiences.SSM Qual Res Health. 2023 Jun;3:10.1016/j.ssmqr.2023.100273. doi: 10.1016/j.ssmqr.2023.100273. SSM Qual Res Health. 2023. PMID: 38798786 Free PMC article.
-
Effects of U.S. State Medical Cannabis Laws on Treatment of Chronic Noncancer Pain.Ann Intern Med. 2023 Jul;176(7):904-912. doi: 10.7326/M23-0053. Epub 2023 Jul 4. Ann Intern Med. 2023. PMID: 37399549 Free PMC article.
References
-
- IQVIA Institute for Human Data Science. Prescription Opioid Trends in the United States: Measuring and Understanding Progress in the Opioid Crisis. December 2020. Accessed at www.iqvia.com/-/media/iqvia/pdfs/institute-reports/prescription-opioid-t... on 26 October 2021.
-
- Centers for Disease Control and Prevention. Provisional Drug Overdose Death Counts. Accessed at www.cdc.gov/nchs/nvss/vsrr/drug-overdose-data.htm on 26 October 2021.
Publication types
MeSH terms
Substances
Grants and funding
LinkOut - more resources
Full Text Sources
Medical
Miscellaneous
