. 2022 May 2;34(6):967-987.
doi: 10.1162/jocn_a_01845.

Using High-Density Electroencephalography to Explore Spatiotemporal Representations of Object Categories in Visual Cortex

Affiliations

Using High-Density Electroencephalography to Explore Spatiotemporal Representations of Object Categories in Visual Cortex

Gennadiy Gurariy et al. J Cogn Neurosci. .

Abstract

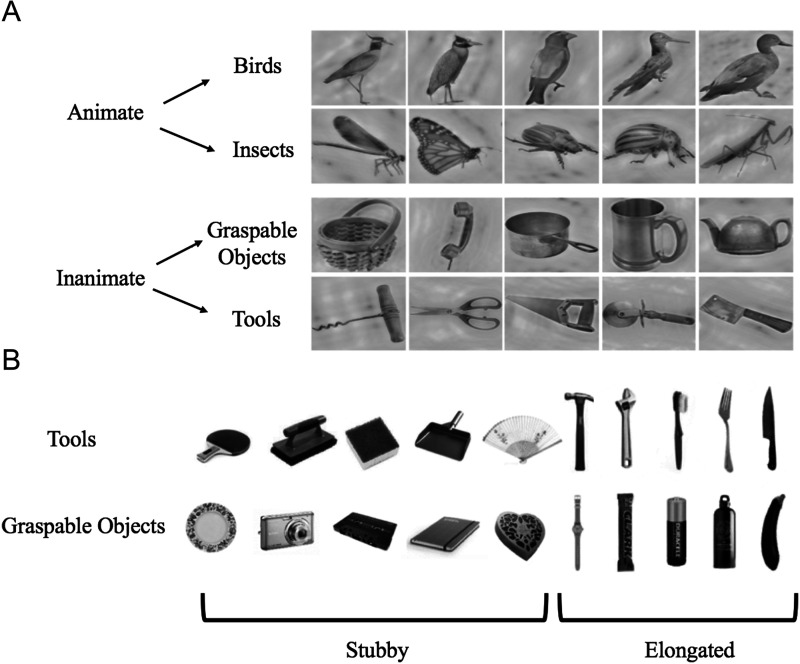
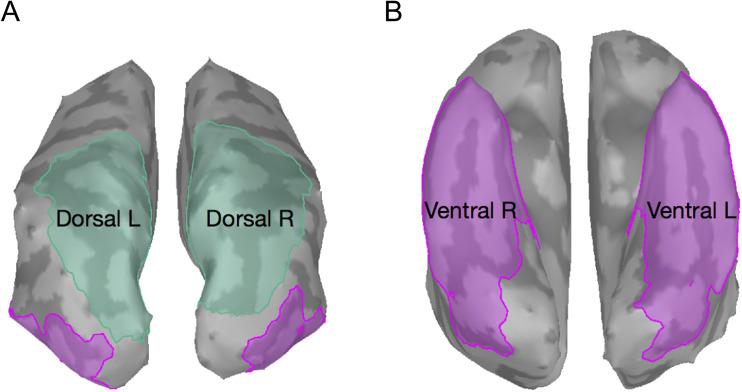
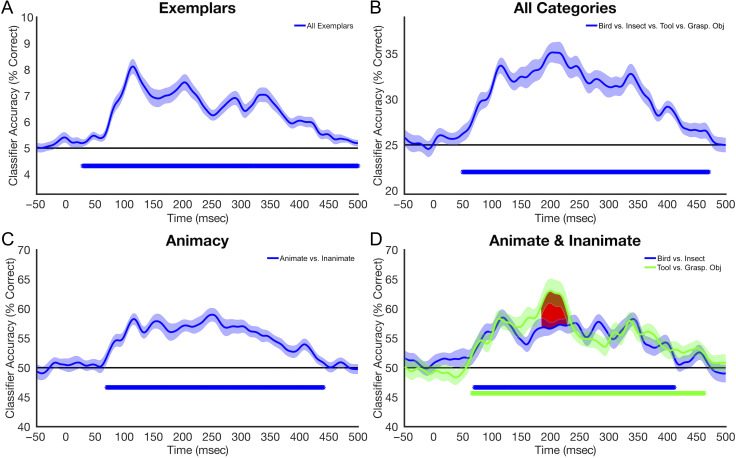
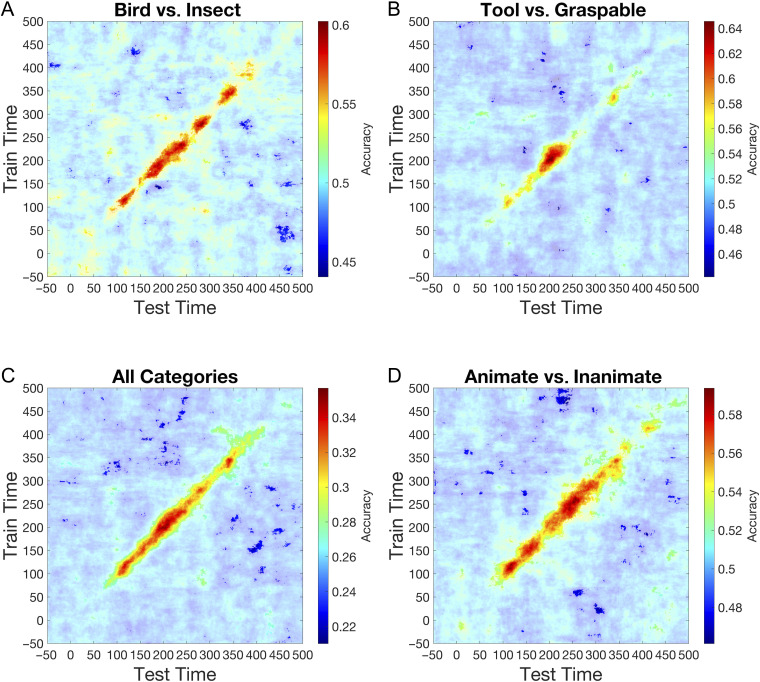
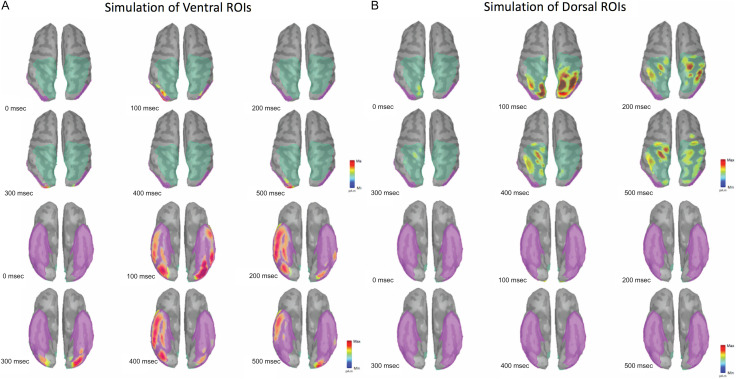
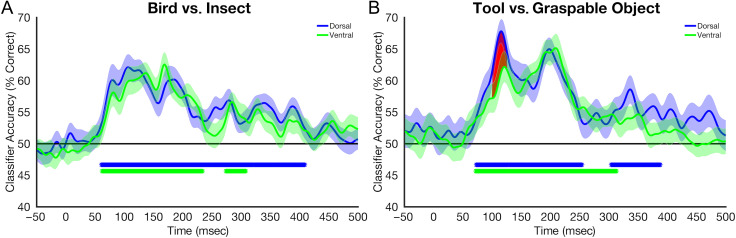
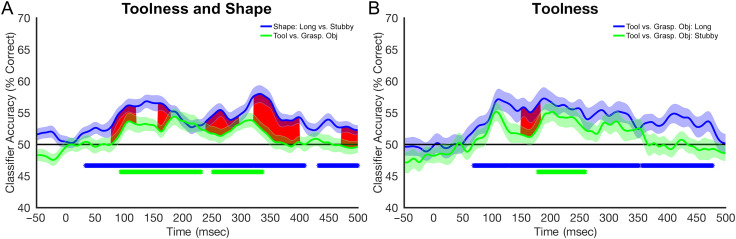
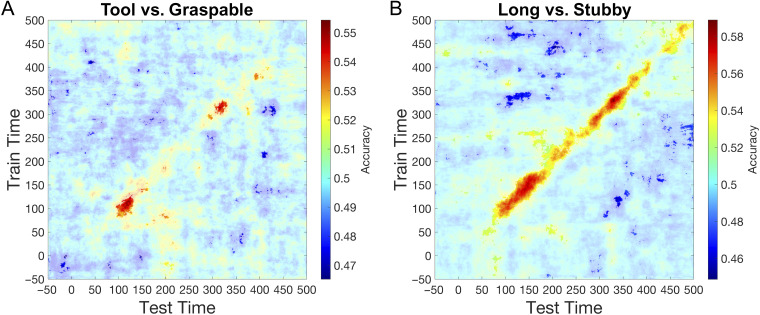
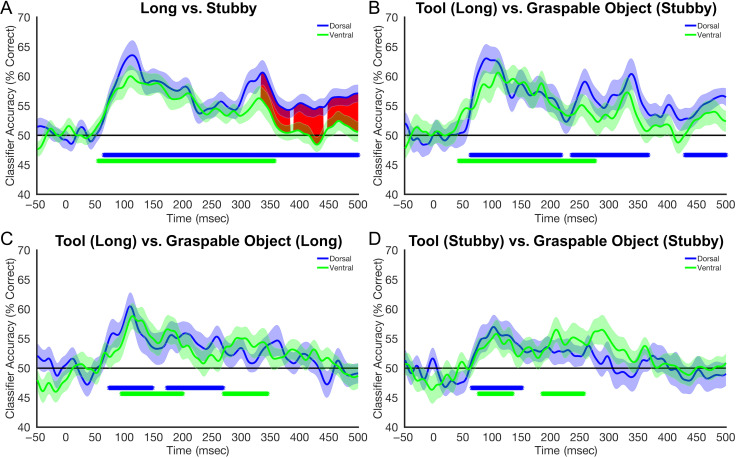
Visual object perception involves neural processes that unfold over time and recruit multiple regions of the brain. Here, we use high-density EEG to investigate the spatiotemporal representations of object categories across the dorsal and ventral pathways. In , human participants were presented with images from two animate object categories (birds and insects) and two inanimate categories (tools and graspable objects). In , participants viewed images of tools and graspable objects from a different stimulus set, one in which a shape confound that often exists between these categories (elongation) was controlled for. To explore the temporal dynamics of object representations, we employed time-resolved multivariate pattern analysis on the EEG time series data. This was performed at the electrode level as well as in source space of two regions of interest: one encompassing the ventral pathway and another encompassing the dorsal pathway. Our results demonstrate shape, exemplar, and category information can be decoded from the EEG signal. Multivariate pattern analysis within source space revealed that both dorsal and ventral pathways contain information pertaining to shape, inanimate object categories, and animate object categories. Of particular interest, we note striking similarities obtained in both ventral stream and dorsal stream regions of interest. These findings provide insight into the spatio-temporal dynamics of object representation and contribute to a growing literature that has begun to redefine the traditional role of the dorsal pathway.


Figures

<b>Figure 1.</b>
Figure 1.
The stimuli used in Experiment 1 (A) came from two superordinate categories: animate and inanimate. Each superordinate category was composed of two basic categories (animate: bird and insect; inanimate: tools and graspable objects). Images were processed using the SHINE toolbox to match lower level features, including luminance and spatial frequency. The stimulus set used for Experiment 2 (B) consisted of images from two categories: tools and graspable objects. Of the 10 exemplars that comprised each category, five were “stubby” (i.e., foreshortened) and five were elongated.
<b>Figure 2.</b>
Figure 2.
Dorsal (A) and ventral (B) pathway ROIs, shown in the left (L) and right (R) hemispheres on inflated cortical surfaces.
<b>Figure 3.</b>
Figure 3.
Decoding performance averaged across participants, plotted for each millisecond of the experimental epoch. Shaded regions around the curve represent SE. The black horizontal line represents chance performance. Asterisks below the line of chance represent time points at which classification was statistically significant after correcting for multiple comparisons. (A) Decoding of individual exemplars. (B) Decoding between the four basic categories (insect vs. bird vs. tool vs. graspable object). (C) Decoding of animacy (animate vs. inanimate). (D) Decoding within animate (bird vs. insect) and within inanimate (tool vs. graspable objects) object categories. Red shading represents time points at which the two curves were significantly different from one another after multiple comparisons correction. Grasp. Obj = graspable object.
<b>Figure 4.</b>
Figure 4.
Temporal cross-decoding matrices averaged across participants. Classifiers trained on each time point of the experimental epoch (y axis) were then tested on every other time point (x axis). Values plotted in the matrix represent classifier accuracy at each combination of points. Highlighted regions signify time points that were statistically significant at a false discovery rate corrected p value. (A) Temporal cross-decoding matrix for basic object categories (insect vs. bird vs. tool vs. graspable objects). (B) Temporal cross-decoding matrix for animate (bird vs. insect) object categories. (C) Temporal cross-decoding matrix for animacy (animate vs. inanimate). (D) Temporal cross-decoding matrix for inanimate (tool vs. graspable object) object categories.
<b>Figure 5.</b>
Figure 5.
EEG recordings were simulated by projecting dipole activity in dorsal and ventral ROIs (separately) while activity in all other regions was set to zero. Next, source localization was performed on the resulting, simulated waveforms using the same parameters and surfaces as described in the main experiment. The resulting source-localized diploe activity is plotted at different time points in dorsal (teal) and ventral (pink) ROIs. (A) Simulations of ventral activity. (B) Simulations of dorsal activity.
<b>Figure 6.</b>
Figure 6.
Decoding performance averaged across participants, plotted across time, and quantified as percent correct. Shaded regions around the curve represent SE. The black horizontal line represents chance performance. Asterisks below the line of chance represent time points at which classification was statistically significant after correcting for multiple comparisons. (A) Decoding of bird versus insects. (B) Decoding of tools versus graspable objects.
<b>Figure 7.</b>
Figure 7.
Decoding performance averaged across participants, plotted across time, and quantified as percent correct. Shaded regions around the curve represent SE. The black horizontal line represents chance performance. Red shading highlights time points at which the two curves were significantly different from one another after multiple comparisons correction. Asterisks below the line of chance represent time points at which classification was statistically significant after correcting for multiple comparisons. (A) Decoding of toolness and shape. (B) Decoding tool versus graspable object (long or stubby).
<b>Figure 8.</b>
Figure 8.
Temporal cross-decoding matrices averaged across participants. Classifiers trained on each time point of the experimental epoch (y axis) were then tested on every other time point (x axis). Values plotted in the matrix represent classifier accuracy at each combination of points. Highlighted regions signify time points that were statistically significant at a false discovery rate corrected p value. (A) Temporal cross-decoding matrix for toolness (tool vs. graspable object). (B) Temporal cross-decoding matrix for object shape (elongated vs. stubby).
<b>Figure 9.</b>
Figure 9.
Classification performance averaged across participants and plotted across time. Shaded regions around the curve represent SE. Regions shaded in red represent time windows during which accuracy differed significantly between the two curves following corrections for multiple comparisons. The black horizontal line represents chance performance. Asterisks below the line of chance represent time points at which classification was statistically significant after correcting for multiple comparisons. (A) Decoding object shape. (B) Decoding toolness without controlling for elongation. (C–D) Decoding toolness while controlling for elongation.

Similar articles

Cited by

References

    1. Alizadeh, A. M., van Dromme, I., Verhoef, B. E., & Janssen, P. (2018). Caudal intraparietal sulcus and three-dimensional vision: A combined functional magnetic resonance imaging and single-cell study. Neuroimage, 166, 46–59. 10.1016/j.neuroimage.2017.10.045, - DOI - PubMed
    1. Almeida, J., Mahon, B. Z., & Caramazza, A. (2010). The role of the dorsal visual processing stream in tool identification. Psychological Science, 21, 772–778. 10.1177/0956797610371343, - DOI - PMC - PubMed
    1. Almeida, J., Mahon, B. Z., Nakayama, K., & Caramazza, A. (2008). Unconscious processing dissociates along categorical lines. Proceedings of the National Academy of Sciences, U.S.A., 105, 15214–15218. 10.1073/pnas.0805867105, - DOI - PMC - PubMed
    1. Andrews, T. J., Watson, D. M., Rice, G. E., & Hartley, T. (2015). Low-level properties of natural images predict topographic patterns of neural response in the ventral visual pathway. Journal of Vision, 15, 3. 10.1167/15.7.3, - DOI - PMC - PubMed
    1. Astafiev, S. V., Stanley, C. M., Shulman, G. L., & Corbetta, M. (2004). Extrastriate body area in human occipital cortex responds to the performance of motor actions. Nature Neuroscience, 7, 542–548. 10.1038/nn1241, - DOI - PubMed

Publication types