. 2022 Apr 8;50(6):3394-3412.
doi: 10.1093/nar/gkac172.

The human AP-endonuclease 1 (APE1) is a DNA G-quadruplex structure binding protein and regulates KRAS expression in pancreatic ductal adenocarcinoma cells

Affiliations

The human AP-endonuclease 1 (APE1) is a DNA G-quadruplex structure binding protein and regulates KRAS expression in pancreatic ductal adenocarcinoma cells

Suravi Pramanik et al. Nucleic Acids Res. .

Abstract

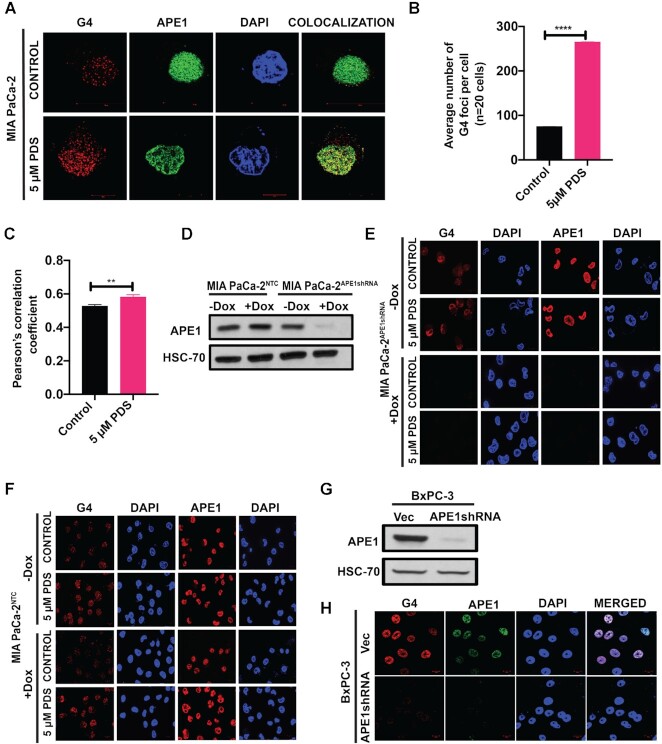
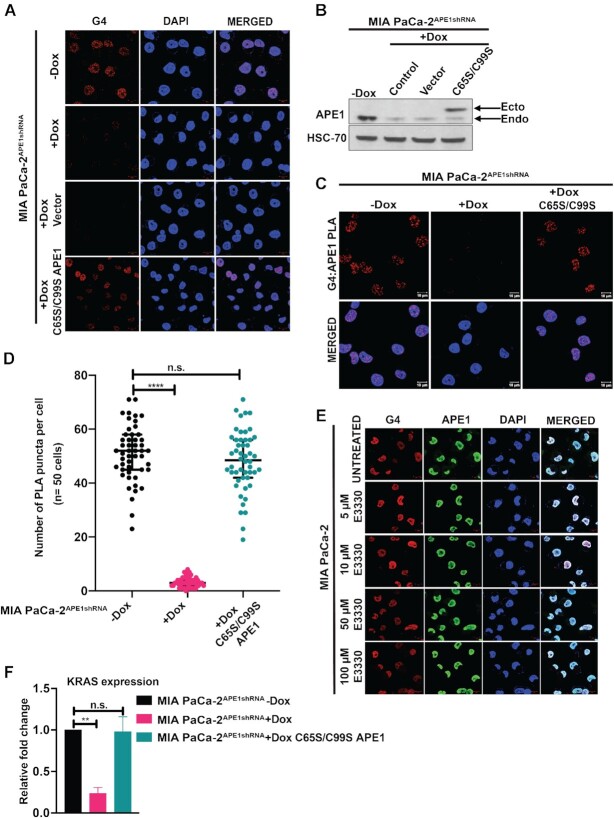
Pancreatic ductal adenocarcinoma (PDAC), one of the most aggressive types of cancer, is characterized by aberrant activity of oncogenic KRAS. A nuclease-hypersensitive GC-rich region in KRAS promoter can fold into a four-stranded DNA secondary structure called G-quadruplex (G4), known to regulate KRAS expression. However, the factors that regulate stable G4 formation in the genome and KRAS expression in PDAC are largely unknown. Here, we show that APE1 (apurinic/apyrimidinic endonuclease 1), a multifunctional DNA repair enzyme, is a G4-binding protein, and loss of APE1 abrogates the formation of stable G4 structures in cells. Recombinant APE1 binds to KRAS promoter G4 structure with high affinity and promotes G4 folding in vitro. Knockdown of APE1 reduces MAZ transcription factor loading onto the KRAS promoter, thus reducing KRAS expression in PDAC cells. Moreover, downregulation of APE1 sensitizes PDAC cells to chemotherapeutic drugs in vitro and in vivo. We also demonstrate that PDAC patients' tissue samples have elevated levels of both APE1 and G4 DNA. Our findings unravel a critical role of APE1 in regulating stable G4 formation and KRAS expression in PDAC and highlight G4 structures as genomic features with potential application as a novel prognostic marker and therapeutic target in PDAC.


Figures

Figure 1.
Figure 1.
APE1 plays a crucial role in the formation of G4 structures in cells. (A) SIM images of MIA PaCa-2 cells immunostained with α-1H6 and α-APE1 antibodies before or after treatment with PDS. Cells were counterstained with DAPI (magnification: 63×). (B) Quantification of the average number of G4 per cell (n = 20 cells). An unpaired Student’s t-test comparing control versus 5 μM PDS-treated samples was used to determine the P-values (****P< 0.0001). Error bars denote ±SD. (C) Pearson’s correlation coefficient was calculated (n = 20 cells) as a measure of colocalization frequency. An unpaired Student’s t-test comparing control versus PDS-treated samples was used to determine the P-value (**P< 0.01). Error bars denote ±SD. (D) MIA PaCa-2 cells expressing NTCshRNA (MIA PaCa-2NTCshRNA) or APE1shRNA (MIA PaCa-2APE1shRNA) under a Dox-inducible promoter were treated without or with 2 μg/ml Dox for 4 days and APE1 levels were examined by western blot using α-APE1 and α-HSC70 (loading control) antibodies. (E) MIA PaCa-2APE1shRNA cells treated without or with Dox were immunostained with α-1H6 and α-APE1 antibodies and visualized by confocal microscopy (magnification: 63×; scale bars: 20 μm). (F) MIA PaCa-2NTC cells treated without or with Dox were immunostained with α-1H6 and α-APE1 antibodies and visualized by confocal microscopy (magnification: 63×; scale bars: 10 μm). (G) APE1 levels were examined by western blot using α-APE1 and α-HSC70 (loading control) antibodies in BxPC-3 cells stably expressing empty vector and APE1shRNA. (H) BxPC-3 cells stably expressing empty vector and APE1shRNA were immunostained with α-1H6 and α-APE1 antibodies and visualized by confocal microscopy (magnification: 63×; scale bars: 10 μm). For each immunofluorescence-based study, three independent experiments were performed.
Figure 2.
Figure 2.
APE1 interacts with G4 structures and APE1 KD abrogates G4 staining in cells. (A) MIA PaCa-2APE1shRNA cells treated without (top) or with (bottom) Dox were immunostained with α-H3K27Ac antibody and visualized by confocal microscopy (magnification: 63×; scale bars: 10 μm). (B) APE1 levels were downregulated in MIA PaCa-2APE1shRNA using Dox and these cells were then transfected with vector control or plasmid expressing 3× FLAG-WT APE1. Twenty-four hours after transfection, cells were immunostained with α-1H6 antibody and visualized by confocal microscopy (magnification: 63×; scale bars: 10 μm). (C) APE1 levels in these cell extracts were examined by western blot analysis with α-APE1 and α-HSC70 (loading control) antibodies. (D) MIA PaCa-2APE1shRNA cells were treated without (top) or with (bottom) Dox and PLA was performed with antibodies against APE1, G4 and PLA probes. G4:APE1 PLA foci were visualized by confocal microscopy images (magnification: 63×; scale bars: 10 μm; enlarged scale bars: 2 μm). (E) Quantitation of the number of PLA puncta per cell (n = 50 cells). An unpaired Student’s t-test comparing the number of PLA puncta in control versus APE1 KD and control versus antibody control samples was used to determine the P-value (****P< 0.0001). Three independent experiments were performed.
Figure 3.
Figure 3.
APE1 binds with strong affinity to KRAS promoter G4 structure. (A) The sequence of 32R (G4-forming KRAS oligo), a 32-mer KRAS promoter sequence containing the G4-forming motif and a 32-mer sequence in which G residues were mutated to T (shown in green; non-G4-forming KRAS oligo) are shown. (B) CD spectra of G4-forming KRAS oligo and non-G4-forming KRAS oligo at 20°C in the presence of 50 mM KCl. The Y-axis indicates the ellipticity signal expressed in millidegrees. (C) 6-FAM-labeled G4-forming KRAS oligo (10 nM) was incubated with increasing concentrations of WT (black), or H309A (pink) or NΔ42 (teal) APE1 recombinant proteins in a buffer containing 50 mM KCl, 50 mM Tris–HCl (pH 7.5), 1 mM MgCl2, 1 mM DTT and 0.1 mM EDTA, and FP values were recorded. The dissociation constant (Kd) was calculated [nonlinear regression (curve fit) total saturation binding on Prism 8.0] from three independent experiments with triplicate samples; average ± SD Kd values are shown on the graph. (D) FP assay was performed with 6-FAM-labeled non-G4-forming KRAS oligo (10 nM) incubated with increasing concentrations of WT APE1 protein. (E) 6-FAM-labeled G4-forming KRAS oligo (10 nM) was incubated with a saturating dose (640 nM) of WT APE1 protein and then titrated with increasing concentrations of unlabeled G4-forming KRAS oligo, and FP values were plotted using Prism 8.0. The EC50 was calculated from three independent experiments performed with triplicate samples. (F) Titration for intrinsic fluorescence of WT APE1 with G4-forming KRAS oligo. The titration was carried out in a 500 μl quartz cuvette containing a solution of WT APE1 (500 nM) in a buffer containing 50 mM Tris–HCl (pH 7.5), 1 mM MgCl2, 1 mM DTT, 0.1 mM EDTA and 50 mM KCl. Increasing doses (0 nM to 1 μM) of G4-forming KRAS oligo were added to the WT APE1 solution and for each concentration of the oligonucleotide the fluorescence spectra were recorded at 20°C between 300 and 450 nm with excitation wavelength of 280 nm after 10 min of incubation. The spectra are reported as fluorescence intensity (a.u.) versus wavelength (nm). Three independent experiments were performed. (G) Scatchard plot showing the dissociation constant (Kd) for specific (red) and nonspecific (black) binding of WT APE1 protein to the KRAS G4 structure. (H) CD spectra of G4-forming KRAS alone or in combination with WT APE1 protein or NΔ42 protein and non-G4-forming KRAS oligo alone or in combination with WT APE1 protein at 20°C in the presence of 50 mM KCl. The Y-axis indicates the ellipticity signal expressed in millidegrees.
Figure 4.
Figure 4.
APE1 is associated with KRAS promoter G4 region in cells and regulates KRAS expression. (A) Schematic representation of G4 and non-G4 (Ctr-2) regions in KRAS promoter with respect to TSS. The length of each amplified DNA fragment for the real-time ChIP-PCR experiments is indicated. (B) MIA PaCa-2APE1shRNA cells were treated without and with Dox and ChIP assays were performed using antibodies against APE1, G4, MAZ and PARP-1. Enrichment on KRAS promoter G4 region (−23 to −112) and a non-G4 control region (Ctr-2; +2536 to +2712) was examined to analyze the occupancy of APE1, G4, MAZ and PARP1 in the G4 region over the control region by real-time ChIP-PCR. Relative fold changes normalized to input controls are shown. (C) Relative KRAS gene expression (normalized to GAPDH) was measured by real-time PCR for control and APE1 KD MIA PaCa-2, PANC-1 and BxPC-3 cells. (D) qRT-PCR assays were performed with MIA PaCa-2APE1shRNA cells that were treated without and with Dox and then with or without 5 μM PDS or 10 μM TMPyP4 for 2 h, and relative KRAS gene expression (normalized to GAPDH) was calculated. The P-values were determined using an unpaired Student’s t-test (****P< 0.0001, ***P< 0.001, **P< 0.01, *P< 0.05, n.s. (nonsignificant) = P> 0.05). Error bars denote ±SD. Three independent experiments were performed in triplicates.
Figure 5.
Figure 5.
Redox function of APE1 is not involved in the regulation of G4 structure formation and G4-mediated KRAS expression. (A) MIA PaCa-2APE1shRNA cells were treated with Dox and then transfected with 3× FLAG-tagged vector control or redox mutant C65S/C99S APE1 expressing plasmid constructs. Twenty-four hours after transfection, cells were immunostained with α-1H6 antibody and visualized by confocal microscopy (magnification 63×; scale bars: 10 μm). (B) APE1 levels in these cell extracts were examined by western blot analysis with α-APE1 and α-HSC70 (loading control) antibodies. (C) PLA was performed in APE1 KD MIA PaCa-2APE1shRNA cells expressing control vector or C65S/C99S APE1 mutant with antibodies against APE1, G4 and PLA probes. G4–APE1 PLA foci were visualized by confocal microscopy images (magnification: 63×; scale bars: 10 μm). (D) Quantitation of the number of PLA puncta per cell (n = 50 cells). (E) MIA PaCa-2 cells were treated with increasing doses of APE1 redox inhibitor E3330 for 6 h and then immunostained with α-1H6 and α-APE1 antibodies and visualized by confocal microscopy. Cells were counterstained with DAPI (magnification: 63×; scale bars: 10 μm). (F) Relative KRAS gene expression in MIA PaCa-2APE1shRNA cells expressing C65S/C99S APE1 plasmid by qRT-PCR assays. Fold change (normalized to GAPDH) was calculated. The P-values were determined using unpaired Student’s t-tests (****P< 0.0001, **P< 0.01, n.s. (nonsignificant) = P> 0.05). Error bars denote ±SD. Three independent experiments were performed.
Figure 6.
Figure 6.
APE1 KD sensitizes PDAC cells to chemotherapy in vitro and suppresses xenograft tumor growth in vivo.(A) MIA PaCa-2APE1shRNA cells were treated with or without Dox and the effect of APE1 KD on cell survival was evaluated using a colony formation assay. An unpaired Student’s t-test comparing the number of colonies in control versus APE1 KD cells was used to determine the P-value (****P< 0.0001). MIA PaCa-2APE1shRNA and MIA PaCa-2NTC cells treated without or with Dox for 4 days and then exposed to indicated doses of oxaliplatin (B) or gemcitabine (C). The graphs show the percentage cell viability obtained from colony formation assays, performed three times in triplicates. (D) MIA PaCa-2APE1shRNA cells were subcutaneously implanted in nude mice. When palpable tumors were visible, mice were divided into six groups (n = 5 in each group). Three groups were fed with Dox (2 mg/ml) and other three groups without Dox containing drinking water following which 5-FU (30 mg/kg) or oxaliplatin (2 mg/kg) were injected intraperitonially three times a week for 4 weeks and tumor volume was recorded using a caliper. Resected tumors after completion of treatment are shown. (E) Tumor volume was measured at indicated days and tumor growth curve was plotted. The P-values were determined using an unpaired Student’s t-test (****P< 0.0001, ***P< 0.001, **P< 0.01, *P< 0.05). Error bars denote ±SD.
Figure 7.
Figure 7.
Elevated levels of APE1 and G4 DNA in PDAC patients’ tissue samples. (A) IHC analysis of APE1 and G4 levels in normal and PDAC patients’ tissue samples (magnification: 2× and 40×; scale bars: 2 mm and 60 μm). The percentage of positive staining and the intensity were examined as described in the ‘Materials and Methods’ section. (B) The correlation between APE1 and G4 staining in the tissue samples was analyzed using simple linear regression. (C) The overall survival of PDAC patients in relation to APE1 and G4 staining was analyzed by Kaplan–Meier analysis.
Figure 8.
Figure 8.
A model for APE1-mediated regulation of G4 formation and loading of the TFs to drive KRAS expression (created with BioRender.com).

References

    1. Siegel R.L., Miller K.D., Jemal A.. Cancer statistics, 2020. CA Cancer J. Clin. 2020; 70:7–30. - PubMed
    1. Al Haddad A.H., Adrian T.E.. Challenges and future directions in therapeutics for pancreatic ductal adenocarcinoma. Expert Opin. Investig. Drugs. 2014; 23:1499–1515. - PubMed
    1. Hidalgo M., Cascinu S., Kleeff J., Labianca R., Lohr J.M., Neoptolemos J., Real F.X., Van Laethem J.L., Heinemann V.. Addressing the challenges of pancreatic cancer: future directions for improving outcomes. Pancreatology. 2015; 15:8–18. - PubMed
    1. Waters A.M., Der C.J.. KRAS: the critical driver and therapeutic target for pancreatic cancer. Cold Spring Harb. Perspect. Med. 2018; 8:a031435. - PMC - PubMed
    1. Zeitouni D., Pylayeva-Gupta Y., Der C.J., Bryant K.L.. KRAS mutant pancreatic cancer: no lone path to an effective treatment. Cancers (Basel). 2016; 8:45. - PMC - PubMed

MeSH terms