Comment
. 2022 May 3;10(5):581-596.
doi: 10.1158/2326-6066.CIR-21-0831.

Discovery of a Conditionally Activated IL-2 that Promotes Antitumor Immunity and Induces Tumor Regression

Comment

Discovery of a Conditionally Activated IL-2 that Promotes Antitumor Immunity and Induces Tumor Regression

Christopher J Nirschl et al. Cancer Immunol Res. .

Abstract

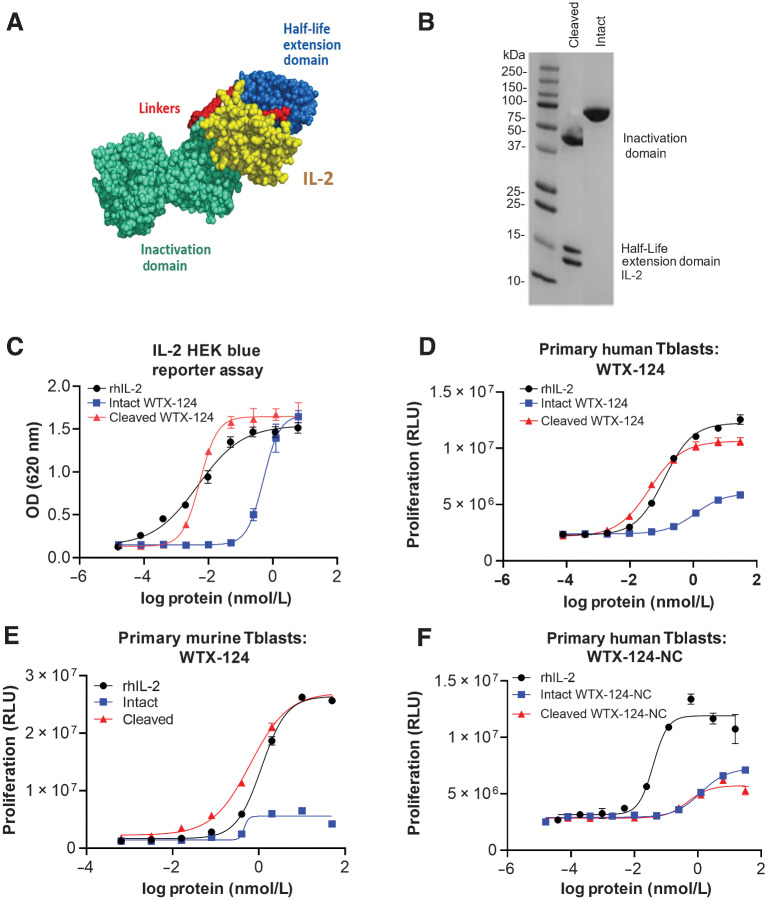
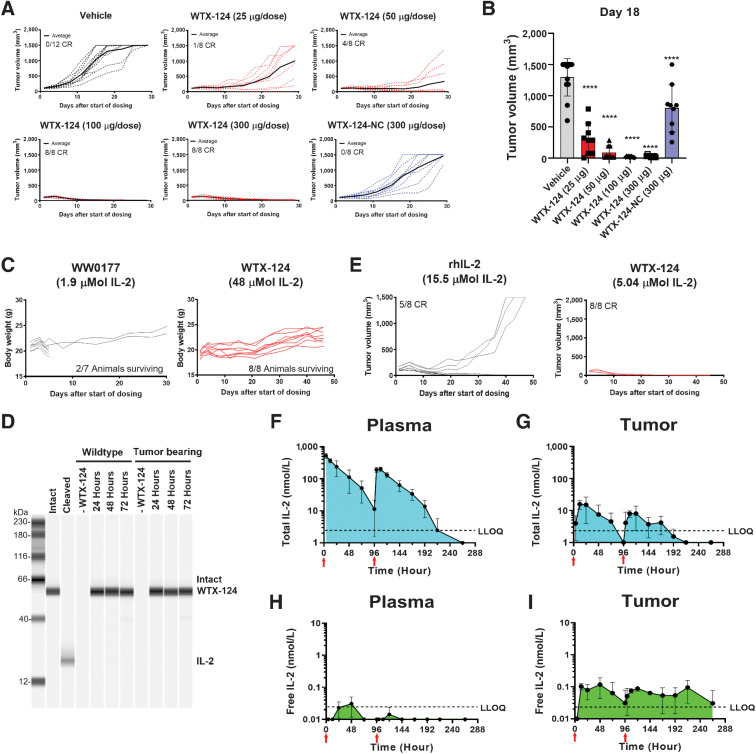
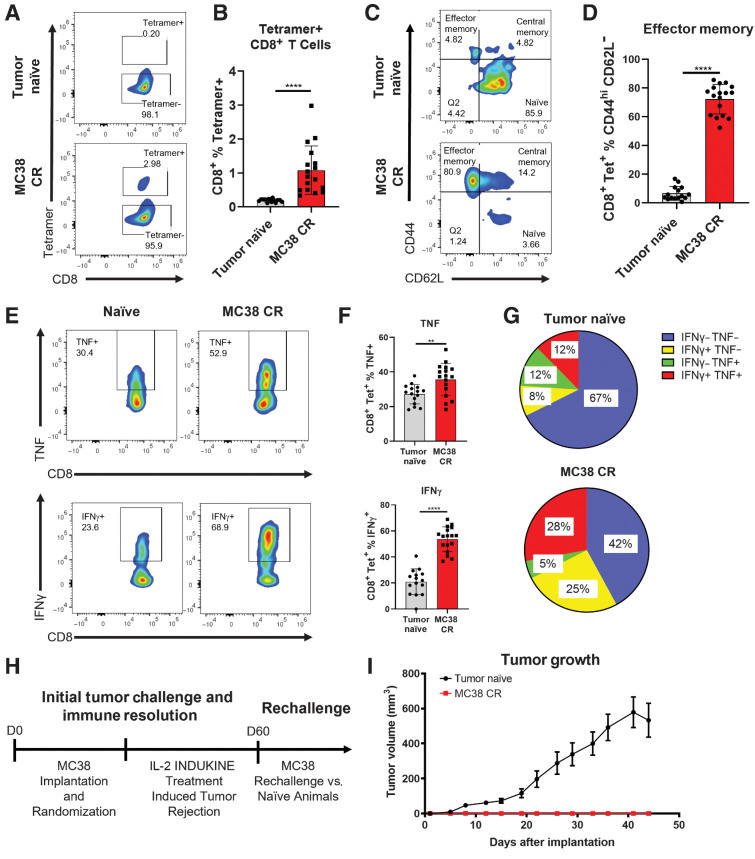
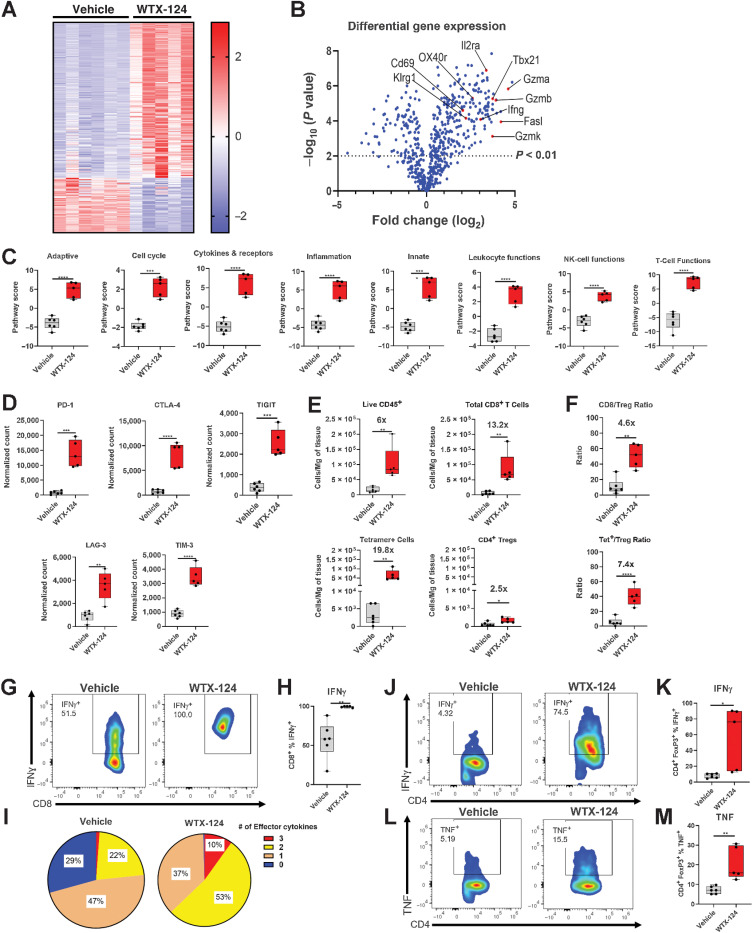
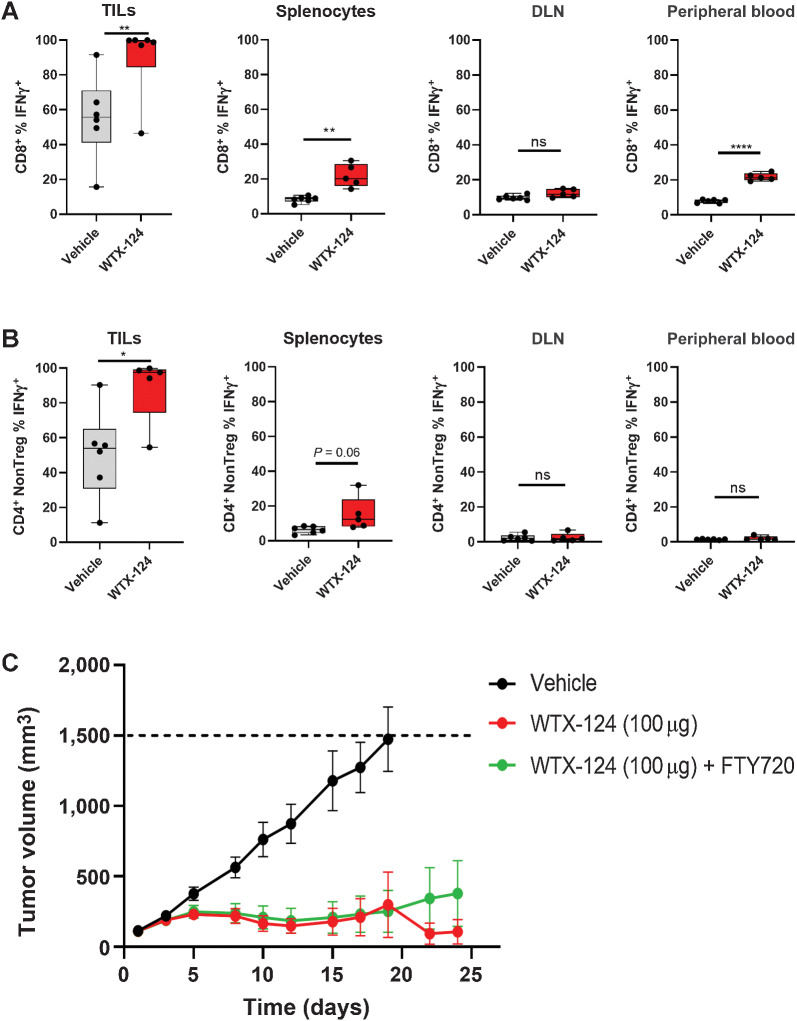
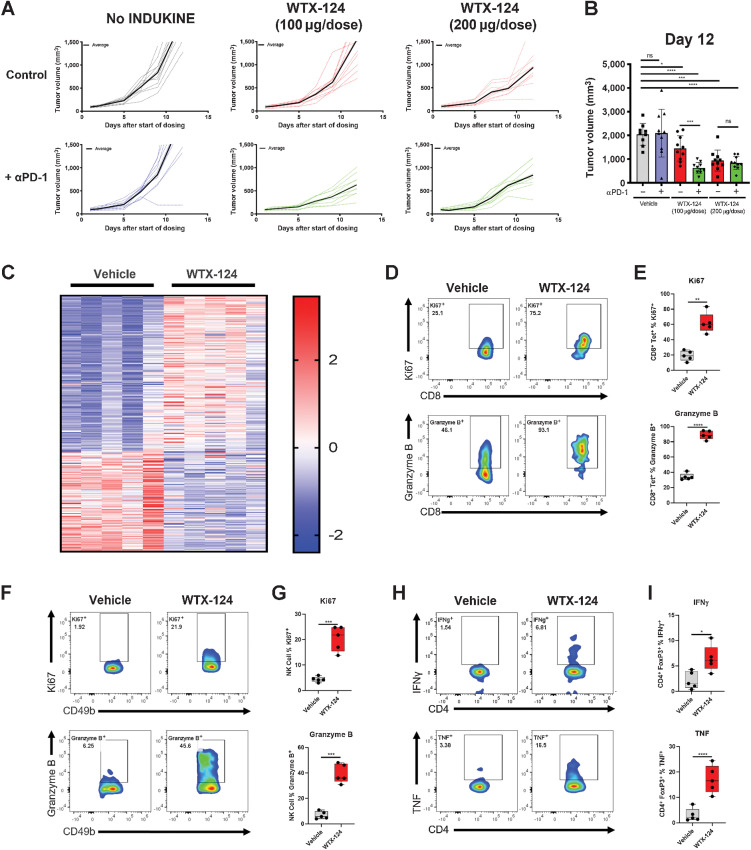
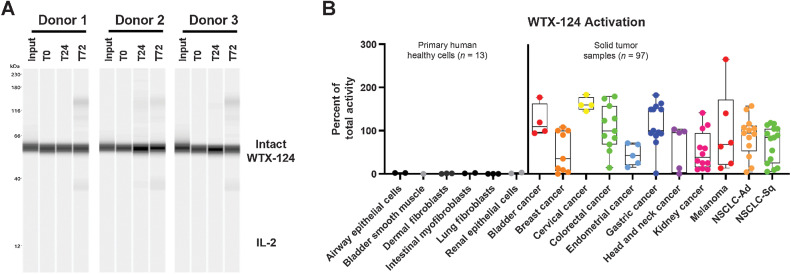
IL-2 is a cytokine clinically approved for the treatment of melanoma and renal cell carcinoma. Unfortunately, its clinical utility is hindered by serious side effects driven by the systemic activity of the cytokine. Here, we describe the design and characterization of a conditionally activated IL-2 prodrug, WTX-124, that takes advantage of the dysregulated protease milieu of tumors. WTX-124 was engineered as a single molecule containing an inactivation domain and a half-life extension domain that are tethered to a fully active IL-2 by protease-cleavable linkers. We show that the inactivation domain prevented IL-2 from binding to its receptors in nontumor tissues, thereby minimizing the toxicity associated with systemic exposure to IL-2. The half-life extension element improves the pharmacokinetic profile of WTX-124 over free IL-2, allowing for greater exposure. WTX-124 was preferentially activated in tumor tissue by tumor-associated proteases, releasing active IL-2 in the tumor microenvironment. In vitro assays confirmed that the activity of WTX-124 was dependent on proteolytic activation, and in vivo WTX-124 treatment resulted in complete rejection of established tumors in a cleavage-dependent manner. Mechanistically, WTX-124 treatment triggered the activation of T cells and natural killer (NK) cells, and markedly shifted the immune activation profile of the tumor microenvironment, resulting in significant inhibition of tumor growth in syngeneic tumor models. Collectively, these data demonstrate that WTX-124 minimizes the toxicity of IL-2 treatment in the periphery while retaining the full pharmacology of IL-2 in the tumor microenvironment, supporting its further development as a cancer immunotherapy treatment. See related Spotlight by Silva, p. 544.


Figures

Figure 1. Design and development of the selectively active IL2 INDUKINE protein WTX-124. A, Diagram of the components of WTX-124. The yellow section represents IL2, the blue section represents the half-life extending HSA-specific single-domain antibody, the teal section represents the activity blocking Fab, and the red sections represent the protease-cleavable linkers. B, Non-reduced SDS-PAGE comparing intact and protease-cleaved WTX-124 (IL2, anti-HSA half-life extension domain, and the Fab inactivation domain). C, In vitro activity of WTX-124 in the HEK-Blue IL2 reporter assay comparing intact (blue), and protease-activated (cleaved) WTX-124 (red) to rhIL2 (black). In vitro activity of intact (blue) and cleaved (red) WTX-124 in primary human (D) or murine (E) Tblasts compared with rhIL2 (black). F, In vitro activity of intact (blue) and “cleaved” (red) WTX-124-NC in primary human Tblasts compared with rhIL2 (black). C–F, Curves are representative of at least duplicate wells and depict the mean ± SD for individual points; data are representative of at least two experiments. HEK, human embryonic kidney; HSA, human serum albumin; OD, optical density; RLU, relative luminescence units;.
Figure 1.
Design and development of the selectively active IL-2 INDUKINE protein WTX-124. A, Diagram of the components of WTX-124. The yellow section represents IL-2, the blue section represents the half-life extending HSA-specific single-domain antibody, the teal section represents the activity blocking Fab, and the red sections represent the protease-cleavable linkers. B, Nonreduced SDS-PAGE comparing intact and protease-cleaved WTX-124 (IL-2, anti-HSA half-life extension domain, and the Fab inactivation domain). C,In vitro activity of WTX-124 in the HEK-Blue IL-2 reporter assay comparing intact (blue), and protease-activated (cleaved) WTX-124 (red) to rhIL-2 (black). In vitro activity of intact (blue) and cleaved (red) WTX-124 in primary human (D) or murine (E) Tblasts compared with rhIL-2 (black). F,In vitro activity of intact (blue) and “cleaved” (red) WTX-124-NC in primary human Tblasts compared with rhIL-2 (black). C–F, Curves are representative of at least duplicate wells and depict the mean ± SD for individual points; data are representative of at least two experiments. HEK, human embryonic kidney; HSA, human serum albumin; OD, optical density; RLU, relative luminescence units.
Figure 2. WTX-124 treatment induces tumor regression in a cleavage-dependent manner. MC38 tumor cells were implanted and allowed to grow to an average volume of 100–150 mm3 before mice were randomized into treatment groups. Mice were dosed twice a week with INDUKINE proteins, or twice a day for 5 days followed by 2 rest days with rhIL-2. Mice were dosed for 2 weeks unless otherwise noted. A, Mice were treated with either various doses of WTX-124, WTX-124-NC (noncleavable control), or vehicle, and tumor volume was measured over time. Spider plots for individual mice are reported (dashed lines), and the average tumor volume for the group is in bold. B, Tumor volume on day 18. C, Mice were treated with either WTX-124 or WW0177 (a WTX-124 variant lacking the inactivation domain). Body weight and survival from individual mice over time is shown. Dosing of WW0177 was halted after two doses due to excessive toxicity, whereas mice receiving WTX-124 were given all four doses. D, WTX-124 was diluted in murine plasma from either wild-type or MC38 tumor-bearing mice and incubated at 37°C for 24, 48, or 72 hours before WTX-124 processing was measured by Western blot analysis for IL-2. Intact and cleaved controls were prepared in vitro. Data are representative of n = 3 mice. E, Mice were treated with efficacious amounts of either WTX-124 (5.04 μmol/L total) or rhIL-2 (15.5 μmol/L total), and tumor volume was measured over time. Spider plots for individual mice are reported.Plasma (F and H) and tumor (G and I) samples from tumor-bearing mice were analyzed at various timepoints for either the presence of the total INDUKINE protein (F and G) using an ELISA that detects both intact WTX-124 as well as free IL-2, or free human IL-2 (H and I) using an AlphaLISA specific for unblocked human IL-2. Mice received only two doses, and the timing of the doses is indicated by the red arrows on the figure. F–I, Data are presented as the mean ± SD, and AUC measurements were calculated using GraphPad Prism software. P values are derived from a one-way ANOVA followed by Dunnett multiple comparisons comparing each sample with the vehicle control (****, P < 0.0001). ANOVA, analysis of variance; LLOQ, lower limit of quantification; MC, murine colon.
Figure 2.
WTX-124 treatment induces tumor regression in a cleavage-dependent manner. MC38 tumor cells were implanted and allowed to grow to an average volume of 100–150 mm3 before mice were randomized into treatment groups. Mice were dosed twice a week with INDUKINE proteins, or twice a day for 5 days followed by 2 rest days with rhIL-2. Mice were dosed for 2 weeks unless otherwise noted. A, Mice were treated with either various doses of WTX-124, WTX-124-NC (noncleavable control), or vehicle, and tumor volume was measured over time. Spider plots for individual mice are reported (dashed lines), and the average tumor volume for the group is in bold. B, Tumor volume on day 18. C, Mice were treated with either WTX-124 or WW0177 (a WTX-124 variant lacking the inactivation domain). Body weight and survival from individual mice over time is shown. Dosing of WW0177 was halted after two doses due to excessive toxicity, whereas mice receiving WTX-124 were given all four doses. D, WTX-124 was diluted in murine plasma from either wild-type or MC38 tumor-bearing mice and incubated at 37°C for 24, 48, or 72 hours before WTX-124 processing was measured by Western blot analysis for IL-2. Intact and cleaved controls were prepared in vitro. Data are representative of n = 3 mice. E, Mice were treated with efficacious amounts of either WTX-124 (5.04 μmol total) or rhIL-2 (15.5 μmol total), and tumor volume was measured over time. Spider plots for individual mice are reported. Plasma (F and H) and tumor (G and I) samples from tumor-bearing mice were analyzed at various timepoints for either the presence of the total INDUKINE protein (F and G) using an ELISA that detects both intact WTX-124 as well as free IL-2, or free human IL-2 (H and I) using an AlphaLISA specific for unblocked human IL-2. Mice received only two doses, and the timing of the doses is indicated by the red arrows on the figure. F–I, Data are presented as the mean ± SD, and AUC measurements were calculated using GraphPad Prism software. P values are derived from a one-way ANOVA followed by Dunnett multiple comparisons comparing each sample with the vehicle control (****, P < 0.0001). ANOVA, analysis of variance; LLOQ, lower limit of quantification; MC, murine colon.
Figure 3. WTX-124 treatment induces an antitumor memory response. MC38 tumor cells were implanted and allowed to grow to an average volume of 100–150 mm3 before mice were randomized into treatment groups. Mice were dosed twice a week with varying doses of WTX-124 (50–300 μg/dose) for a total of four treatments (Fig. 2A). Spleens from any mice that rejected the MC38 tumors (MC38 CR) were examined 6 months after the initial implantation and compared to age-matched, tumor-naïve mice. Splenocytes were assessed for the frequency of tetramer-positive CD8+ T cells (A and B) and the expression of the memory cell markers CD62 L and CD44 on tetramer-positive CD8+ T cells (C and D), as well as for the frequency of tetramer-positive CD8+ T cells producing TNF or IFNγ (E and F). G, Analysis of polyfunctional tetramer-positive CD8+ T cells coexpressing IFNγ and TNF. H and I, Naïve mice or mice that had previously rejected MC38 tumors after IL2 INDUKINE treatment were rechallenged with MC38 tumor cells 60 days following the initial implantation. No treatment was administered to these mice during the rechallenge. I, Tumor volume from MC38 CR (n = 15) or naïve (n = 33) mice was measured over time and is represented as the mean ± SEM. Remaining data are presented as mean ± SD for quantification plots, with P values derived from t tests (**, P < 0.01; ****, P < 0.0001).
Figure 3.
WTX-124 treatment induces an antitumor memory response. MC38 tumor cells were implanted and allowed to grow to an average volume of 100–150 mm3 before mice were randomized into treatment groups. Mice were dosed twice a week with varying doses of WTX-124 (50–300 μg/dose) for a total of four treatments (Fig. 2A). Spleens from any mice that rejected the MC38 tumors (MC38 CR) were examined 6 months after the initial implantation and compared to age-matched, tumor-naïve mice. Splenocytes were assessed for the frequency of tetramer-positive CD8+ T cells (A and B) and the expression of the memory cell markers CD62L and CD44 on tetramer-positive CD8+ T cells (C and D), as well as for the frequency of tetramer-positive CD8+ T cells producing TNF or IFNγ (E and F). G, Analysis of polyfunctional tetramer-positive CD8+ T cells coexpressing IFNγ and TNF. H and I, Naïve mice or mice that had previously rejected MC38 tumors after IL-2 INDUKINE treatment were rechallenged with MC38 tumor cells 60 days following the initial implantation. No treatment was administered to these mice during the rechallenge. I, Tumor volume from MC38 CR (n = 15) or naïve (n = 33) mice was measured over time and is represented as the mean ± SEM. Remaining data are presented as mean ± SD for quantification plots, with P values derived from t tests (**, P < 0.01; ****, P < 0.0001).
Figure 4. WTX-124 treatment increases immune cell activation and infiltration of MC38 tumors. MC38 tumor cells were implanted and allowed to grow to an average volume of 100–150 mm3 before mice were randomized into treatment groups. Mice were dosed twice a week with WTX-124 (100 μg) or PBS. Tumors were collected 24 hours after the second dose and dissociated for further analysis. A and B, RNA from each tumor was isolated and subjected to immune profiling with the NanoString PanCancer Mouse Immune Profiling Panel. A, Heatmap of transcripts with statistically significant differences in expression between the two treatments. Transcripts were excluded from the heatmap if they had average normalized counts below 50. Each lane represents an individual animal. B, Volcano plot of transcripts differentially expressed between WTX-124 and vehicle-treated mice. C, Specific pathway scores for WTX-124 or vehicle-treated mice. P values are derived from a two-way ANOVA with multiple comparisons (***, P < 0.001; ****, P < 0.0001). D, Normalized gene counts from selected immune checkpoint genes. E, Flow cytometry analysis of TIL density of various immune populations, including fold change information between the vehicle-treated and WTX-124–treated groups. F, The ratio of total CD8+ T cells or tetramer-positive CD8+ T cells to Tregs within the TILs, including fold change information between the vehicle and WTX-124–treated groups. G and H, The frequency of tetramer-positive CD8+ T cells producing IFNγ after restimulation with PMA/Ionomycin. I, The frequency of polyfunctional tetramer-positive CD8+ T cells by examining coexpression of IFNγ, TNF, and granzyme B after PMA/Ionomycin restimulation. The frequency tumor infiltrating FoxP3+ Tregs producing IFNγ (J and K) or TNF (L and M) after PMA/Ionomycin restimulation. Unless otherwise stated, data are presented as the mean ± SD, and P values are derived from t tests (*, P < 0.05; **, P < 0.01; ***, P < 0.001; ****, P < 0.0001). CTLA-4, CTL-associated protein 4; LAG-3, lymphocyte-activation gene 3; Tet, tetramer; TIGIT, T-cell immunoglobulin and ITIM (immunoreceptor tyrosine-based inhibitory motif) domain; TIM-3, T-cell immunoglobulin and mucin domain-containing protein 3.
Figure 4.
WTX-124 treatment increases immune cell activation and infiltration of MC38 tumors. MC38 tumor cells were implanted and allowed to grow to an average volume of 100–150 mm3 before mice were randomized into treatment groups. Mice were dosed twice a week with WTX-124 (100 μg) or PBS. Tumors were collected 24 hours after the second dose and dissociated for further analysis. A and B, RNA from each tumor was isolated and subjected to immune profiling with the NanoString PanCancer Mouse Immune Profiling Panel. A, Heatmap of transcripts with statistically significant differences in expression between the two treatments. Transcripts were excluded from the heatmap if they had average normalized counts below 50. Each lane represents an individual animal. B, Volcano plot of transcripts differentially expressed between WTX-124 and vehicle-treated mice. C, Specific pathway scores for WTX-124 or vehicle-treated mice. P values are derived from a two-way ANOVA with multiple comparisons (***, P < 0.001; ****, P < 0.0001). D, Normalized gene counts from selected immune checkpoint genes. E, Flow cytometry analysis of TIL density of various immune populations, including fold change information between the vehicle-treated and WTX-124–treated groups. F, The ratio of total CD8+ T cells or tetramer-positive CD8+ T cells to Tregs within the TILs, including fold change information between the vehicle and WTX-124–treated groups. G and H, The frequency of tetramer-positive CD8+ T cells producing IFNγ after restimulation with PMA/Ionomycin. I, The frequency of polyfunctional tetramer-positive CD8+ T cells by examining coexpression of IFNγ, TNF, and granzyme B after PMA/Ionomycin restimulation. The frequency tumor infiltrating FoxP3+ Tregs producing IFNγ (J and K) or TNF (L and M) after PMA/Ionomycin restimulation. Unless otherwise stated, data are presented as the mean ± SD, and P values are derived from t tests (*, P < 0.05; **, P < 0.01; ***, P < 0.001; ****, P < 0.0001). CTLA-4, CTL-associated protein 4; LAG-3, lymphocyte-activation gene 3; Tet, tetramer; TIGIT, T-cell immunoglobulin and ITIM (immunoreceptor tyrosine-based inhibitory motif) domain; TIM-3, T-cell immunoglobulin and mucin domain-containing protein 3.
Figure 5. Systemic WTX-124 treatment preferentially activates tumor-infiltrating T cells. MC38 tumor cells were implanted and allowed to grow to an average volume of 100–150 mm3 before mice were randomized into treatment groups. Mice were dosed twice a week with WTX-124 (100 μg) or vehicle. Tumors, spleens, DLNs, non-DLNs, and peripheral blood samples were collected 24 hours after the second dose. Graphs show the frequency of either tetramer-negative CD8+ T cells (A) or CD4+ non-Tregs (B) producing IFNγ after restimulation with PMA/Ionomycin. C, Mice were treated with either vehicle (n = 10), WTX-124 alone (n = 10), or WTX-124 with daily FTY720 (n = 10) treatment. FTY720 dosing was initiated 24 hours prior to starting WTX-124 treatment (25 μg dose) and maintained daily (10 μg dose) throughout the experiment. Tumor volume (mean ± SEM) was measured over time. Unless otherwise stated, data are presented as the mean ± SD, and P values are derived from t tests (*, P < 0.05; **, P < 0.01; ****, P < 0.0001). DLN, draining lymph node.
Figure 5.
Systemic WTX-124 treatment preferentially activates tumor-infiltrating T cells. MC38 tumor cells were implanted and allowed to grow to an average volume of 100–150 mm3 before mice were randomized into treatment groups. Mice were dosed twice a week with WTX-124 (100 μg) or vehicle. Tumors, spleens, DLNs, and peripheral blood samples were collected 24 hours after the second dose. Graphs show the frequency of either tetramer-negative CD8+ T cells (A) or CD4+ non-Tregs (B) producing IFNγ after restimulation with PMA/Ionomycin. C, Mice were treated with either vehicle (n = 10), WTX-124 alone (n = 10), or WTX-124 with daily FTY720 (n = 10) treatment. FTY720 dosing was initiated 24 hours prior to starting WTX-124 treatment (25 μg dose) and maintained daily (10 μg dose) throughout the experiment. Tumor volume (mean ± SEM) was measured over time. Unless otherwise stated, data are presented as the mean ± SD, and P values are derived from t tests (*, P < 0.05; **, P < 0.01; ****, P < 0.0001). DLN, draining lymph node.
Figure 6. WTX-124 treatment increases CD8+ T-cell activation and Treg fragility in B16-F10 Tumors. B16-F10 tumors were implanted and allowed to grow to an average volume of 100–150 mm3 before mice were randomized into treatment groups. Mice were dosed twice a week with either PBS or with various doses of WTX-124. Some mice also received PD-1 blockade in addition to WTX-124 treatment. A, Tumor volume was measured over time. Data from individual mice (dashed lines) are depicted with the group average presented in bold. B, Tumor volume on day 12. C–I, Tumors from mice treated with either the vehicle or WTX-124 (200 μg/dose) were harvested 24 hours after the second dose. C, RNA from each tumor was isolated and subjected to immune profiling with the NanoString nCounter PanCancer Mouse Immune Profiling panel. Heatmap of transcripts with statistically significant differences in expression between the two treatments. Transcripts were excluded from the heatmap if they had average normalized counts below 50. Each lane represents an individual animal. D–I, TILs were restimulated with PMA/Ionomycin and examined for effector cytokine production and proliferation. D and E, The frequency of tumor-infiltrating tetramer-positive CD8+ T cells producing granzyme B or expressing Ki67. The tetramer used in these experiments was the same tetramer from Fig. 4. F and G, The frequency of tumor-infiltrating NK cells producing granzyme B or expressing Ki67. H and I, The frequency of tumor-infiltrating CD4+ Tregs producing IFNγ or TNF. In plots comparing only two groups, P values are derived from t tests (*, P < 0.05; **, P < 0.01; ***, P < 0.001; ****, P < 0.0001). In plots comparing multiple groups, P values are derived from a one-way ANOVA followed by Dunnett multiple comparisons comparing each sample with the vehicle control (*, P < 0.05; ***, P < 0.001; ****, P < 0.0001).
Figure 6.
WTX-124 treatment increases CD8+ T-cell activation and Treg fragility in B16-F10 Tumors. B16-F10 tumors were implanted and allowed to grow to an average volume of 100–150 mm3 before mice were randomized into treatment groups. Mice were dosed twice a week with either PBS or with various doses of WTX-124. Some mice also received PD-1 blockade in addition to WTX-124 treatment. A, Tumor volume was measured over time. Data from individual mice (dashed lines) are depicted with the group average presented in bold. B, Tumor volume on day 12. C–I, Tumors from mice treated with either the vehicle or WTX-124 (200 μg/dose) were harvested 24 hours after the second dose. C, RNA from each tumor was isolated and subjected to immune profiling with the NanoString nCounter PanCancer Mouse Immune Profiling panel. Heatmap of transcripts with statistically significant differences in expression between the two treatments. Transcripts were excluded from the heatmap if they had average normalized counts below 50. Each lane represents an individual animal. D–I, TILs were restimulated with PMA/Ionomycin and examined for effector cytokine production and proliferation. D and E, The frequency of tumor-infiltrating tetramer-positive CD8+ T cells producing granzyme B or expressing Ki67. The tetramer used in these experiments was the same tetramer from Fig. 4. F and G, The frequency of tumor-infiltrating NK cells producing granzyme B or expressing Ki67. H and I, The frequency of tumor-infiltrating CD4+ Tregs producing IFNγ or TNF. In plots comparing only two groups, P values are derived from t tests (*, P < 0.05; **, P < 0.01; ***, P < 0.001; ****, P < 0.0001). In plots comparing multiple groups, P values are derived from a one-way ANOVA followed by Dunnett multiple comparisons comparing each sample with the vehicle control (*, P < 0.05; ***, P < 0.001; ****, P < 0.0001).
Figure 7. WTX-124 is stable in human serum and selectively processed by primary human tumor cells. A, WTX-124 was diluted into healthy human serum from n = 3 donors and incubated at 37°C for 24 or 72 hours before WTX-124 processing was measured by Western blot analysis for IL2. B, WTX-124 was exposed to primary human tumor samples (n = 97) or primary human healthy cells (n = 13) for 48 hours before INDUKINE protein cleavage was measured. Box plots represent the 25th and 75th percentile, while the line represents the median value for each indication. Whiskers represent the minimum and maximum values within a given indication. Ad, adenocarcinoma; NSCLC, non–small cell lung cancer; Sq, squamous; T, time in hours.
Figure 7.
WTX-124 is stable in human serum and selectively processed by primary human tumor cells. A, WTX-124 was diluted into healthy human serum from n = 3 donors and incubated at 37°C for 24 or 72 hours before WTX-124 processing was measured by Western blot analysis for IL-2. B, WTX-124 was exposed to primary human tumor samples (n = 97) or primary human healthy cells (n = 13) for 48 hours before INDUKINE protein cleavage was measured. Box plots represent the 25th and 75th percentile, while the line represents the median value for each indication. Whiskers represent the minimum and maximum values within a given indication. Ad, adenocarcinoma; NSCLC, non–small cell lung cancer; Sq, squamous; T, time in hours.

Comment in

Comment on

References

    1. Wei SC, Duffy CR, Allison JP. Fundamental mechanisms of immune checkpoint blockade therapy. Cancer Discov 2018;8:1069–86. - PubMed
    1. Ribas A, Wolchok JD. Cancer immunotherapy using checkpoint blockade. Science 2018;359:1350–5. - PMC - PubMed
    1. Pardoll DM. The blockade of immune checkpoints in cancer immunotherapy. Nat Rev Cancer 2012;12:252–64. - PMC - PubMed
    1. Waldmann TA. Cytokines in cancer immunotherapy. Cold Spring Harb Perspect Biol 2018;10:a028472. - PMC - PubMed
    1. Mitra S, Leonard WJ. Biology of IL-2 and its therapeutic modulation: mechanisms and strategies. J Leukoc Biol 2018;103:643–55. - PubMed

Publication types