. 2022 Aug;12(8):1943-1958.
doi: 10.1007/s13346-022-01131-8. Epub 2022 Mar 14.

Effect of chest physiotherapy on cystic fibrosis sputum nanostructure: an experimental and theoretical approach

Affiliations

Effect of chest physiotherapy on cystic fibrosis sputum nanostructure: an experimental and theoretical approach

Michela Abrami et al. Drug Deliv Transl Res. 2022 Aug.

Abstract

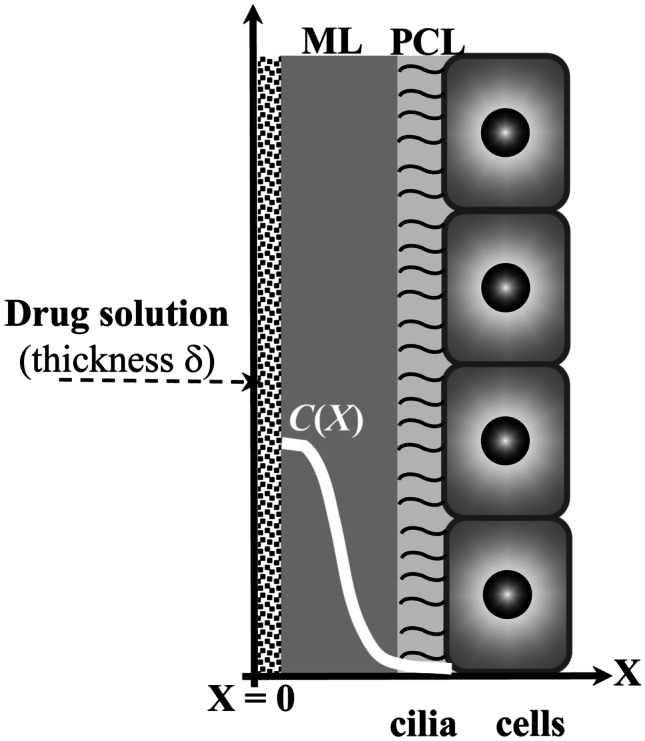
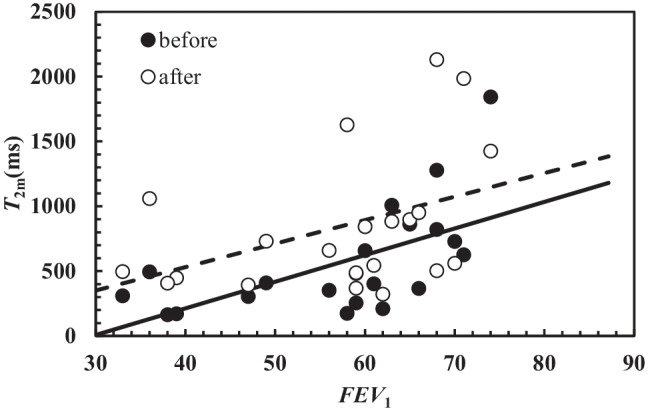
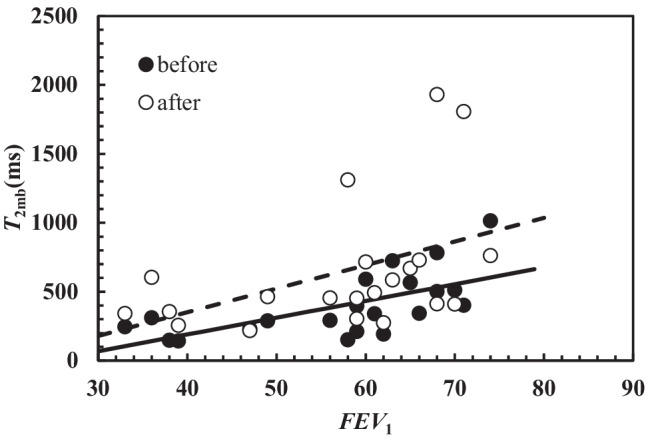
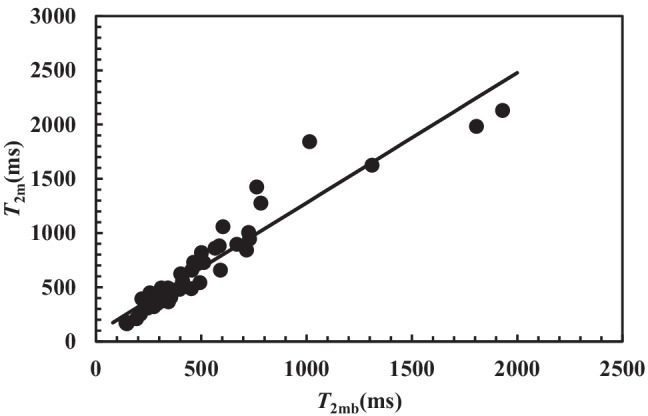
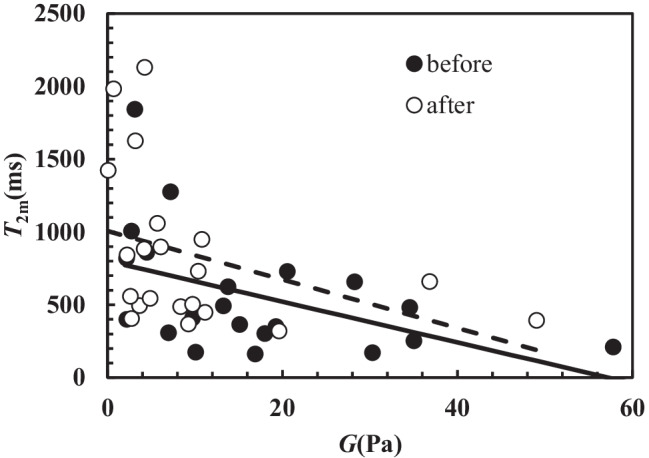
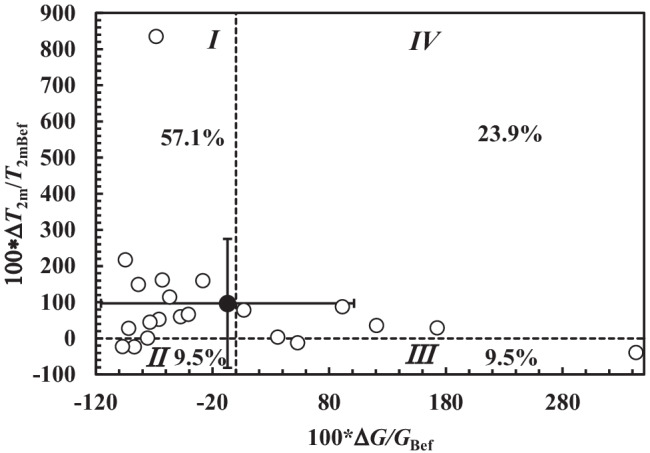
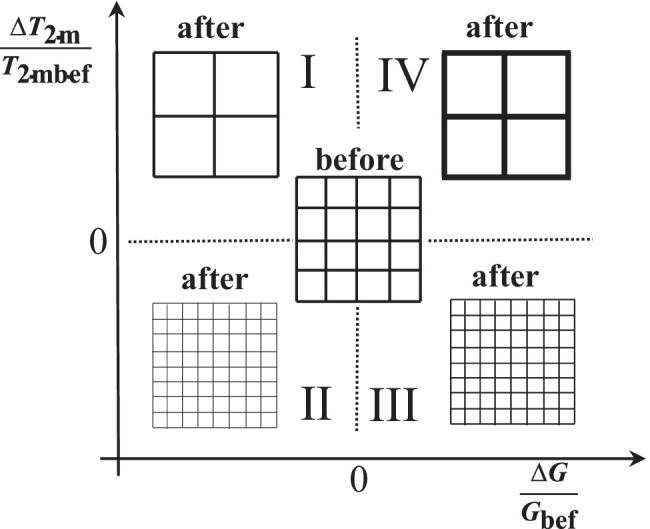
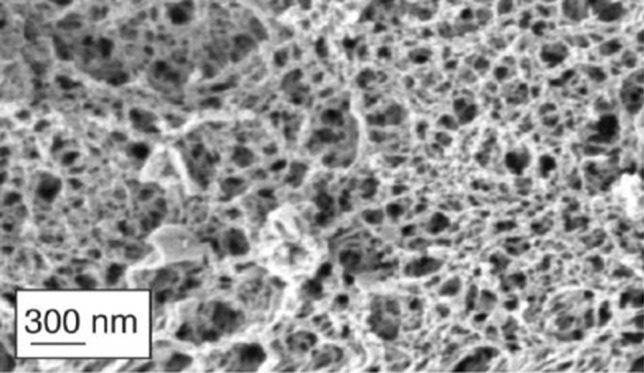
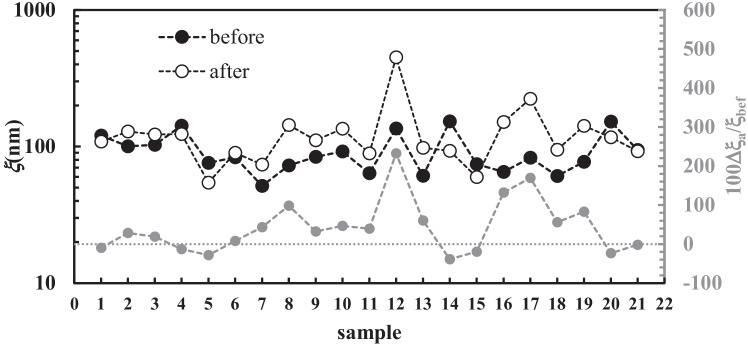
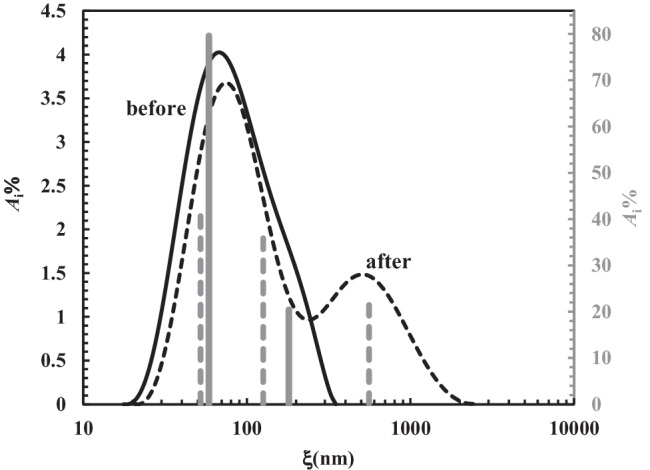
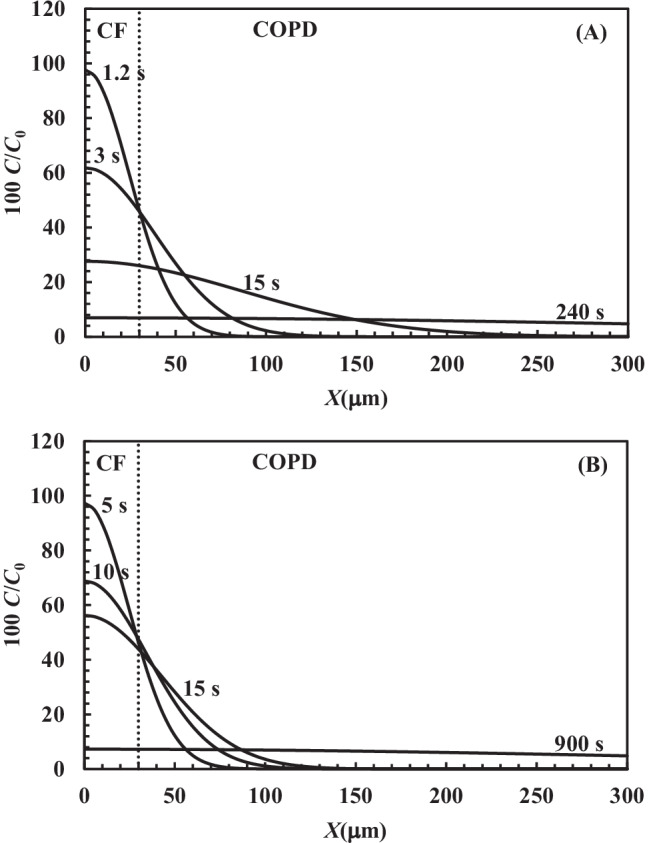
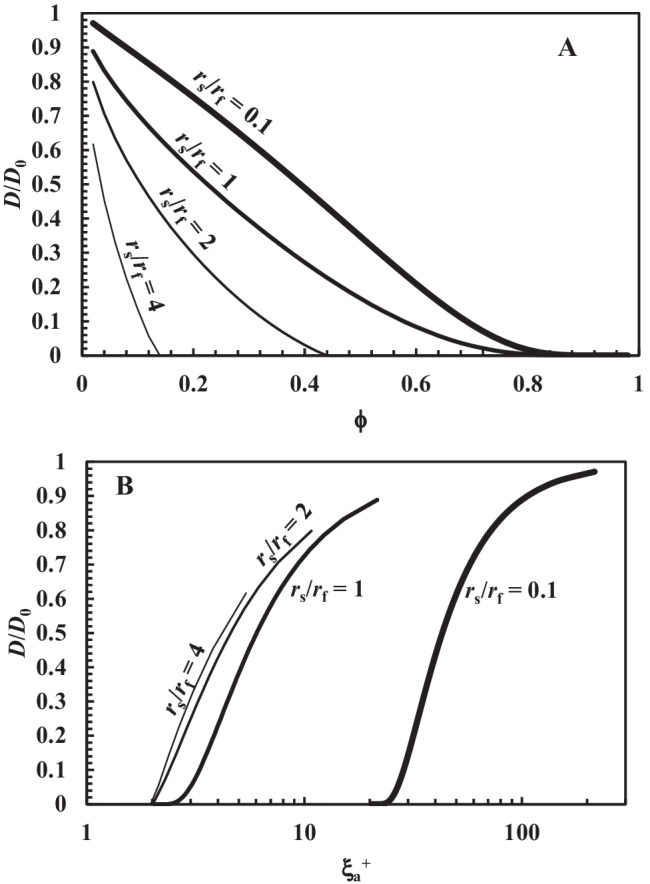
Cystic fibrosis (CF) is a disease characterized by the production of viscous mucoid secretions in multiple organs, particularly the airways. The pathological increase of proteins, mucin and biological polymers determines their arrangement into a three-dimensional polymeric network, affecting the whole mucus and impairing the muco-ciliary clearance which promotes inflammation and bacterial infection. Thus, to improve the efficacy of the drugs usually applied in CF therapy (e.g., mucolytics, anti-inflammatory and antibiotics), an in-depth understanding of the mucus nanostructure is of utmost importance. Drug diffusivity inside a gel-like system depends on the ratio between the diffusing drug molecule radius and the mesh size of the network. Based on our previous findings, we propose the combined use of rheology and low field NMR to study the mesh size distribution of the sputum from CF patients. Specifically, we herein explore the effects of chest physiotherapy on CF sputum characteristic as evaluated by rheology, low field NMR and the drug penetration through the mucus via mathematical simulation. These data show that chest physiotherapy has beneficial effects on patients, as it favourably modifies sputum and enhances drug penetration through the respiratory mucus.

Keywords: Cystic fibrosis; Drug delivery; Low field NMR; Mesh size distribution; Rheology; Sputum.


Conflict of interest statement

The authors declare no competing interests.

Figures

Fig. 1
Fig. 1
The airway surface liquid (ASL) lining the walls of the bronchial tree is composed by the periciliary liquid (PL), where cells cilia beat, and by the mucus layer (ML). When a drug solution is inhaled, it spreads on the ML, and the drug can diffuse inside the ASL. White line indicates the hypothetical drug concentration profile inside ASL
Fig. 2
Fig. 2
Correlation between T2m and FEV1 before (black circles) and after (white circles) chest physiotherapy. In both cases, the correlation is statistically significant (before: rsp = 0.69, p = 0.006; after rsp = 0.44, p = 0.044). The linear relation occurring between T2m and FEV1 is represented by solid line (before: T2m(ms) = (20.5 ± 6.3) × FEV1 – (609 ± 366)) and dashed line (after: T2m(ms) = (18.1 ± 9.0) × FEV1 – (193 ± 526))
Fig. 3
Fig. 3
Correlation between T2mb and FEV1 before (dark circles) and after (white circles) chest physiotherapy. In both cases, the correlation is statistically significant (before: rsp = 0.73, p = 0.0002; after rsp = 0.51, p = 0.019). The linear relation occurring between T2mb and FEV1 is represented by solid line (before: T2mb(ms) = (12.2 ± 3.3) × FEV1 – (295 ± 195)) and dashed line (after: T2mb(ms) = (17.1 ± 8.0) × FEV1 – (333 ± 464))
Fig. 4
Fig. 4
Statistically significant correlation between T2m and T2mb referring to all the 42 samples considered (rsp = 0.97, p < 0.0001). Solid line represents the linear interpolant: T2m(ms) = (1.2 ± 0.06) × T2mb + (78 ± 41)
Fig. 5
Fig. 5
Correlation between T2m and G. Dark circles indicate samples before chest physiotherapy, while white circles refer to samples after chest physiotherapy. A statistically significant correlation between T2m and G occurs both before (rsp = −0.53, p = 0.014; T2m(ms) = −(14.0 ± 6.0) × G(Pa) + (801 ± 131); solid line) and after (rsp = −0.495, p = 0.023; T2m(ms) = −(14.6 ± 9.3) × G(Pa) + (1006 ± 143); dashed line) chest physiotherapy. The overall correlation is statistically significant (rsp = −0.58, p = 0.0001; T2m(ms) = −(16.8 ± 5.2) × G(Pa) + (928 ± 97))
Fig. 6
Fig. 6
Relative percentage variation of the relaxation time (100*ΔT2m/T2mBef) versus the relative percentage variation of the shear modulus (100*ΔG/GBef) considering samples after and before chest physiotherapy (open circles). Black circle indicates the average value of 100*ΔT2m/T2mbef and 100*ΔG/Gbef, while vertical and horizontal solid lines indicate the associated standard deviation in the vertical and horizontal direction
Fig. 7
Fig. 7
Qualitative effect of chest physiotherapy on sputum nanostructure deduced by the percentage variation of the relaxation time (100*ΔT2m/T2mbef) and the relative percentage variation of the shear modulus (100*ΔG/Gbef) (sections I–IV are those of Fig. 6). Depending on the relative variation of T2m and G, different mucus nanostructures can be supposed
Fig. 8
Fig. 8
Nanostructure of CF sputum. The complexity of CF nanostructure is increased by the presence of DNA, cell debris and bacteria (not visible in this figure). ( Adapted from Ref [58] with permission from FutureScience)
Fig. 9
Fig. 9
Variation of the average mesh size (ξa) for the 21 samples considered (black circles, before chest physiotherapy; white circles after chest physiotherapy). Grey circles indicate the relative percentage variation of the average mesh size ξa (secondary vertical axis)
Fig. 10
Fig. 10
Comparison between the continuous mesh size distribution before (solid black curve) and after (dashed black line) chest physiotherapy referring to samples 11 (see Table 1). Solid grey vertical lines (secondary vertical axis on the right) indicate the discrete mesh size distribution referring the solid black curve. Dashed grey vertical lines (secondary vertical axis on the right) indicate the discrete mesh size distribution referring the dashed black curve
Fig. 11
Fig. 11
Drug profile concentration (C/C0, solid line) inside ASL thickness at different times according to Eq. (16) assuming δ = 3 μm. The drug diffusion coefficient has been evaluated according to Eq. (17) assuming φ = 0.05, rs = 1.1 nm, D0 = 3 × 10−10 m2/s and A Y = 3 (D = 2.5 × 10−10 m2/s) or B Y = 30 (D = 0.6 × 10−10 m2/s)
Fig. 12
Fig. 12
A Variation of the ratio D/D0 according to Eq. (18) and B Eq. (19) assuming different values of the ratio between the drug molecule radius (rs) and the radius (rf) of the fibres constituting the polymeric network pervading the hydrogel. These simulation refer to a cubical mesh organization (C0 = 1; C1 = 3π [33])

References

    1. Farrell PM. The prevalence of cystic fibrosis in the European Union. J Cyst Fibros. 2008;7:450–453. doi: 10.1016/j.jcf.2008.03.007. - DOI - PubMed
    1. Ciofu O, Tolker-Nielsen T, Jensen PO, Wang H, Hoiby N. Antimicrobial resistance, respiratory tract infections and role of biofilms in lung infections in cystic fibrosis patients. Adv Drug Deliv Rev. 2015;85:7–23. doi: 10.1016/j.addr.2014.11.017. - DOI - PubMed
    1. Cystic Fibrosis Foundation Patient Registry 2014 Annual Data Report, Bethesda, Maryland, 2015 Cystic Fibrosis Foundation; Cystic Fibrosis Foundation Patient Registry 2019 Annual Data Report, Bethesda, Maryland, 2020 Cystic Fibrosis Foundation.
    1. Emerson J, Rosenfeld M, McNamara S, Ramsey B, Gibson RL. Pseudomonas aeruginosa and other predictors of mortality and morbidity in young children with cystic fibrosis. Pediatr Pulmonol. 2002;34:91–100. doi: 10.1002/ppul.10127. - DOI - PubMed
    1. Fyfe JA, Govan JR. Alginate synthesis in mucoid Pseudomonas aeruginosa: a chromosomal locus involved in control. J Gen Microbiol. 1980;119:443–450. doi: 10.1099/00221287-119-2-443. - DOI - PubMed

Publication types