

Single Molecule Fingerprinting Reveals Different Amplification Properties of α-Synuclein Oligomers and Preformed Fibrils in Seeding Assay
- PMID: 35286811
- PMCID: PMC8990999
- DOI: 10.1021/acschemneuro.1c00553
Single Molecule Fingerprinting Reveals Different Amplification Properties of α-Synuclein Oligomers and Preformed Fibrils in Seeding Assay
Abstract
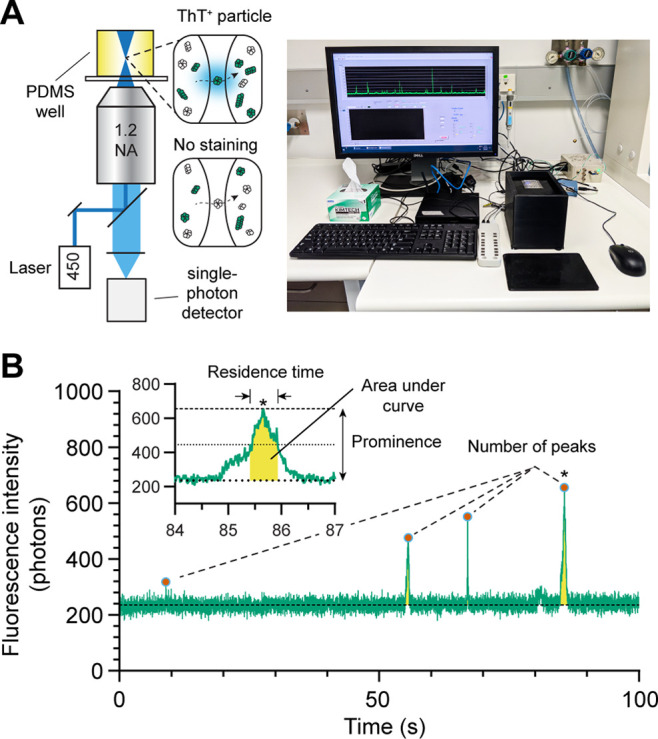
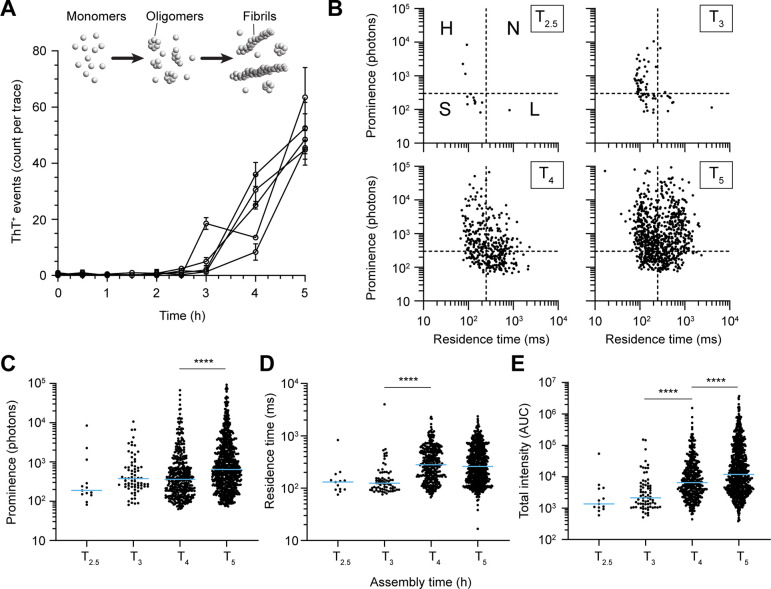
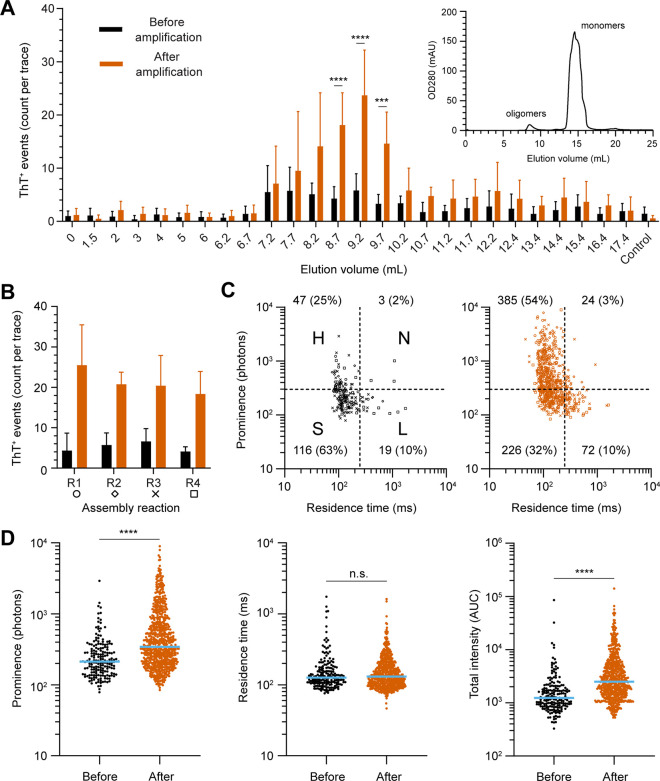
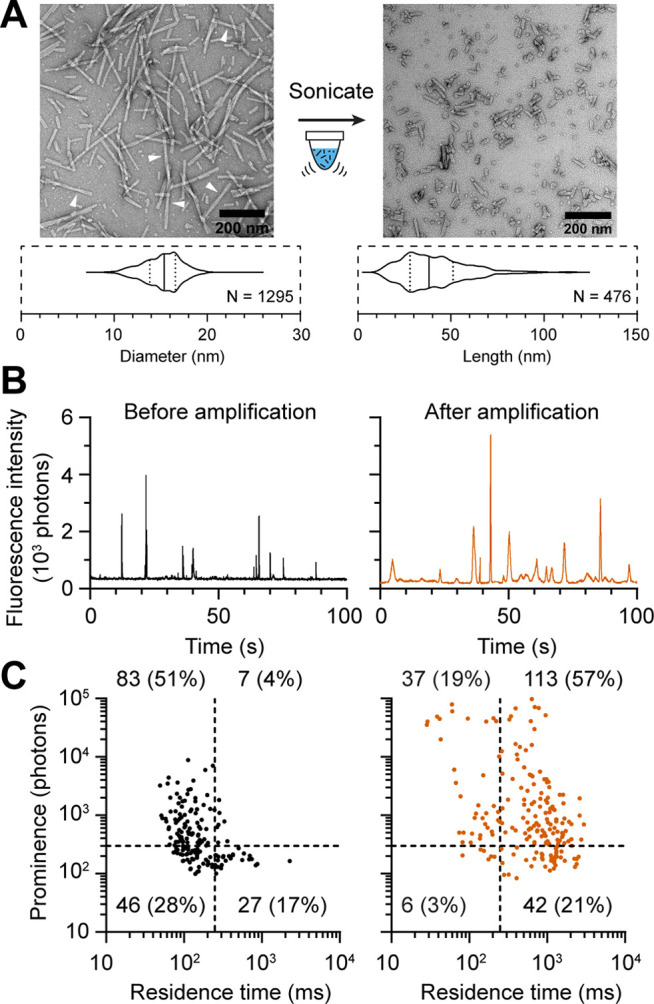
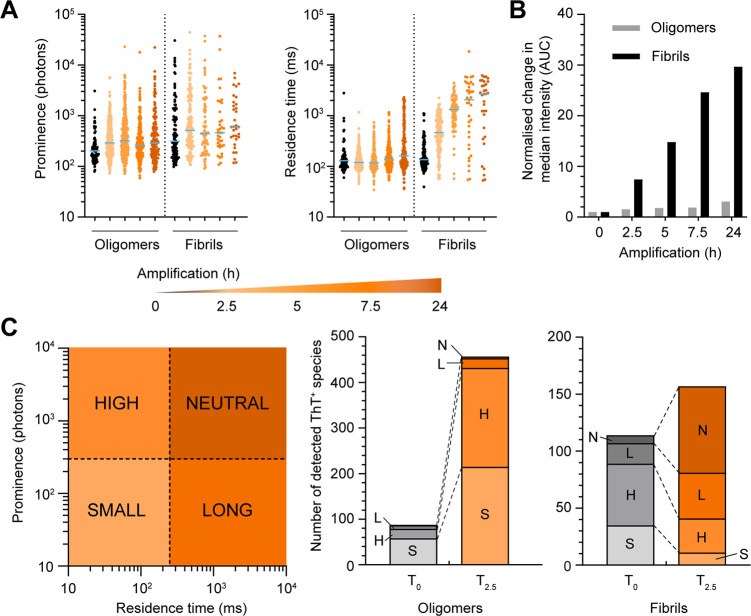
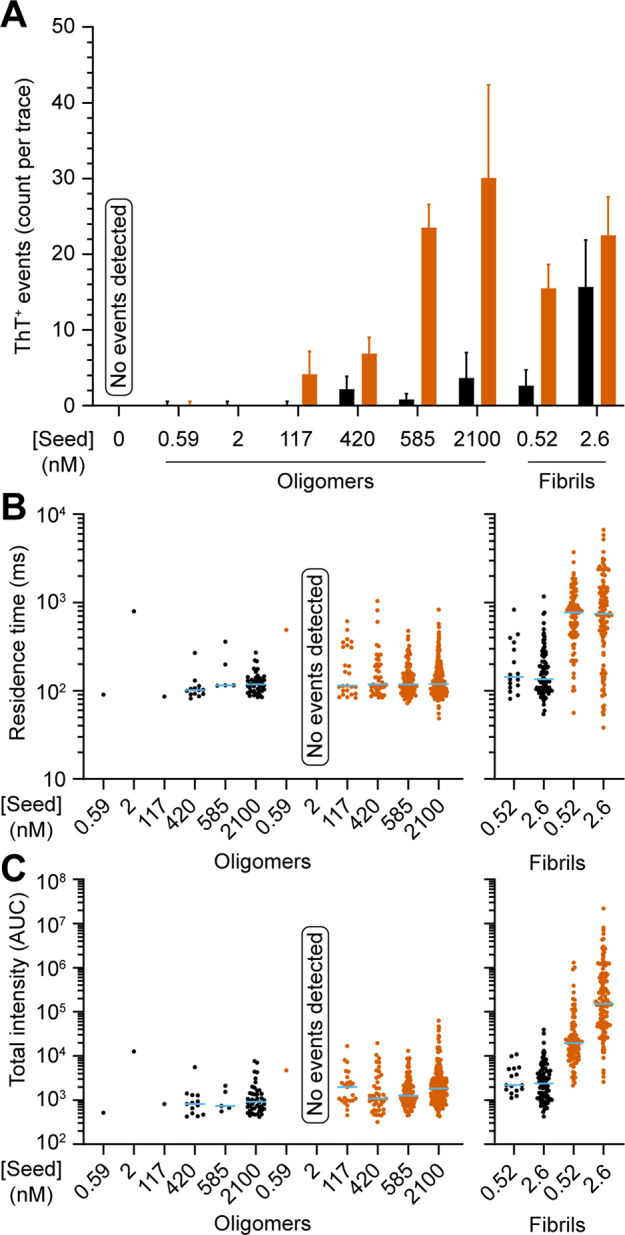
The quantification of α-synuclein aggregates has emerged as a promising biomarker for synucleinopathies. Assays that amplify and detect such aggregates have revealed the presence of seeding-competent species in biosamples of patients diagnosed with Parkinson's disease. However, multiple species, such as oligomers and amyloid fibrils, are formed during the aggregation of α-synuclein; these species are likely to coexist in biological samples, and thus it remains unclear which species(s) are contributing to the signal detected in seeding assays. To identify individual contributions to the amplification process, recombinant oligomers and preformed fibrils were produced and purified to characterize their individual biochemical and seeding potential. Here, we used single molecule spectroscopy to track the formation and purification of oligomers and fibrils at the single particle level and compare their respective seeding potential in an amplification assay. Single molecule detection validates that size-exclusion chromatography efficiently separates oligomers from fibrils. Oligomers were found to be seeding-competent, but our results reveal that their seeding behavior is very different compared to that of preformed fibrils, in our amplification assay. Overall, our data suggest that even a low number of preformed fibrils present in biosamples is likely to dominate the response in seeding assays.
Keywords: PMCA; Parkinson’s disease; RT-QuIC; oligomers; preformed fibrils; protein misfolding cyclic amplification assay; real time quaking induced conversion; seed amplification assay; single molecule detection; α-Synuclein.
Conflict of interest statement
The authors declare the following competing financial interest(s): Y.G. and E.S. are founders of AttoQuest and inventors of the AttoBright instrument (PCT AU2019/050188).
Figures

Similar articles
-
Single-Molecule Fingerprinting Reveals Different Growth Mechanisms in Seed Amplification Assays for Different Polymorphs of α-Synuclein Fibrils.ACS Chem Neurosci. 2024 Sep 18;15(18):3270-3285. doi: 10.1021/acschemneuro.4c00185. Epub 2024 Aug 28. ACS Chem Neurosci. 2024. PMID: 39197832 Free PMC article.
-
Toward the quantification of α-synuclein aggregates with digital seed amplification assays.Proc Natl Acad Sci U S A. 2024 Jan 16;121(3):e2312031121. doi: 10.1073/pnas.2312031121. Epub 2024 Jan 9. Proc Natl Acad Sci U S A. 2024. PMID: 38194461 Free PMC article.
-
Discriminating α-synuclein strains in Parkinson's disease and multiple system atrophy.Nature. 2020 Feb;578(7794):273-277. doi: 10.1038/s41586-020-1984-7. Epub 2020 Feb 5. Nature. 2020. PMID: 32025029 Free PMC article.
-
Seeding amplification assay: Limitations and insights for enhanced clinical and research applications.J Parkinsons Dis. 2025 May;15(3):447-458. doi: 10.1177/1877718X251325124. Epub 2025 Mar 2. J Parkinsons Dis. 2025. PMID: 40025787 Review.
-
Seeding Aggregation Assays in Lewy Bodies Disorders: A Narrative State-of-the-Art Review.Int J Mol Sci. 2024 Oct 7;25(19):10783. doi: 10.3390/ijms251910783. Int J Mol Sci. 2024. PMID: 39409112 Free PMC article. Review.
Cited by
-
Single-Molecule Fingerprinting Reveals Different Growth Mechanisms in Seed Amplification Assays for Different Polymorphs of α-Synuclein Fibrils.ACS Chem Neurosci. 2024 Sep 18;15(18):3270-3285. doi: 10.1021/acschemneuro.4c00185. Epub 2024 Aug 28. ACS Chem Neurosci. 2024. PMID: 39197832 Free PMC article.
-
Selectivity of Lewy body protein interactions along the aggregation pathway of α-synuclein.Commun Biol. 2021 Sep 23;4(1):1124. doi: 10.1038/s42003-021-02624-x. Commun Biol. 2021. PMID: 34556785 Free PMC article.
-
Dynamic PRC1-CBX8 stabilizes a porous structure of chromatin condensates.Nat Struct Mol Biol. 2025 Mar;32(3):520-530. doi: 10.1038/s41594-024-01457-6. Epub 2025 Jan 15. Nat Struct Mol Biol. 2025. PMID: 39815045 Free PMC article.
-
Toward the quantification of α-synuclein aggregates with digital seed amplification assays.Proc Natl Acad Sci U S A. 2024 Jan 16;121(3):e2312031121. doi: 10.1073/pnas.2312031121. Epub 2024 Jan 9. Proc Natl Acad Sci U S A. 2024. PMID: 38194461 Free PMC article.
-
Current Status of α-Synuclein Biomarkers and the Need for α-Synuclein PET Tracers.Cells. 2025 Aug 18;14(16):1272. doi: 10.3390/cells14161272. Cells. 2025. PMID: 40862750 Free PMC article. Review.
References
-
- Polymeropoulos M. H.; Lavedan C.; Leroy E.; Ide S. E.; Dehejia A.; Dutra A.; Pike B.; Root H.; Rubenstein J.; Boyer R.; Stenroos E. S.; Chandrasekharappa S.; Athanassiadou A.; Papapetropoulos T.; Johnson W. G.; Lazzarini A. M.; Duvoisin R. C.; Di Iorio G.; Golbe L. I.; Nussbaum R. L. Mutation in the alpha-synuclein gene identified in families with Parkinson’s disease. Science 1997, 276 (5321), 2045–7. 10.1126/science.276.5321.2045. - DOI - PubMed
-
- Winner B.; Jappelli R.; Maji S. K.; Desplats P. A.; Boyer L.; Aigner S.; Hetzer C.; Loher T.; Vilar M.; Campioni S.; Tzitzilonis C.; Soragni A.; Jessberger S.; Mira H.; Consiglio A.; Pham E.; Masliah E.; Gage F. H.; Riek R. In vivo demonstration that alpha-synuclein oligomers are toxic. Proc. Natl. Acad. Sci. U. S. A. 2011, 108 (10), 4194–9. 10.1073/pnas.1100976108. - DOI - PMC - PubMed
Publication types
MeSH terms
Substances
LinkOut - more resources
Full Text Sources
Medical
Research Materials
