. 2022 May:51:102280.
doi: 10.1016/j.redox.2022.102280. Epub 2022 Mar 8.

Theranostic F-SLOH mitigates Alzheimer's disease pathology involving TFEB and ameliorates cognitive functions in Alzheimer's disease models

Affiliations

Theranostic F-SLOH mitigates Alzheimer's disease pathology involving TFEB and ameliorates cognitive functions in Alzheimer's disease models

Ashok Iyaswamy et al. Redox Biol. 2022 May.

Abstract

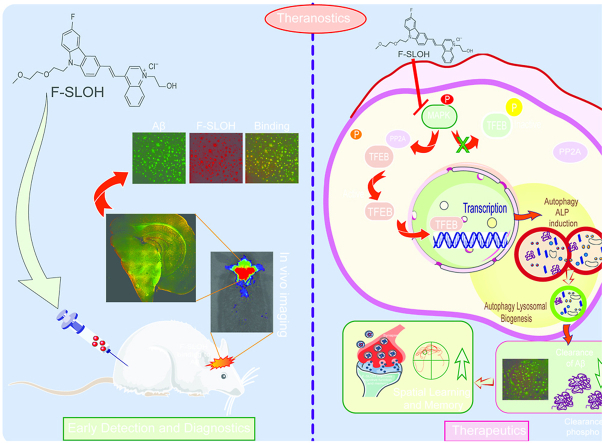
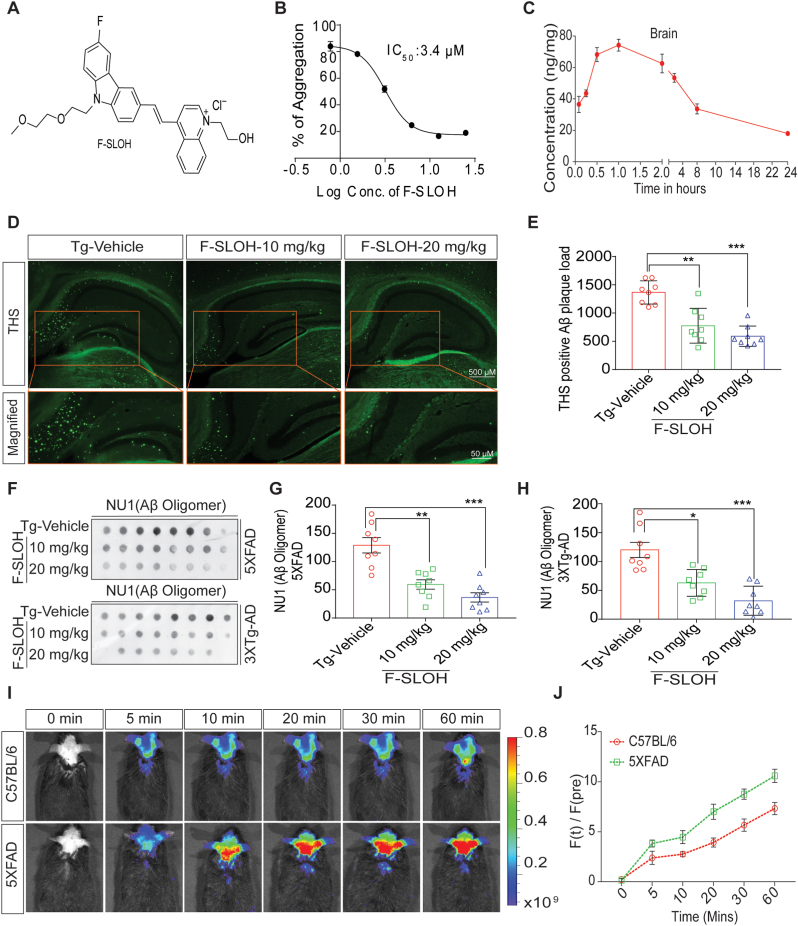
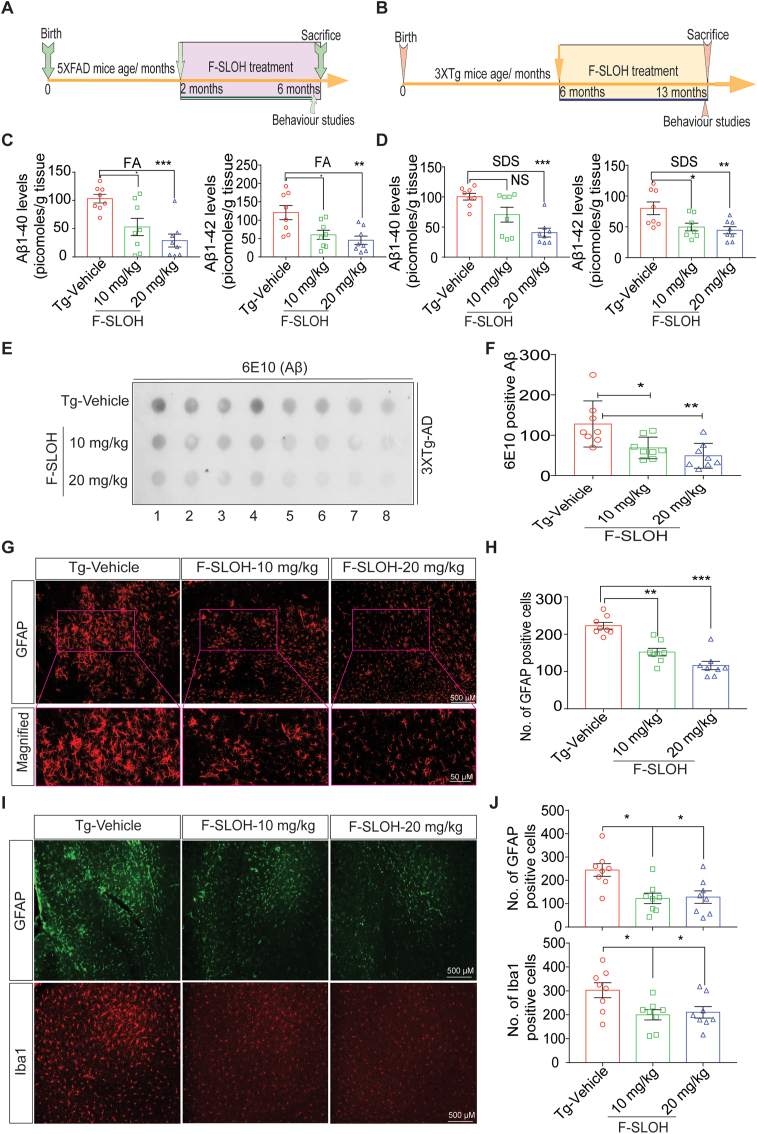
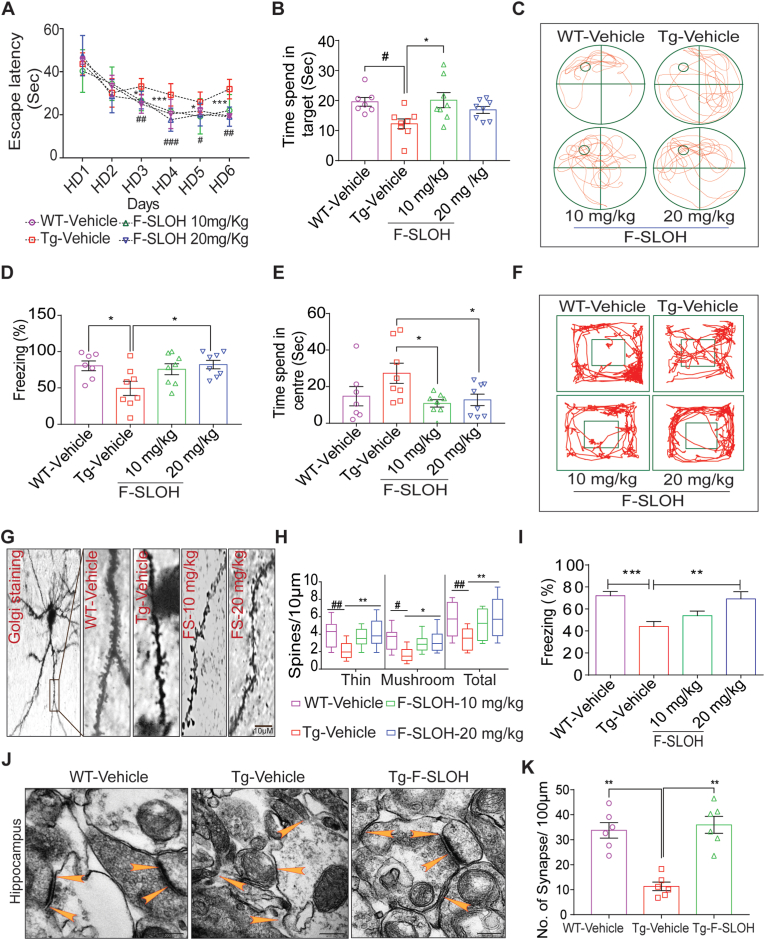
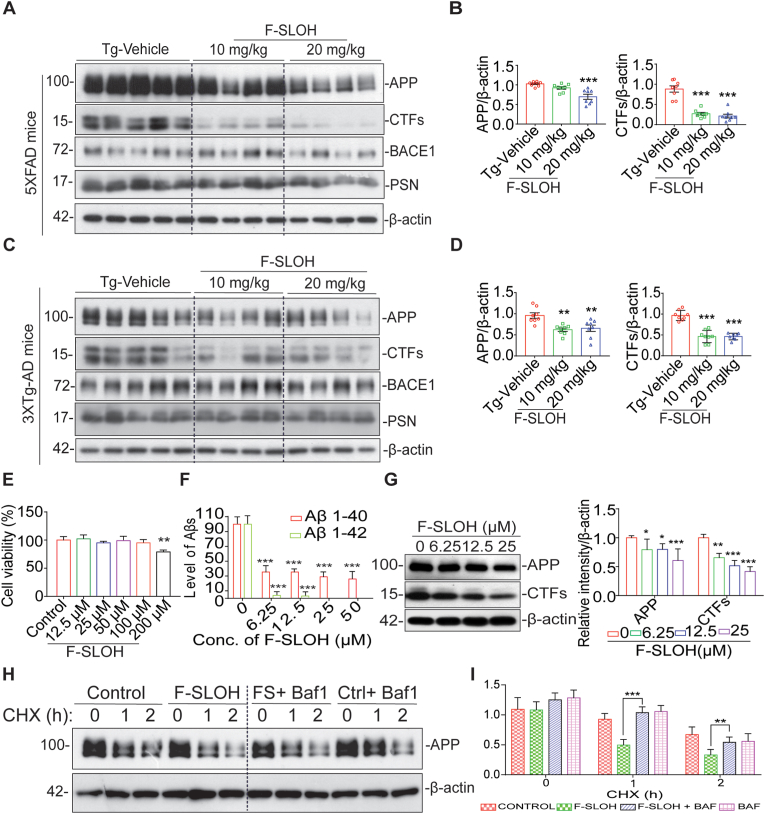
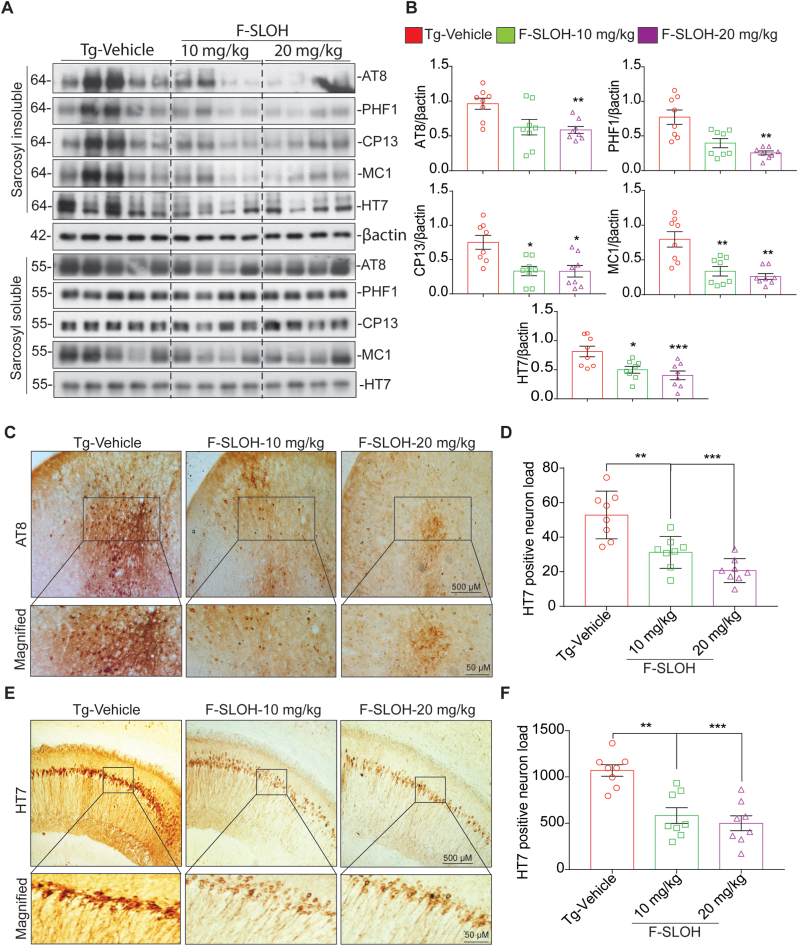
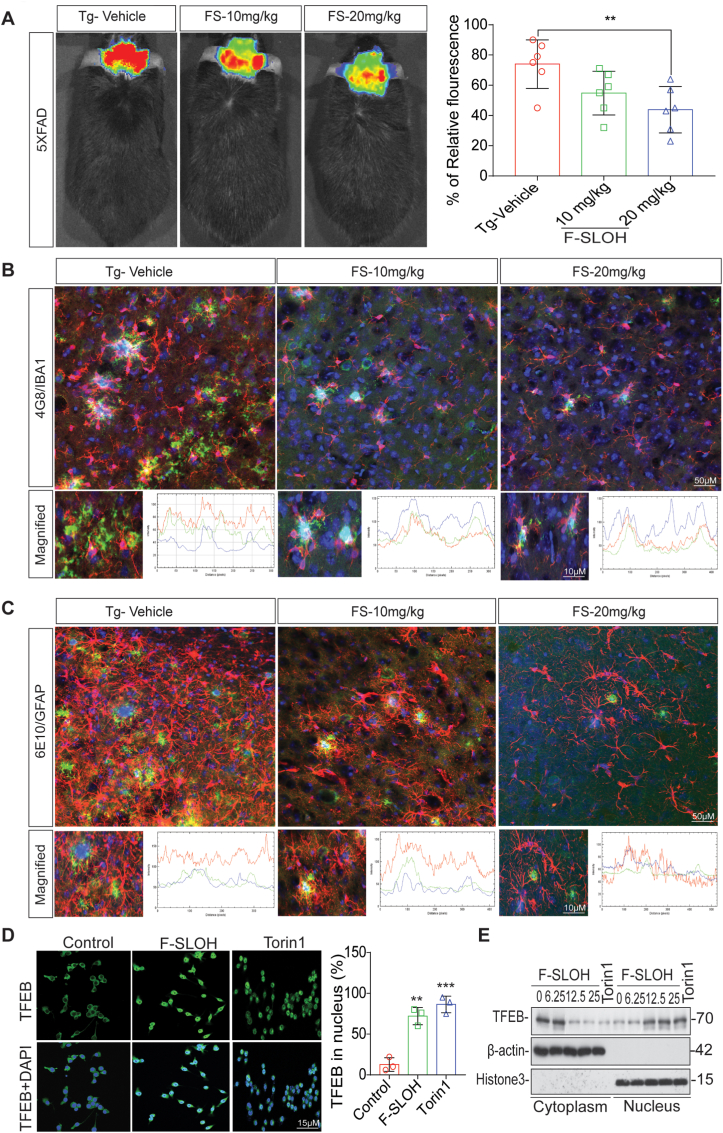
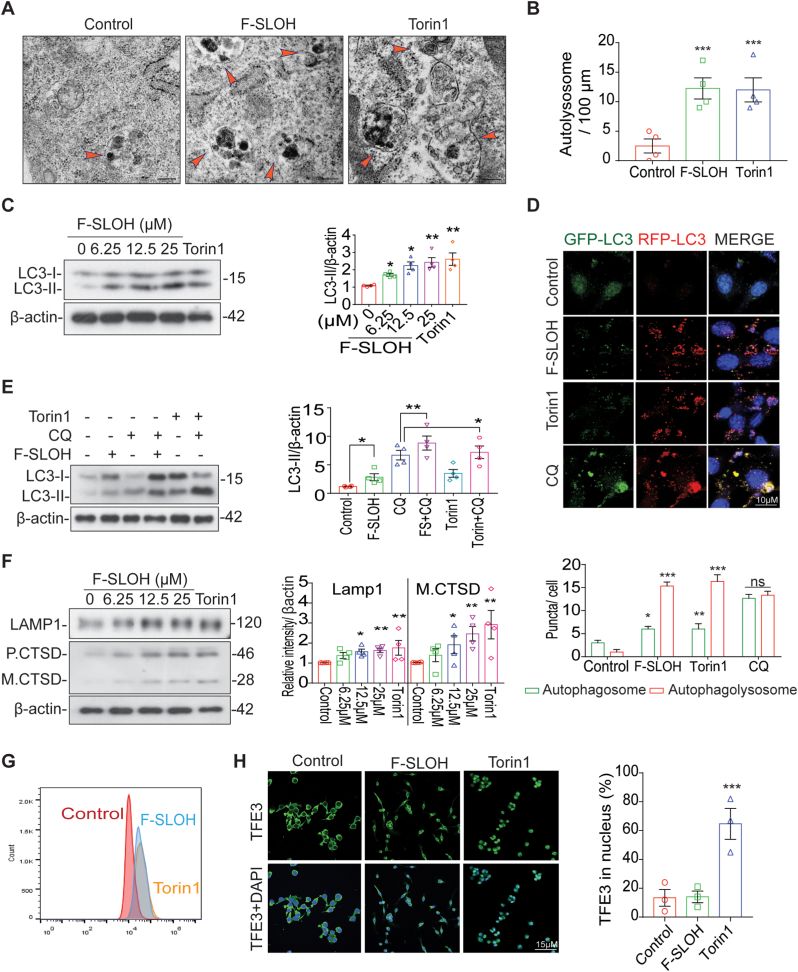
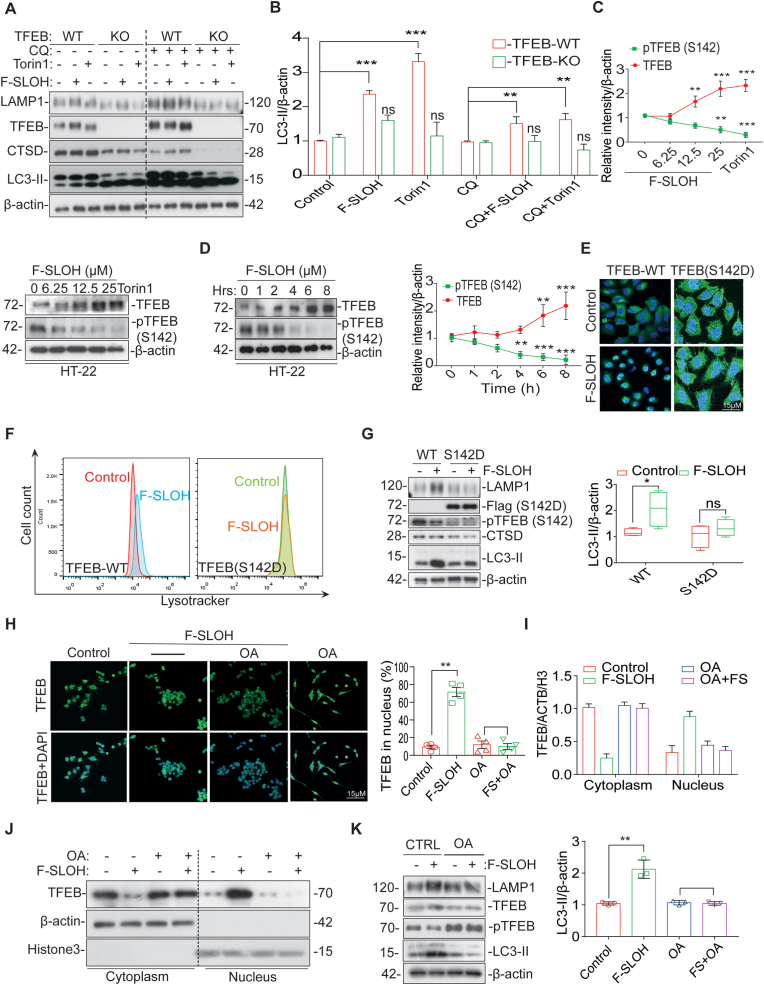
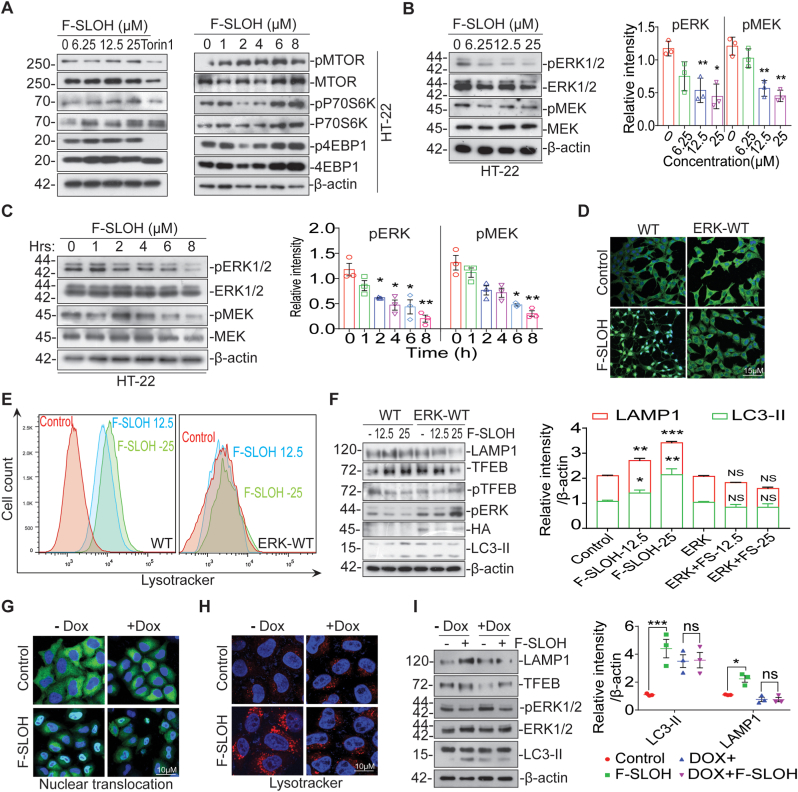
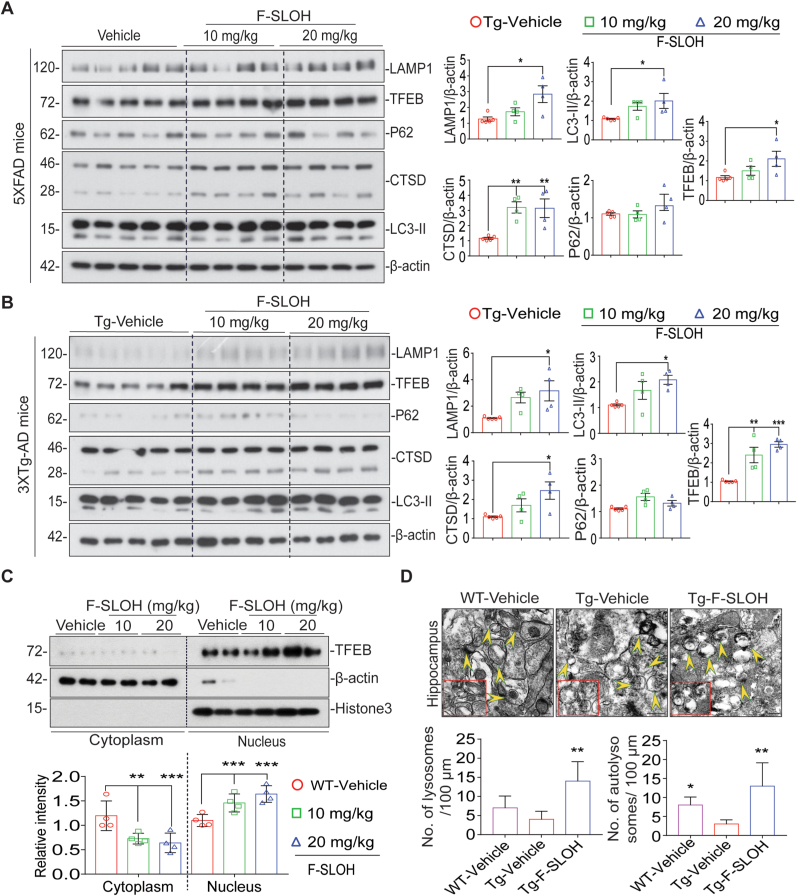
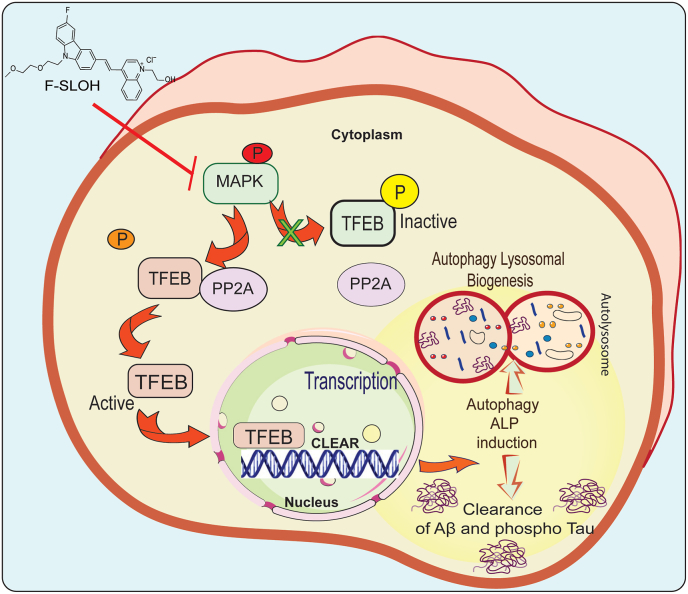
Accumulation of amyloid-β (Aβ) oligomers and phosphorylated Tau aggregates are crucial pathological events or factors that cause progressive neuronal loss, and cognitive impairments in Alzheimer's disease (AD). Current medications for AD have failed to halt, much less reverse this neurodegenerative disorder; therefore, there is an urgent need for the development of effective and safe drugs for AD therapy. In the present study, the in vivo therapeutic efficacy of an Aβ-oligomer-targeted fluorescent probe, F-SLOH, was extensively investigated in 5XFAD and 3XTg-AD mouse models. We have shown that F-SLOH exhibits an efficient inhibitory activity against Aβ aggregation in vivo, and acts as an effective theranostic agent for the treatment of multiple neuropathological changes in AD mouse models. F-SLOH has been found to significantly reduce not only the levels of Aβ oligomers, Tau aggregates and plaques but also the levels of amyloid precursor protein (APP) and its metabolites via autophagy lysosomal degradation pathway (ALP) in the brains of 5XFAD and 3XTg-AD mice. It also reduces astrocyte activation and microgliosis ultimately alleviating neuro-inflammation. Furthermore, F-SLOH mitigates hyperphosphorylated Tau aggregates, synaptic deficits and ameliorates synaptic memory function, and cognitive impairment in AD mouse models. The mechanistic studies have shown that F-SLOH promotes the clearance of C-terminal fragment 15 (CTF15) of APP and Paired helical filaments of Tau (PHF1) in stable cell models via the activation of transcription factor EB (TFEB). Moreover, F-SLOH promotes ALP and lysosomal biogenesis for the clearance of soluble, insoluble Aβ, and phospho Tau. Our results unambiguously reveal effective etiological capabilities of theranostic F-SLOH to target and intervene multiple neuropathological changes in AD mouse models. Therefore, F-SLOH demonstrates tremendous therapeutic potential for treating AD in its early stage.

Keywords: 3XTg-AD; 5XFAD; Alzheimer's disease; Aβ-aggregate inhibition; Aβ-targeting; Theranostic.


Conflict of interest statement

The authors declare that they do not have any known competing financial interests and that personal relationships did not influence the research work reported in this manuscript.

Figures

Image 1
Graphical abstract
Fig. 1
Fig. 1
F-SLOH binds to Aβ species, inhibits Aβ fibrillation in vitro and reduces Aβ monomers, oligomers and plaques in preclinical AD animal models. (A) Chemical structure of F-SLOH. (B) F-SLOH dose-dependently inhibited the fibril formation of Aβ in the ThT anti-Aβ fibrillation fluorescence assay. The IC50 value of anti-fibrillation activity of F-SLOH is 3.4 μm. (C) Pharmacokinetic properties of F-SLOH. Concentration vs time after intraperitoneal administration at a dose of 20 mg/kg/d in brain tissue of ICR mice (N = 4). (D) F-SLOH treatment mitigates ThS-positive Aβ plaques in 5XFAD brain slice. F-SLOH (10 and 20 mg/kg) treatment reduces the ThS-positive plaques in 5XFAD mice when compared to Tg-vehicle and (E) its corresponding quantification. (F) Levels of NU1 (Aβ oligomer) presented in the dot blot representing treatment effects of F-SLOH (10 and 20 mg/kg) and its corresponding quantification of Aβ oligomers found in the brain lysates of (G) 5XFAD and (H) 3XTg-AD mice. Quantified data presented as mean ± SEM. N = 8. (I) Intra-peritoneal (IP) injection of F-SLOH (20 mg/kg) in 5XFAD mice and WT mice were observed using in vivo imaging in small animal imaging system (J) and its corresponding quantification.
Fig. 2
Fig. 2
F-SLOH reduces astrocytic activation and microgliosis and ameliorates neuroinflammation in the brains of AD model mice. Timeline of F-SLOH treatment and behaviour experiment schedule for (A) 5XFAD and (B) 3XTg-AD transgenic mice. (C) F-SLOH treatment reduced Aβ1-40 and Aβ1-42 levels in the formic acid soluble brain lysates and its corresponding quantification in 5XFAD mice. (D) F-SLOH treatment reduced Aβ1-40 and Aβ1-42 levels in the SDS soluble brain lysates and its corresponding quantification in 5XFAD mice. (E) The protein levels of 6E10 (Aβ) presented in the dot blot representing treatment effects of F-SLOH (10 and 20 mg/kg) (F) and its corresponding quantification in 3XTg-AD mice brain lysates. (G) F-SLOH treatment (10 and 20 mg/kg) reduced the GFAP positive reactive astrocytes in the brain slice of 5XFAD transgenic mice and (H) its corresponding quantification (I) Chronic treatment of F-SLOH (10 and 20 mg/kg) reduced the levels GFAP and Iba1 positive reactive glial cells and reactive astrocytes in the brain slices and (J) its corresponding quantification of 3XTg-AD mice. Quantified data presented as mean ± SEM. N = 8.
Fig. 3
Fig. 3
F-SLOH treatment improves spatial learning, memory function and augments synapse formation in AD mouse models. (A) F-SLOH-treated 3XTg-AD mice improved the spatial escape rate and decreased the escape latency during the learning period of six days in Morris water maze test when compared to the Tg-Vehicle group (N = 8). (B) F-SLOH-treated mice probed the platform placed quadrant for longer time when compared to the vehicle-treated Tg mice in the probe trial. (C) The images illustrate the animal's behaviour on the probe trial using video tracking software. (D) F-SLOH improves hippocampal-dependent memory and memory in F-SLOH-treated 3XTg-AD mice in comparison to the vehicle-treated Tg mice using contextual fear conditioning. (E) F-SLOH treatment improved exploratory behaviour and locomotor activity in open field experiment when compared to the Tg-Vehicle and its corresponding quantification. (F) Images illustrating the animal's locomotor behaviour in open field experiment using video tracking software. (G) Golgi staining of brain hippocampal slice from the F-SLOH-treated 3XTg-AD mice and Tg vehicle. (H) Data show an increase in thin and mushroom structures of spines along with total length of the spines when compared between the Tg-vehicle group and F-SLOH treatment (10 and 20 mg/kg) groups in a dose-dependent manner, indicating improved spinogenesis. (I) F-SLOH improved hippocampal-dependent memory in F-SLOH-treated 5XFAD mice when compared to the vehicle-treated Tg mice using contextual fear conditioning. (J) F-SLOH treatment ameliorates hippocampal-dependent synapse formation in the brain slices of 5XFAD mice. The ultrastructure of the synapse displayed in electron micrograph indicates that F-SLOH treatment improved the synapse formation in comparison to the vehicle-treated Tg group. (K) Quantification of number of synapses in the brain slice of 5XFAD mice. Quantified data presented as mean ± SEM. N = 8.
Fig. 4
Fig. 4
F-SLOH alleviates APP processing in AD mouse models. (A) F-SLOH treatment (10 and 20 mg/kg) reduces the protein expression levels of FL-APP and CTFs in the brain lysates of 5XFAD mice shown in immunoblot (B) and its corresponding quantification. (C) Chronic F-SLOH treatment reduced the protein expression levels of FL-APP and CTFs in the brain lysates of 3XTg-AD mice independent of BACE1, presenilin inhibition are shown in immunoblot and (D) its corresponding quantification. Quantified data presented as mean ± SEM. N = 8. (E) The cell viability test of F-SLOH on N2a cells overexpressing APP695 (N2a-APP) was determined using the MTT and its corresponding quantification. (F) F-SLOH treatment (6.25, 12.5, 25 and 50 μM) reduced the Aβ1-40 and Aβ1-42 protein expression levels in the cell media and its corresponding quantification. Each data represents the average of three replicates. (G) F-SLOH treatment (6.25, 12.5 and 25 μM) in N2a-APP cells significantly reduced the protein expression levels of FL-APP and CTFs and its representative blots are shown with its corresponding quantification. (H) F-SLOH mediated reduction of full-length APP were significantly blocked after BafA1 treatment at the indicated timepoint of CHX treatment in N2a-APP cells and its representative blots are shown with its (I) corresponding quantification. Each data represents the average of three replicates and data represented as mean ± SEM.
Fig. 5
Fig. 5
F-SLOH mitigates tau pathology in 3XTg-AD mouse model. (A) Chronic F-SLOH treatment reduced the insoluble phospho Tau protein expression levels of PHF1, CP13, MC1, AT8, and HT7 in the brain lysates of 3XTg-AD mice but not the soluble phospho Tau are shown in immunoblot and (B) its corresponding quantification. (C&E) F-SLOH treatment mitigates AT8 and HT7 positive neuronal load in 3XTg-AD mice brain slice. F-SLOH (10 and 20 mg/kg) treatment reduces the AT8 and HT7 positive neuronal load in 3XTg-AD mice when compared to Tg-vehicle and (D&F) its corresponding quantification. Quantified data presented as mean ± SEM. N = 8.
Fig. 6
Fig. 6
Recruitment of microglia and astrocytes is required for the reduction of Aβ plaques in AD mouse models. (A) In vivo imaging of the animals to show the NIR fluorescence images of AD animals after the long-term treatment of F-SLOH and Tg-Vehicle and its quantification. (B) F-SLOH (10 and 20 mg/kg) treatment decreases 4G8 labelled Aβ plaque size and recruitment of Iba1 positive microglia in 5XFAD mice brain slice when compared to Tg-vehicle and its quantification. (C) F-SLOH (10 and 20 mg/kg) treatment decreases 6E10 labelled Aβ plaque size and recruitment of GFAP positive astrocytes in 5XFAD mice brain slice when compared to Tg-vehicle and its quantification. (D) F-SLOH (25 μM) or Torin 1 (250 nm) treatment in microglia cells for 24 h translocated TFEB in nucleus were stained and pictured in confocal microscope and its corresponding quantification. (E) F-SLOH (6.25,12.5 and 25 μM) or a positive control Torin 1 treatment in microglia cells at indicated concentrations for 24 h translocated the protein levels of cytosol TFEB to the nuclear TFEB shown in immunoblots.
Fig. 7
Fig. 7
F-SLOH activates transcription factor EB (TFEB) promoting autophagy and lysosomal biogenesis in cellular models. (A&B) The ultrastructure of the autolysosome displayed in electron micrograph indicates that F-SLOH treatment in the HT-22 cells increased the lysosome number and autolysosome formation in comparison to the control and Torin1. (C) HT-22 (6.25, 12.5 and 25 μM) cells were treated with F-SLOH or Torin1 for 24 h increased the protein expression levels of LC3B-II using western blotting and its corresponding quantification. (D) The HT-22 cells were transfected with stably expressing tf-LC3 plasmids for 48 h and then treated with F-SLOH (25 μM) for 24 h and compared with Torin 1 and the lysosomal inhibitor chloroquine (CQ)(20 μM). The stained cells were pictured using confocal microscope. The autolysosome and autophagosome puncta in the HT-22 cells were quantified accordingly. (E) F-SLOH and Torin1 were treated in HT-22 cells for 24 h in the presence or absence of CQ. F-SLOH treatment increased the protein expression levels of LC3B-II and its corresponding quantification. (F) F-SLOH treatment in HT-22 cells for 24 h increased the protein expression levels of LAMP1 and mature Cathepsin D in a dose-dependent manner and its corresponding quantification. (G) F-SLOH or Torin1 treatment in HT-22 cells for 24 h and the cells were incubated with LysoTracker Green DND-99 (75 nm) for 1 h. The stained cells were detected using flow cytometer and its quantified data is shown in figure. (H) F-SLOH (25 μM) or Torin1 treatment in microglial cells for 24 h were stained for TFE3 protein expression and pictured in confocal microscope and its corresponding quantification. (For interpretation of the references to colour in this figure legend, the reader is referred to the Web version of this article.)
Fig. 8
Fig. 8
TFEB is essential for F-SLOH-induced autophagy activation and lysosomal biogenesis. (A) Wild type HeLa and TFEB knockout (KO) cells were treated with F-SLOH (25 μM) Torin1 (250 nM) for 24 h in the presence or absence of CQ (20 μM). The blots show the protein expression levels of LC3B-II and (B) its corresponding quantification. (C) In HT-22 cells different concentrations of F-SLOH (6.25,12.5,25 μM) or 25 μM of F-SLOH (D) at different durations (0–8 h). There was pronounced gel-shift of endogenous TFEB indicating that F-SLOH caused TFEB dephosphorylation and reduced pTFEB (S142) in both dose- and time-dependent manner. (E) TFEB (WT) or TFEB (S142D) mutant plasmid were transfected in HT-22 cells and treated with F-SLOH (25 μM) for 24h, cells were incubated with LysoTracker Green DND-99 (50 nm) for 1h to assess lysotracker positive cells. F-SLOH increased the lysosome contents in TFEB (WT) and blocked the increase of lysosome in the TFEB (S142D) mutant HT-22 cells as detected by flow cytometer. (F) F-SLOH treatment in HeLa cells were transfected with TFEB (S142D) mutant plasmid blocking the nuclear translocation of TFEB. The pictures depict the number of cells with nuclear TFEB and the mutant-blocked cells with TFEB staining were quantified. (G) F-SLOH treatment for 24 h in HT-22 cells transfected with TFEB (WT) or TFEB (S142D) mutant plasmid were assessed for the protein expression levels of autophagy markers. TFEB (S142D) mutant blocked the increase of F-SLOH-induced protein expression levels of autophagy markers namely LAMP1, CTSD and LC3B-II as compared to the TFEB (WT) counterparts. (H) Okadaic acid (OA) blocked the endogenous TFEB translocation into the nucleus on treatment with F-SLOH (25 μM). Pre-treatment of microglial cells with OA for 30 min followed by F-SLOH treatment to the cells for another 24h, the nuclear translocation of TFEB were detected by confocal microscopy. (I&J) OA blocked the F-SLOH induced TFEB translocation in microglia cells at indicated concentrations for 24 h as shown in immunoblots. (K) OA blocked the increase of F-SLOH-induced protein expression levels of autophagy markers namely LAMP1, TFEB and LC3B-II in microglial cells. Each data point represents the average of three replicates and represented as mean ± SEM. (For interpretation of the references to colour in this figure legend, the reader is referred to the Web version of this article.)
Fig. 9
Fig. 9
MAPK1 is essential for F-SLOH-induced activation of TFEB and autophagy lysosomal biogenesis rather than MTOR and its substrates. (A) F-SLOH treatment did not inhibit the MTOR signalling pathway and F-SLOH dephosphorylated TFEB independent of MTOR pathway. F-SLOH treatment in HT-22 cells for 24 h or F-SLOH treatment at different time points did not inhibit the protein expression levels of p-MTOR, p-P70S6K and p-4EBP1 as shown by immunoblots. (B) In HT-22 cells, different concentrations of F-SLOH (6.25, 12.5 and 25 μM) or 25 μM of F-SLOH at various time points (0–8 h). (C) There was a clear inhibition of MAPK kinases namely pERK1/2 and pMEK which triggered TFEB dephosphorylation at the S142 site of TFEB in both dose- and time-dependent manner. (D) HT-22 cells were transfected with WT or ERK-WT plasmid and treated with F-SLOH (25 μM). ERK overexpression blocked the F-SLOH-activated TFEB translocation. The pictures depict the immunostaining of TFEB translocation in nucleus and its corresponding quantification. (E) HT-22 cells were transfected with WT or ERK-WT plasmid and treated with F-SLOH (25 μM) for 24 h. F-SLOH induced the increase in lysosome contents in WT cells and the ERK-WT overexpression blocked the increase of lysosome in HT-22 cells. The treated cells were incubated with LysoTracker Green (50 nm) for 1 h as shown by flow cytometry. (F) HT-22 cells were transfected with WT or ERK-WT plasmid and were treated with F-SLOH (12.5 and 25 μM) for 24 h and assessed for the protein expression levels of autophagy markers. F-SLOH treatment in ERK-WT overexpressed cells blocked the increase in protein expression levels of CTSD, LAMP1 and LC3B-II as compared to the WT and quantified accordingly. (G) Cells were treated with F-SLOH in the absence or presence of Doxycycline. Doxycycline treatment blocked the F-SLOH activated TFEB translocation in the cells as shown in the pictures using immunostaining and the nuclear translocation of TFEB was quantified. (H) Doxycycline blocked the increase of lysosome in the F-SLOH treated cells incubated with LysoTracker Green (50 nm) for 1 h and was detected using flow cytometry. (I) Doxycycline pre-treatment in cells blocked the F-SLOH-induced increase of protein expression levels of LAMP1, CTSD and LC3B-II when compared to the absence of Doxycycline in cells using Western blot analysis and its corresponding quantification. Each data represents the average of three replicates and data represented as mean ± SEM. (For interpretation of the references to colour in this figure legend, the reader is referred to the Web version of this article.)
Fig. 10
Fig. 10
TFEB is essential for F-SLOH induced degradation of APP metabolites and Aβ in vitro and in vivo in AD models. (A) F-SLOH activates TFEB to promote autophagy and autophagy lysosomal pathway in 5XFAD mice. The immunoblots indicate the protein expression levels of LAMP1, CTSD, TFEB, P62 and LC3B-II and its corresponding quantification representing treatment effects of F-SLOH (10 and 20 mg/kg) in the whole brain lysate of 5XFAD mice. (B) F-SLOH activates TFEB to promote autophagy and autophagy lysosomal pathway in 3XTg-AD mice. The immunoblots indicate the protein expression levels of LAMP1, CTSD, TFEB, P62 and LC3B-II and its quantification corresponding to the treatment effects of F-SLOH (10 and 20 mg/kg) in brain lysates of 3XTg-AD mice. (C) The immunoblots indicate the protein expression levels of cytoplasmic TFEB and nuclear TFEB as compared to the ratio of β-actin and Histone 3 and its corresponding quantification representing treatment effects of F-SLOH (10 and 20 mg/kg) in the whole brain lysate of C57BL/6 mice. (D) F-SLOH treatment increased the lysosome and autolysosome formation in the brain slice in 5XFAD mice. The ultrastructure of the hippocampus displayed in electron micrograph indicated that F-SLOH treatment increased the autolysosome formation when compared to the vehicle treated Tg group. Quantification of number of lysosome and autolysosome in the brain slice of 5XFAD mice.
Fig. 11
Fig. 11
Schematic diagram indicates the mechanism of F-SLOH via activating TFEB and promoting autophagy lysosomal pathway. Schematic illustration of the mechanism of F-SLOH treatment via activation of TFEB resulting in promotion of autophagy lysosomal pathway in vitro and in vivo. Inhibition of MAPK and activation of PP2A is essential for F-SLOH-induced TFEB dephosphorylation for nuclear translocation to promote autophagy and lysosomal biogenesis in clearance of Aβ.

Similar articles

Cited by

References

    1. Hardy J. A hundred years of Alzheimer's disease research. Neuron. 2006;52:3–13. - PubMed
    1. Alzheimer's A. 2016 Alzheimer's disease facts and figures. Alzheimers Dement. 2016;12:459–509. - PubMed
    1. Brookmeyer R., Johnson E., Ziegler-Graham K., Arrighi H.M. Forecasting the global burden of Alzheimer's disease. Alzheimers Dement. 2007;3:186–191. - PubMed
    1. 2020 Alzheimer's disease facts and figures. Alzheimers Dement. 2020 - PubMed
    1. Sengoku R. Aging and Alzheimer's disease pathology. Neuropathology. 2020;40:22–29. - PubMed

Publication types