. 2022 May;18(5):1127-1151.
doi: 10.1080/15548627.2022.2045534. Epub 2022 Apr 28.

Recombinant pro-CTSD (cathepsin D) enhances SNCA/α-Synuclein degradation in α-Synucleinopathy models

Affiliations

Recombinant pro-CTSD (cathepsin D) enhances SNCA/α-Synuclein degradation in α-Synucleinopathy models

Susy Prieto Huarcaya et al. Autophagy. 2022 May.

Abstract

Parkinson disease (PD) is a neurodegenerative disorder characterized by the abnormal intracellular accumulation of SNCA/α-synuclein. While the exact mechanisms underlying SNCA pathology are not fully understood, increasing evidence suggests the involvement of autophagy as well as lysosomal deficiencies. Because CTSD (cathepsin D) has been proposed to be the major lysosomal protease involved in SNCA degradation, its deficiency has been linked to the presence of insoluble SNCA conformers in the brain of mice and humans as well as to the transcellular transmission of SNCA aggregates. We here postulate that SNCA degradation can be enhanced by the application of the recombinant human proform of CTSD (rHsCTSD). Our results reveal that rHsCTSD is efficiently endocytosed by neuronal cells, correctly targeted to lysosomes and matured to an enzymatically active protease. In dopaminergic neurons derived from induced pluripotent stem cells (iPSC) of PD patients harboring the A53T mutation within the SNCA gene, we confirm the reduction of insoluble SNCA after treatment with rHsCTSD. Moreover, we demonstrate a decrease of pathological SNCA conformers in the brain and within primary neurons of a ctsd-deficient mouse model after dosing with rHsCTSD. Boosting lysosomal CTSD activity not only enhanced SNCA clearance in human and murine neurons as well as tissue, but also restored endo-lysosome and autophagy function. Our findings indicate that CTSD is critical for SNCA clearance and function. Thus, enzyme replacement strategies utilizing CTSD may also be of therapeutic interest for the treatment of PD and other synucleinopathies aiming to decrease the SNCA burden.Abbreviations: aa: amino acid; SNCA/α-synuclein: synuclein alpha; APP: amyloid beta precursor protein; BBB: blood brain barrier; BF: basal forebrain; CBB: Coomassie Brilliant Blue; CLN: neuronal ceroid lipofuscinosis; CNL10: neuronal ceroid lipofuscinosis type 10; Corr.: corrected; CTSD: cathepsin D; CTSB: cathepsin B; DA: dopaminergic; DA-iPSn: induced pluripotent stem cell-derived dopaminergic neurons; dox: doxycycline; ERT: enzyme replacement therapy; Fx: fornix, GBA/β-glucocerebrosidase: glucosylceramidase beta; h: hour; HC: hippocampus; HT: hypothalamus; i.c.: intracranially; IF: immunofluorescence; iPSC: induced pluripotent stem cell; KO: knockout; LAMP1: lysosomal associated membrane protein 1; LSDs: lysosomal storage disorders; MAPT: microtubule associated protein tau; M6P: mannose-6-phosphate; M6PR: mannose-6-phosphate receptor; MB: midbrain; mCTSD: mature form of CTSD; neurofil.: neurofilament; PD: Parkinson disease; proCTSD: proform of CTSD; PRNP: prion protein; RFU: relative fluorescence units; rHsCTSD: recombinant human proCTSD; SAPC: Saposin C; SIM: structured illumination microscopy; T-insol: Triton-insoluble; T-sol: Triton-soluble; TEM: transmission electron microscopy, TH: tyrosine hydroxylase; Thal: thalamus.

Keywords: alpha-synuclein; cathepsin D; lysosomal degradation; lysosomal storage disorders; parkinson disease; synucleinopathies.


Conflict of interest statement

Orfo Neuro ApS develops products related to lysosomal storage disorders and enzyme replacement therapies. Authors did not receive funding from Orfo Neuro ApS for this study.

Figures

Figure 1.
Figure 1.
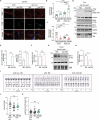
H4 cells deficient in CTSD (CTSD KO) endocytose and process extracellularly applied rHsCTSD. (A) Representative western blot and (B) quantification of CTSD signal in H4 CTSD KO cells treated with 20 µg/ml rHsCTSD for 24, 48 and 72 h. PBS was added to the media as an untreated control. Mature CTSD (~34-kDa) as well as pro- (~52-kDa) and single chain forms (~48-kDa) were normalized to loading control TUBB3 and expressed as fold change toward the 24h time point (n = 3). For a graphical overview of CTSD maturation and protein sizes refer to Figure S1A. As additional loading control, Coomassie Brilliant Blue (CBB)-stained SDS-PAGE gel was included to visualize equal protein input. (C) Fluorogenic CTSD activity assay from cell lysates analyzed immediately after harvesting. CTSD activity was normalized to the 24 h time point and expressed as fold change (n = 3). (D) Immunostaining of lysosomal marker LAMP2 (red) and CTSD (green) of control (PBS) and rHsCTSD treated H4 CTSD KO cells, representative pictures for three independent rounds of treatment. Scale bar: 10 µm. (E) Colocalization analysis of LAMP2 and CTSD determined by Pearson’s correlation coefficient and compared to PBS (n = 9–12 individual cells per group). (F) LDH cytotoxicity assay of H4 CTSD KO cells incubated with 20 µg/ml rHsCTSD for different time points and (G) with different concentrations for 72 h normalized to the positive control and expressed as fold change (n = 3). All data represent mean ± SEM. Statistical analyses were performed by using one-way ANOVA together with Dunnett’s multiple comparison test. Statistical differences are shown toward PBS treatment for (B, C and E) and toward positive control for LDH cytotoxicity assay (F and G). ****p < 0.0001, **p < 0.01, *p < 0.05; n.s., not significant.
Figure 2.
Figure 2.
rHsCTSD treatment decreases SNCA in H4 cells overexpressing SNCA (tet-off). (A) Representative immunoblot of H4 cell lysates treated with 20 µg/ml rHsCTSD for 24, 48 and 72 h. The western blot was stained for CTSD (proform ~52-kDa, single chain form ~48-kDa and mature form ~34-kDa) and SNCA utilizing the C-20 SNCA antibody. ACTB was used as loading control. (B) Quantification of immature (pro- and single chain form) and mature CTSD, normalized to ACTB (n = 3), expressed as fold change. (C) Quantification of soluble SNCA normalized to ACTB and compared to PBS treated sample (n = 3). (D) Kinetics of soluble SNCA degradation in H4 cells shown in representative immunoblot. SNCA expression was downregulated by 2 µg/ml doxycycline (Dox) in cells additionally treated with PBS (-rHsCTSD, black) or with 20 µg/ml rHsCTSD (+rHsCTSD, red) for 24, 48 and 72 h. (E) Respective analysis of SNCA levels from three individual experiments (n = 3), normalized to ACTB (slope −0.007234 ± 0.002833 for PBS; −0.01128 ± 0.003974 for +rHsCTSD). (F) Representative immunofluorescence pictures of H4 cells treated with rHsCTSD. H4 cells were stained with antibodies against SNCA (LB509; red) and CTSD (green). Scale bar: 10 µm. Quantification of (G) CTSD signal intensities and of (H) SNCA signal intensities, expressed as fold change (n = 8 individual cells per group). Data represent mean ± SEM. Statistical analyses were performed by using one-way ANOVA together with a Dunnett’s multiple comparison test with statistical differences tested to PBS treatment (B, C, G and H). For (E) two-tailed unpaired Student’s t-tests were performed at each time point . ****p < 0.0001, **p < 0.01, *p< 0.05; n.s., not significant.
Figure 3.
Figure 3.
rHsCTSD treatment decreases lysosomal SNCA and improves endo-lysosomal and autophagic system in SNCA overexpressing H4 cells. (A) Representative immunoblot of lysosomal fractions enriched from H4 cells overexpressing SNCA (tet-off). Cells were incubated with PBS, 20 µg/mL rHsCTSD or Dox for 72 h. Western blot shows LAMP2 signal and CTSD signal with pro and single chain forms (~52-kDa and ~48-kDa) as well as mature form (~34-kDa). (B) SNCA signals were detected and quantified using SNCA antibodies C-20 (top) and syn-1 (bottom). CBB-stained SDS-PAGE gel was used as protein loading control and the corresponding quantification is expressed as fold change (n =3). (C) Immunoblot of H4 SNCA cells incubated with PBS or 20 µg/ml rHsCTSD. Antibodies against lysosomal and autophagic marker LAMP1 and SQSTM1 were utilized. As loading controls GAPDH and CBB-stained SDS-PAGE gel were used. (D) Signal intensities of LAMP1 (top) and SQSTM1 (bottom) were normalized to GAPDH signals and expressed as fold change (n = 5). Representative western blot of PBS or Dox treated H4 SNCA cells is shown in Figure S3. (E) Quantification of lysosomal mass by Dextran-Cascade Blue staining, normalized to overall cell stain (Celltag700) and expressed as fold change (n = 4). (F) Lysosomal GBA activity was determined in H4 cells overexpressing SNCA after incubation with PBS, 20 µg/mL rHsCTSD or Dox for 72 h (n = 3). All data represent mean ± SEM. Statistical analyses were performed by using one-way ANOVA together with Dunnett’s multiple comparison test (B, D-F). Statistical differences are shown toward PBS treatment. **p < 0.01, *p < 0.05; n.s., not significant.
Figure 4.
Figure 4.
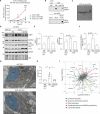
rHsCTSD treatment decreases pathology-associated SNCA in PD patients iPS-derived dopaminergic neurons (DA-iPSn) harboring an SNCA mutation (A53T). (A) Representative immunofluorescence pictures of A53T DA-iPSn and isogenic control (A53T corr.) treated with PBS or rHsCTSD. Pathology-associated SNCA was stained with LB509 antibody (red) and CTSD (green). Scale bar: 10 µm. (B) Quantification of CTSD and (C) SNCA signal intensities determined by confocal microscopy were indicated as fold change (n = 7–10 individual neurons per group). (D) Immunoblot of Triton-soluble (T-sol) lysates of DA-iPSn A53T treated with 10 µg/ml of rHsCTSD for 3.5 weeks, representative for three individual rounds of enzyme treatment. Western blot was stained for CTSD (pro- and single chain enzyme (~52- and ~48-kDa) and mature form at (~34-kDa)). SNCA signal was detected by C-20 and syn-1 antibodies. GAPDH, TUBB3 and CBB-stained SDS-PAGE gels are shown to validate equal loading. (E) Quantification of pro-/single chain CTSD and mature CTSD signal was normalized to GAPDH and shown as fold change (n = 3). (F) Quantification of soluble SNCA levels detected by the SNCA antibody C-20 was normalized to GAPDH and displayed as fold change (n = 6). Quantification of syn-1 antibody is shown in Figure S4E. (G) Representative western blot of Triton-insoluble (T-insol) lysates after treatment with PBS or rHsCTSD. (H) Insoluble SNCA levels (C-20 antibody) were quantified and normalized to TUBB3 and expressed as fold change (n = 6). (I) Representative image of a raster plot profiles of multi-electrode array (MEA) of DA-iPSn A53T corr. and A53T with and without rHsCTSD treatment. Each black line represents a detected spike. Blue lines represent detected channel bursts and pink boxes show network burst. Respective quantification of (J) number of active electrodes and (K) weighted mean firing rate in A53T corr. and A53T treated with PBS or rHsCTSD 14 days after treatment (n = 16, each dot represents one active well of a 48-well MEA plate). Data of active electrodes and weighted mean firing rate before rHsCTSD treatment are shown in Figure S4K and S4L. Data represent mean ± SEM. Statistical analyses were performed by using one-way ANOVA together with a Tukey’s multiple comparison test in (B-C, J-K) and a two-tailed unpaired Student’s t-test (E, F and H). ****p < 0.0001, ***p < 0.001, **p < 0.01, *p < 0.05; n.s., not significant.
Figure 5.
Figure 5.
Effects of rHsCTSD treatment within lysosomes and on the endo-lysosomal/ autophagic system in DA-iPSn harboring an SNCA mutation (A53T). (A) In vitro SNCA seeding assay of lysosomal fractions derived from DA-iPSn of A53T corr. PBS and A53T treated with PBS or rHsCTSD for 25 days. An increase in ThioT signal indicates amyloid protein conversion. Graph shows relative Thio T signal normalized to positive control (fibril+ SNCA mono) (n = 3). Corresponding positive and negative controls as well as second round of SNCA seeding assay are shown in Figures S5A and S5B. (B) Non-denaturing dot blot analysis confirms the presence of pathological SNCA conformation in lysosomal fractions of DA-iPSn A53T and control (fibril + SNCA mono) after two rounds of seeding assay utilizing an SNCA conformation specific antibody (MJFR-14-6-4-2). (C) Representative transmission electron microscopy (TEM) picture of SNCA fibrils from second seeding round derived from DA-iPSn A53T lysosomes. Scale bar: 90 nm. (D) Representative western blot of A53T DA-iPSn lysates from A53T corr., A53T mutant and mutant treated with 10 µg/mL rHsCTSD for 25 days stained for autophagic marker LAMP1 and SQSTM1 as well as pro/single chain (~48/ ~52-kDa) and mature CTSD (~34-kDa). GAPDH and CBB staining were used as loading controls. (E) Respective quantification of LAMP1 and SQSTM1 signal intensity normalized to GAPDH and expressed as fold change (n = 3). (F) Analysis of Dextran-Cascade Blue representing the lysosomal mass. DA-iPSn A53T corr. was incubated with PBS and mutant line (A53T) was treated with PBS and 10 µg/mL rHsCTSD for 21 days. Dextran-Cascade Blue signal was normalized to overall cell stain (Celltag700) and expressed as fold change (measured in triplicates of three independent experiments, n = 3). (G) TEM pictures of ultrastructural analysis of A53T DA-iPSn treated with PBS or rHsCTSD (corresponding picture of A53T corr. in Figure S5C). Blue: nucleus; yellow arrows: intracellular vesicles. One representative mitochondrion is highlighted by an orange star to distinguish it from the vesicular structures. Scale bars: 25 µm. (H) Quantification of intracellular vesicles in DA-iPSn of A53T corr. and A53T treated with PBS or rHsCTSD, showing numbers of vesicle per µm2 (each dot represents the mean of vesicles per µm2 of n = 4 cells). (I) Mass spectrometry analysis of enriched lysosomal fraction from DA-iPSn of A53T mutant line incubated with PBS compared to A53T treated with rHsCTSD (25 days). The graph shows log2 transformed ratios of heavy (Dimethyl Lys4, Dimethyl Nterm4) labeled rHsCTSD sample and light (Dimethyl lys0, Dimethyl Nterm0) labeled control (PBS) sample on the x-axis. The technical replicate (labeling was switched) was inverted for visualization to show the same enrichment direction. The red dashed line indicates a two-fold threshold for enrichment. The most important proteins are highlighted in color, based on their function. All data represent mean ± SEM. Statistical analyses were performed by using two-way ANOVA with a Tukey’s multiple comparison test in (A). To distinguish between statistical differences, asterisks (*) were used for A53T corr. vs. A53T and diamonds (#) were used for A53T vs. A53T +rHsCTSD. One-way ANOVA together with Dunnett’s multiple comparison test was used in (E, F and H). ***/###p < 0.001, */#p < 0.05.
Figure 6.
Figure 6.
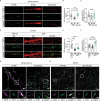
Intracranial injection of rHsCTSD decreases insoluble SNCA in the brain of ctsd deficient (KO) mice. (A) Representative immunoblot of Triton-soluble (T-sol) fraction of whole brain lysates from wildtype (WT) and ctsd KO (KO) mice injected with 10µL PBS or 100 µg rHsCTSD (KO rHsCTSD) each at day P1 into the left hemisphere and on day P19 into the right hemisphere (illustrative timeline of rHsCTSD treatment in mice is depicted in Figure S6A). Western blot stained for CTSD (pro/single chain ~52/~48-kDa and mature form ~34-kDa) as well as SNCA (C-20; immunoblots of syn-1 can be found in Figure S6B). TUBB3 and CBB-stained SDS-PAGE gels were used as control for equal protein load. (B) Quantification of pro-/single chain form and mature CTSD normalized to TUBB3 and normalized to WT (n = 3 mice per group). (C) Quantification of soluble SNCA (C-20; analysis for syn-1 can be found in Figure S6D), normalized to TUBB3 shown as fold change (n = 3 mice per group). (D) Immunoblot of Triton-insoluble (T-insol) fraction of whole brain lysates from WT, KO and rHsCTSD treated KO mice. Right, quantification of insoluble SNCA levels detected by C-20 representative for three individual experiments, normalized to TUBB3 expressed as fold change (n = 3 mice per group; immunoblot and quantification of syn-1 antibody can be found in Figure S6C-6D). (E) Representative dot blot from T-sol whole brain lysates of WT, ctsd KO and ctsd KO mice i.c. injected with rHsCTSD. Pathology-associated SNCA was detected by the conformation-specific SNCA antibody MJFR-14-6-4-2. ACTB was used as a loading control. Right, fold change quantification of SNCA-filament-MJFR signal normalized to ACTB (n = 3–4 mice per group). (F) Representative images of co-stained brain regions hypothalamus, fornix, basal forebrain/thalamus, hippocampus and midbrain of ctsd KO and ctsd KO +rHsCTSD. Pathology-associated SNCA was detected by the conformation-specific antibody MJFR-14-6-4-2 (red) and co-stained with the neuronal marker neurofilament (neurofil., green). Scale bar: 50 µm. For images of WT mice and in lower magnification refer to Figures S7A-7B. (G-I) Analyses of average SNCA aggregate size (µm) and SNCA intensity signal per aggregate from (G) hypothalamus, (H) fornix and (I) basal forebrain and thalamus. Dots represents SNCA aggregates found per image in the respective brain area (n = 3 mice per group). Quantification of SNCA intensity in (J) midbrain and (K) hippocampus (n = 3 mice per group). (L) Representative immunofluorescence pictures of primary neurons derived from wildtype (WT), heterozygous (Het) and ctsd-deficient (KO) mice stained for SNCA (syn1; red), CTSD (green) and nucleus (DAPI; blue). Primary neurons of KO animals were treated with 20 µg/ml rHsCTSD. Individual channels for CTSD (green) and SNCA (red) are shown in Figure S7F. Scale bar: 10 µm. Quantification of (M) SNCA and (N) CTSD signal intensity, normalized to WT and expressed as fold change (n = 6 individual neurons per group). Data represent mean ± SEM. Statistical analyses were performed by using one-way ANOVA together with a Tukey’s multiple comparison test and a two-tailed unpaired Student’s t-test in (G-I). ****p < 0.0001, ***p < 0.001, **p < 0.01, *p < 0.05; n.s., not significant.
Figure 7.
Figure 7.
Intraneuronal effect of rHsCTSD on SNCA and synaptical vesicles in primary neurons and in DA-iPSn. (A) Representative immunostaining of neuronal processes of primary neurons derived from WT, ctsd KO and ctsd KO +rHsCTSD animals. SNCA shown by antibody anti-syn-1 in red and SYN-1 (synapsin I) in green. Scale bar: 5 µm. (B) Quantification of SYN-1-positive vesicle cluster number per µm and (C) of the average SYN-1-positive vesicle size per punctum (µm) in primary neurons from WT, ctsd KO and ctsd KO +rHsCTSD (analysis of n = 11-13 individual neurons per group). (D) Representative immunostaining of SNCA (LB509; red) and SYN-1 (green) in neuronal processes of DA-iPSn of isogenic control (A53T corr) and mutant line (A53T) with and without rHsCTSD treatment. Scale bar: 5 µm. (E) Quantification of SYN-1-positive vesicle cluster numbers per µm and (F) analyses of average SYN-1-positive vesicle size per punctum (µm) in neuronal processes of DA-iPSn A53T corr. +PBS, A53T +PBS and A53T +rHsCTSD (n = 13-16 individual neurons per group). (G and H) Representative structured illumination microscopy (SIM) images providing detailed localization of SNCA respective to SYN-1 signal in (G) primary neurons derived from KO +PBS and KO +rHsCTSD animals and (H) DA-iPSn from A53T mutant +PBS and +rHsCTSD. Neuronal processes were immunostained with SNCA (Antibody: syn-1 for primary neurons and LB509 for DA-iPSn; magenta) and SYN-1 (green). Scale bar: overview 2 µm and inset 1 µm. Images highlighted here (G and H) correspond to experimental conditions in (A) and (D) and highlighted findings from respective experiment. Data represent mean ± SEM. All statistical analyses were performed by using one-way ANOVA followed by Tukey’s multiple comparison test. ****p < 0.0001, ***p < 0.001,  *p < 0.05 n.s., not significant.

References

    1. Baba M, Nakajo S, Tu PH, et al. Aggregation of alpha-synuclein in Lewy bodies of sporadic Parkinson’s disease and dementia with Lewy bodies. Am J Pathol. 1998. Apr;152(4):879–884. - PMC - PubMed
    1. Kalia LV, Lang AE.. Parkinson’s disease. Lancet. 2015. Aug 29;386(9996):896–912. - PubMed
    1. Lees AJ, Hardy J, Revesz T. Parkinson’s disease. Lancet. 2009. Jun 13;373(9680):2055–2066. - PubMed
    1. Soldner F, Stelzer Y, Shivalila CS, et al. Parkinson-associated risk variant in distal enhancer of alpha-synuclein modulates target gene expression. Nature. 2016. May 5;533(7601):95–99. - PMC - PubMed
    1. Nalls MA, Pankratz N, Lill CM, et al. Large-scale meta-analysis of genome-wide association data identifies six new risk loci for Parkinson’s disease. Nat Genet. 2014. Sep;46(9):989–993. - PMC - PubMed

Publication types

Supplementary concepts