. 2022 Mar 14;22(1):75.
doi: 10.1186/s12866-022-02483-4.

Salivary bacterial signatures in depression-obesity comorbidity are associated with neurotransmitters and neuroactive dipeptides

Affiliations

Salivary bacterial signatures in depression-obesity comorbidity are associated with neurotransmitters and neuroactive dipeptides

Gajender Aleti et al. BMC Microbiol. .

Abstract

Background: Depression and obesity are highly prevalent, often co-occurring conditions marked by inflammation. Microbiome perturbations are implicated in obesity-inflammation-depression interrelationships, but how the microbiome mechanistically contributes to pathology remains unclear. Metabolomic investigations into microbial neuroactive metabolites may offer mechanistic insights into host-microbe interactions. Using 16S sequencing and untargeted mass spectrometry of saliva, and blood monocyte inflammation regulation assays, we identified key microbes, metabolites and host inflammation in association with depressive symptomatology, obesity, and depressive symptomatology-obesity comorbidity.

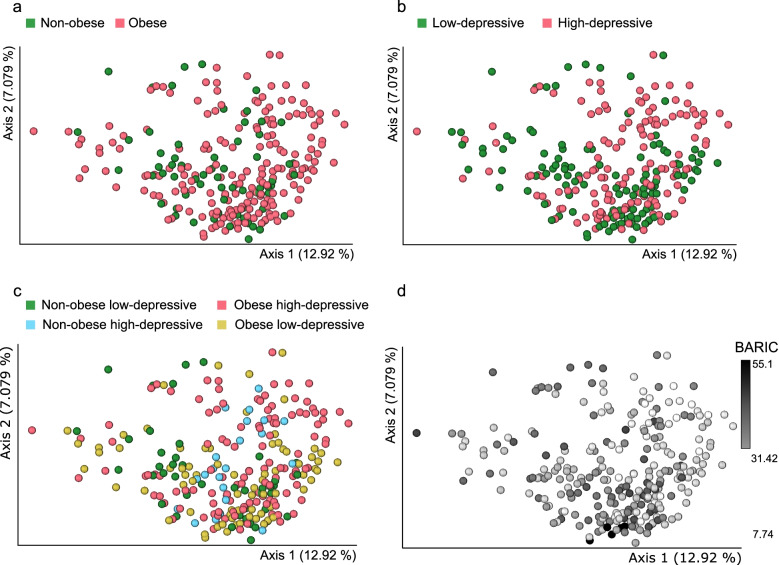
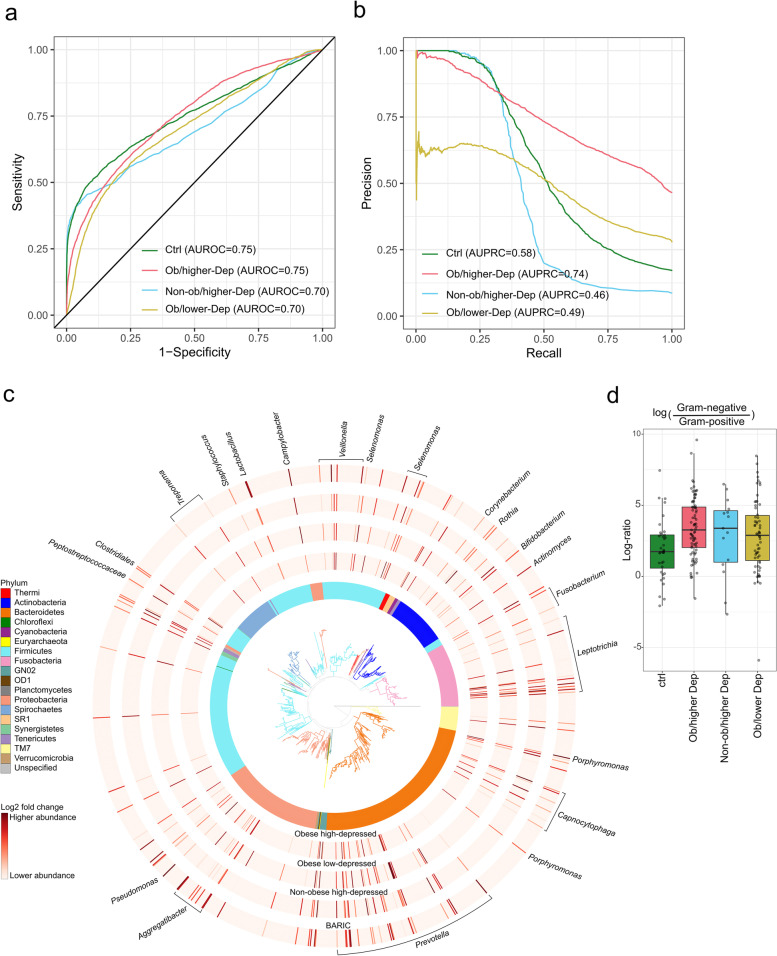
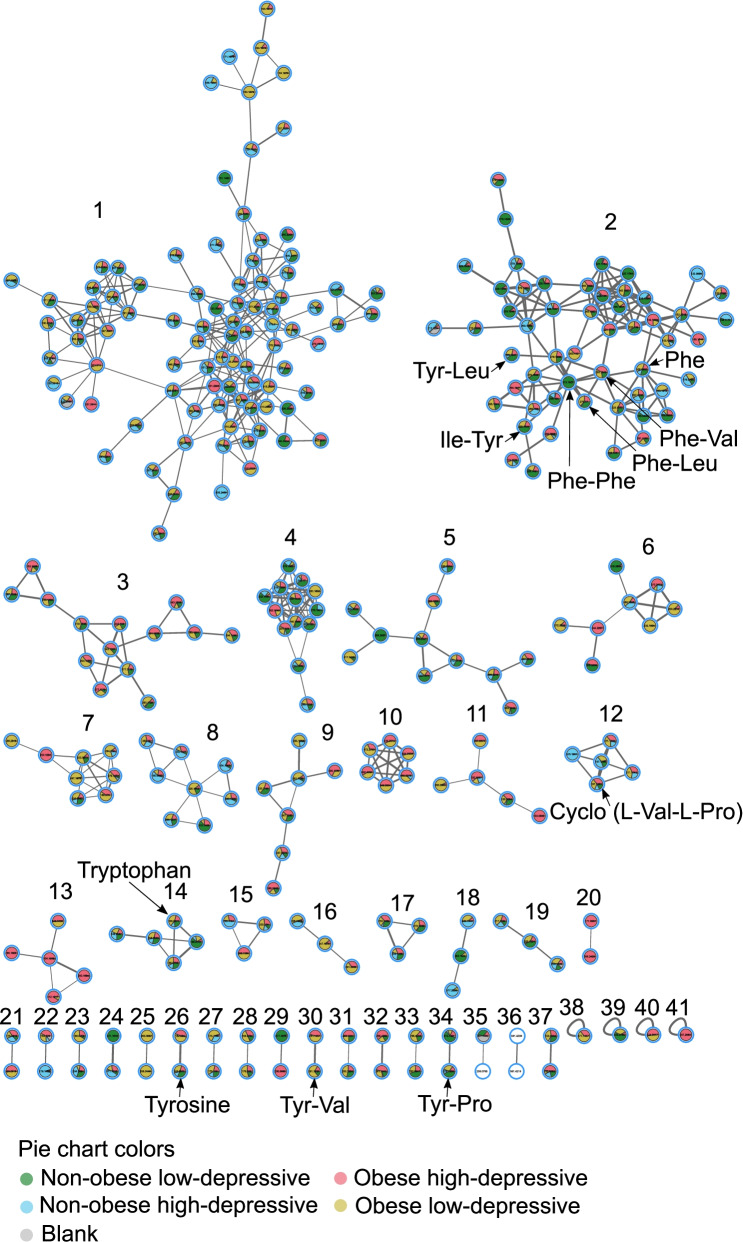
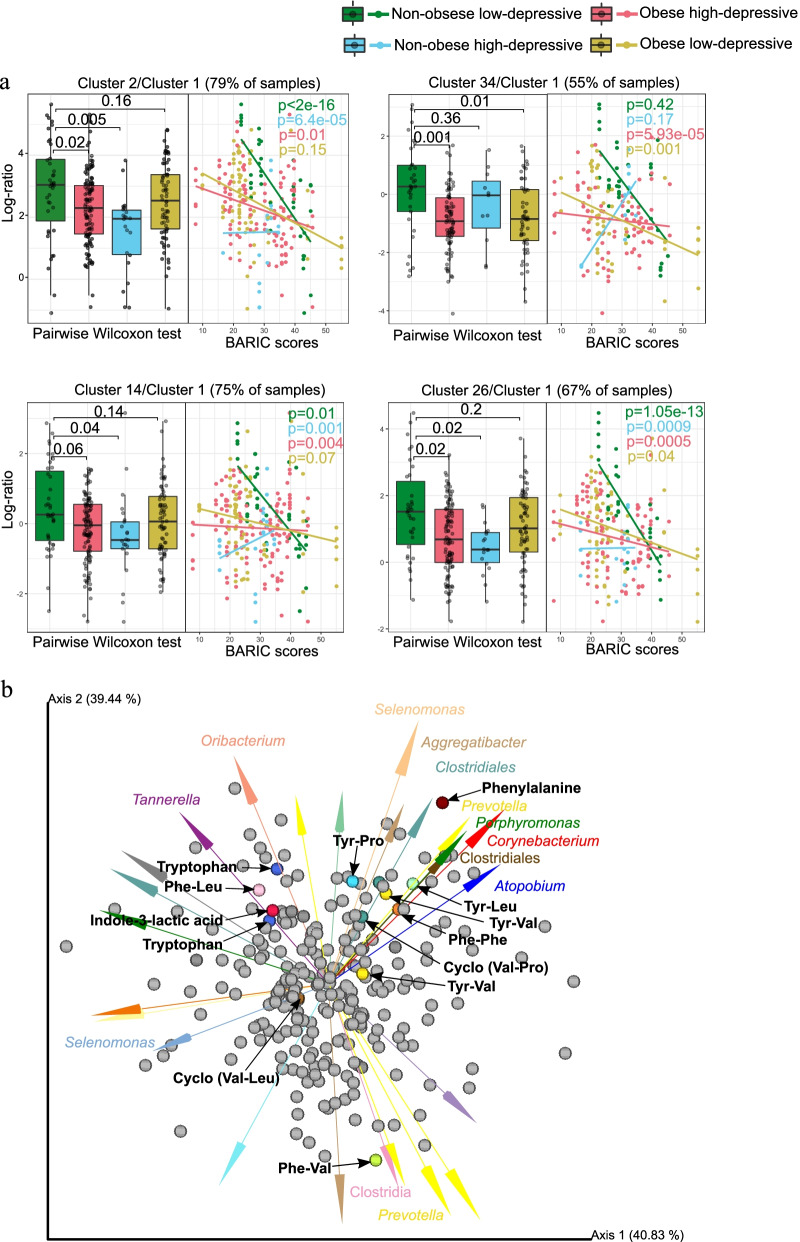
Results: Gram-negative bacteria with inflammation potential were enriched relative to Gram-positive bacteria in comorbid obesity-depression, supporting the inflammation-oral microbiome link in obesity-depression interrelationships. Oral microbiome was more highly predictive of depressive symptomatology-obesity co-occurrences than of obesity or depressive symptomatology independently, suggesting specific microbial signatures associated with obesity-depression co-occurrences. Mass spectrometry analysis revealed significant changes in levels of signaling molecules of microbiota, microbial or dietary derived signaling peptides and aromatic amino acids among depressive symptomatology, obesity and comorbid obesity-depression. Furthermore, integration of the microbiome and metabolomics data revealed that key oral microbes, many previously shown to have neuroactive potential, co-occurred with potential neuropeptides and biosynthetic precursors of the neurotransmitters dopamine, epinephrine and serotonin.

Conclusions: Together, our findings offer novel insights into oral microbial-brain connection and potential neuroactive metabolites involved.

Keywords: Depression; Host inflammation; Host-microbe interactions; Neuroactive molecules; Obesity; Oral microbiome.


Conflict of interest statement

PCD serves as a scientific advisor to Sirenas, Cybele and Galileo. PCD is also a founder and scientific advisor of Ometa and Enveda with approval by UC San Diego.

Figures

Fig. 1
Fig. 1
Principal coordinates analyses (PCoA) of oral bacterial communities in a non-obese and obese b low depressive and higher depressive c non-obese low-depressive, non-obese high-depressive, obese, and co-occurring obesity and depressive symptom groups, and d in inflammation status. Unweighted-UniFrac distances among samples were visualized using EMPeror. Significance of separation between the groups and further post-hoc pairwise comparisons between groups was tested by applying PERMANOVA test on the principal coordinates
Fig. 2
Fig. 2
Oral microbiota is distinctly impacted by the host status in co-occurring obesity-depressive status. a Receiver operating characteristic curves (AUROC) illustrating classification accuracy of the random forest model across all groups (i.e. controls, Ob/lower Dep, Non-ob/higher-Dep, Ob/higher-Dep). b Area under precision recall curves (AUPRC) illustrating performance of the random forest model across all groups. c Phylogenetic distribution of the most differentially ranked taxa across the groups. Branches of the de novo phylogenetic tree and the innermost ring are colored by phyla. Each barplot layer represents log-fold change abundances of taxa within the group in comparison to the healthy controls i.e. Non-ob/lower-Dep. A multinomial regression model was employed for regressing log-fold change abundances against BARIC values. d Log-fold change abundances of Gram-negative microbes relative to Gram-positive microbes across host phenotypes
Fig. 3
Fig. 3
Feature-based molecular network of the ions detected in salivary metabolomes of obese-depressive group. The molecular network was generated by 293 nodes with 41 molecular clusters, which are sub-networks of a larger network generated via Global Natural Products Social Molecular Networking (GNPS). Nodes (small circles with m/z values) represent unique tandem mass spectrometry (MS/MS) consensus spectra and edges (lines) drawn between the nodes correspond to similarity (cosine score) between MS/MS fragmentation. Annotation is performed by MS/MS spectral library matching in GNPS platform. Pie charts within the individual nodes qualitatively represent specific ion presence across groups: non-obese and non-depressive, obese, depressive, and both obese and depressive symptom groups, as well as blank samples. Molecular clusters 2, 3, 4, 5, 9, 17, 19, 30 and 34 represent structural diversity of dipeptides. Molecular clusters 2, 14 and 26 represent aromatic amino acids tryptophan, tyrosine and phenylalanine
Fig. 4
Fig. 4
Differentially abundant molecular clusters and microbe-metabolite co-occurrences in obesity-inflammation-depressive and inflammation status. a Sample plot showing log-ratio of differential molecular features relative to cluster 1 (see left panel). The corresponding right panels represent a scatterplot of samples showing log-ratio of differential features versus inflammation status. Individual samples are colored by health status. Statistical significance of the log-ratios was evaluated by pairwise comparisons using Wilcoxon rank sum test. A linear regression model was employed for regressing log-ratios against BARIC values. b Visualization of microbe-metabolite co-occurrences. Arrows represent microbes and dots represent metabolites. The x and y axes represent principal components of the microbe-metabolite conditional probabilities as determined by the neural network. Distances between arrow tips quantify co-occurrence strengths between microbes, while directionality of the arrows indicates which microbes and metabolites have a high probability of co-occurring. Only known microbiota-derived molecules are labeled. Microbial abundances are estimated using differential abundance analysis via multinomial regression

References

    1. Smith DJ, Court H, McLean G, Martin D, Martin JL, Guthrie B, et al. Depression and multimorbidity: a cross-sectional study of 1,751,841 patients in primary care. J Clin Psychiatry. 2014;75(11):1202–1208. - PubMed
    1. Schachter J, Martel J, Lin CS, Chang CJ, Wu TR, Lu CC, et al. Effects of obesity on depression: a role for inflammation and the gut microbiota. Brain Behav Immun. 2018;69:1–8. - PubMed
    1. James SL, Abate D, Abate KH, Abay SM, Abbafati C, Abbasi N, et al. Global, regional, and national incidence, prevalence, and years lived with disability for 354 diseases and injuries for 195 countries and territories, 1990-2017: a systematic analysis for the global burden of disease study 2017. Lancet. 2018;392(10159):1789–1858. - PMC - PubMed
    1. Mannan M, Mamun A, Doi S, Clavarino A. Is there a bi-directional relationship between depression and obesity among adult men and women? Systematic review and bias-adjusted meta analysis. Asian J Psychiatry. 2016;21:51–66. - PubMed
    1. Dawes AJ, Maggard-Gibbons M, Maher AR, Booth MJ, Miake-Lye I, Beroes JM, et al. Mental health conditions among patients seeking and undergoing bariatric surgery a meta-analysis. JAMA. 2016;315(2):150–163. - PubMed

Publication types