. 2022 Mar 14;15(1):56.
doi: 10.1186/s12920-022-01199-8.

Establishing analytical validity of BeadChip array genotype data by comparison to whole-genome sequence and standard benchmark datasets

Affiliations

Establishing analytical validity of BeadChip array genotype data by comparison to whole-genome sequence and standard benchmark datasets

Praveen F Cherukuri et al. BMC Med Genomics. .

Abstract

Background: Clinical use of genotype data requires high positive predictive value (PPV) and thorough understanding of the genotyping platform characteristics. BeadChip arrays, such as the Global Screening Array (GSA), potentially offer a high-throughput, low-cost clinical screen for known variants. We hypothesize that quality assessment and comparison to whole-genome sequence and benchmark data establish the analytical validity of GSA genotyping.

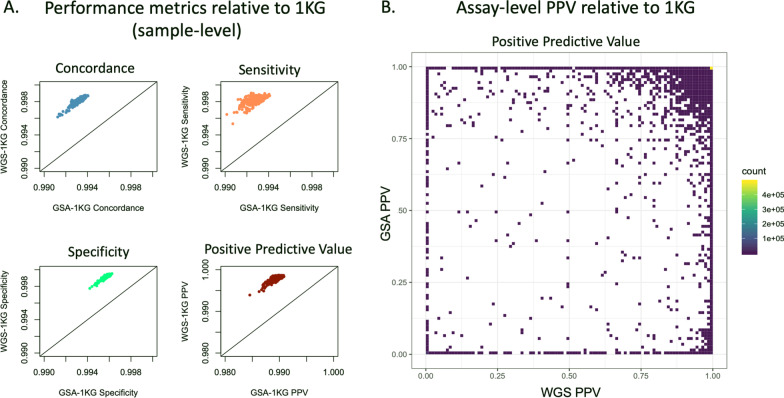
Methods: To test this hypothesis, we selected 263 samples from Coriell, generated GSA genotypes in triplicate, generated whole genome sequence (rWGS) genotypes, assessed the quality of each set of genotypes, and compared each set of genotypes to each other and to the 1000 Genomes Phase 3 (1KG) genotypes, a performance benchmark. For 59 genes (MAP59), we also performed theoretical and empirical evaluation of variants deemed medically actionable predispositions.

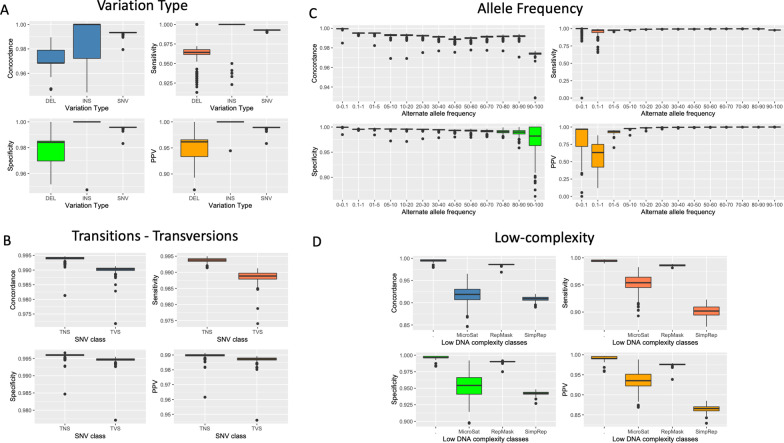
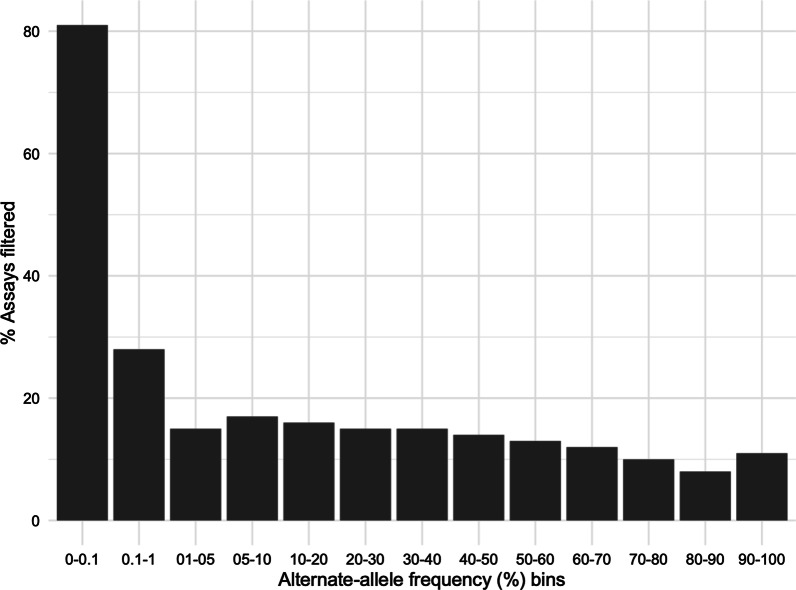
Results: Quality analyses detected sample contamination and increased assay failure along the chip margins. Comparison to benchmark data demonstrated that > 82% of the GSA assays had a PPV of 1. GSA assays targeting transitions, genomic regions of high complexity, and common variants performed better than those targeting transversions, regions of low complexity, and rare variants. Comparison of GSA data to rWGS and 1KG data showed > 99% performance across all measured parameters. Consistent with predictions from prior studies, the GSA detection of variation within the MAP59 genes was 3/261.

Conclusion: We establish the analytical validity of GSA assays using quality analytics and comparison to benchmark and rWGS data. GSA assays meet the standards of a clinical screen although assays interrogating rare variants, transversions, and variants within low-complexity regions require careful evaluation.

Keywords: Analytical validation; Clinical genotyping; Genotyping error.


Conflict of interest statement

The authors declare that they have no competing interests.

Figures

Fig. 1
Fig. 1
A flow-diagram showing the analytical validation framework for detecting and limiting genotyping error in BeadChip array data
Fig. 2
Fig. 2
Aggregate quality control analysis of the GSA data. A Principal Component Analysis (PCA) plots of 1KG data and GSA genotype data. red: African (AFR), yellow-green: Admixed Americans (AMR), dark-green: East Asian (EAS), blue: European (EUR), purple: South Asian (SAS). B Heatmaps of BeadChip array quality control analysis of call-rate (left), p10GC (middle), and estimated DNA contamination (right). Color gradient scales for the three panels are as follows: call-rate (orange < 0.94–blue > 0.99), p10GC (yellow < 0.50–blue > 0.60) and estimated DNA contamination (rainbow gradient: purple ~ 1%, blue ~ 2%, green ~ 3%, orange/red ~ >4%). C Heatmaps of reproducibility quality control analysis using replicate data as measured by call rate, estimated DNA contamination, number of assays with no genotype calls, and heterozygote to homozygote ratio. Color gradient scales for these four heatmaps are as follows: No genotype calls (blue < 166,000–orange > 400,000), and rainbow gradient for call rate (purple > 0.99–red < 0.94), estimated DNA contamination (purple < 1%–red > 4%), and heterozygote/homozygote ratio (purple > 2.25–red < 1.25), respectively
Fig. 3
Fig. 3
Three-dimensional scatterplot showing reproducibility of GSA call rate measured in three replicates for each Coriell sample (pairwise analysis of triplicate data). The data is plotted as correlation across triplicates for all measured GSA genotypes for a given DNA sample. Note that most samples had concordance greater than 0.999 between replicates suggesting high reproducibility. A few samples had off-diagonal points, i.e., those with poor call rates or reproducibility. The color rainbow gradient is from blue (< 0.996) to dark red (1.00)
Fig. 4
Fig. 4
Boxplot analysis of the performance metrics of GSA vs 1KG benchmark dataset when assays are classified according to A variation type (deletion (DEL), insertion (INS), single nucleotide variant (SNV)), B type of single nucleotide change (transition (TNS), transversion (TVS)), (C) frequency of the alternate allele in the 1000 Genomes (1KG) data, and (D) interrogation of a low complexity genomic region (microsatellite region (MicroSat), RepeatMasker region (RepMask), or simple repeat (SimRep)). The performance metrics measured and plotted as boxplots for each class/panel are concordance (blue), sensitivity (coral), specificity (green) and positive predictive value (PPV) (orange)
Fig. 5
Fig. 5
Bar plot of percentage of GSA assays with a positive predictive value (PPV) < 1 as a function of alternate allele frequency bins (allele frequency bins as percentage). The alternate allele frequency bins were defined based on the frequency information in 1000 Genomes (1KG) data
Fig. 6
Fig. 6
Scatter-plot comparison of performance metrics of whole genome sequencing (rWGS) and GSA using 1KG as the benchmark dataset. A Scatter plots show sample-level performance metrics of rWGS and GSA relative to 1KG reference data. Plots are concordance (top left; blue), sensitivity (top right; orange), specificity (bottom left; green) and positive predictive value (PPV) (bottom right; maroon) respectively. Each dot represents a single sample’s performance metric value. B Density scatterplot of each GSA assay’s positive predictive value computed for GSA (y-axis) vs. rWGS (x-axis) using 1KG as the benchmark dataset. Each square represents PPV measured for GSA and rWGS relative to 1KG benchmark dataset, and the color indicates the number of assays within each square. The color gradient of each square ranges from 1 assay (dark purple) to 476,828 assays (yellow); therefore, the color on the scatterplot indicates the density of data-points in 2 dimensions
Fig. 7
Fig. 7
Plot of the average percentage of bases within each MAP59 gene covered by whole genome sequencing (rWGS) to a read depth of A ×10 or more (gte10x) B ×20 or more (gte20x) among the 263 samples. Each rWGS nucleotide was required to have a Phred-based quality score of greater than 30 to be considered for this analysis

References

    1. Muyas F, Bosio M, Puig A, Susak H, Domènech L, Escaramis G, et al. Allele balance bias identifies systematic genotyping errors and false disease associations. Hum Mutat. 2019;40(1):115–126. - PMC - PubMed
    1. Yan Q, Chen R, Sutcliffe JS, Cook EH, Weeks DE, Li B, et al. The impact of genotype calling errors on family-based studies. Sci Rep. 2016;6:28323. - PMC - PubMed
    1. Walters K. The effect of genotyping error in sib-pair genomewide linkage scans depends crucially upon the method of analysis. J Hum Genet. 2005;50(7):329–337. - PubMed
    1. Saunders IW, Brohede J, Hannan GN. Estimating genotyping error rates from Mendelian errors in SNP array genotypes and their impact on inference. Genomics. 2007;90(3):291–296. - PubMed
    1. Pompanon F, Bonin A, Bellemain E, Taberlet P. Genotyping errors: causes, consequences and solutions. Nat Rev Genet. 2005;6(11):847–859. - PubMed

LinkOut - more resources