. 2022 Mar 14;41(1):98.
doi: 10.1186/s13046-022-02296-3.

Macropinocytosis is an alternative pathway of cysteine acquisition and mitigates sorafenib-induced ferroptosis in hepatocellular carcinoma

Affiliations

Macropinocytosis is an alternative pathway of cysteine acquisition and mitigates sorafenib-induced ferroptosis in hepatocellular carcinoma

Jun-Kyu Byun et al. J Exp Clin Cancer Res. .

Abstract

Background: Macropinocytosis, an important nutrient-scavenging pathway in certain cancer cells, allows cells to compensate for intracellular amino acid deficiency under nutrient-poor conditions. Ferroptosis caused by cysteine depletion plays a pivotal role in sorafenib responses during hepatocellular carcinoma (HCC) therapy. However, it is not known whether macropinocytosis functions as an alternative pathway to acquire cysteine in sorafenib-treated HCC, and whether it subsequently mitigates sorafenib-induced ferroptosis. This study aimed to investigate whether sorafenib drives macropinocytosis induction, and how macropinocytosis confers ferroptosis resistance on HCC cells.

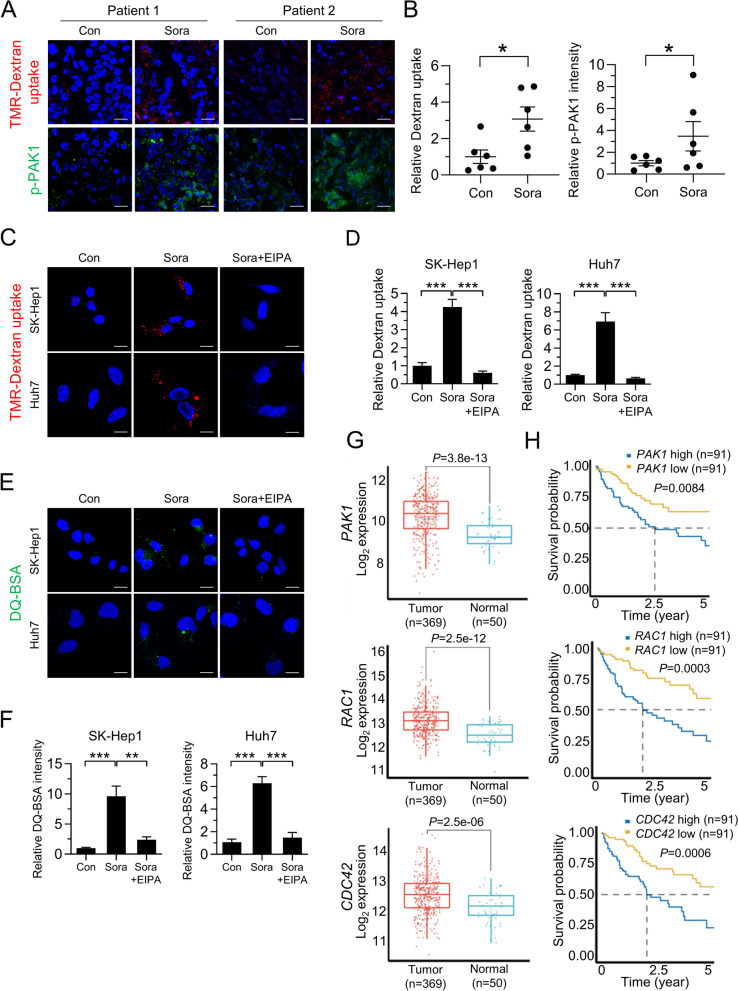
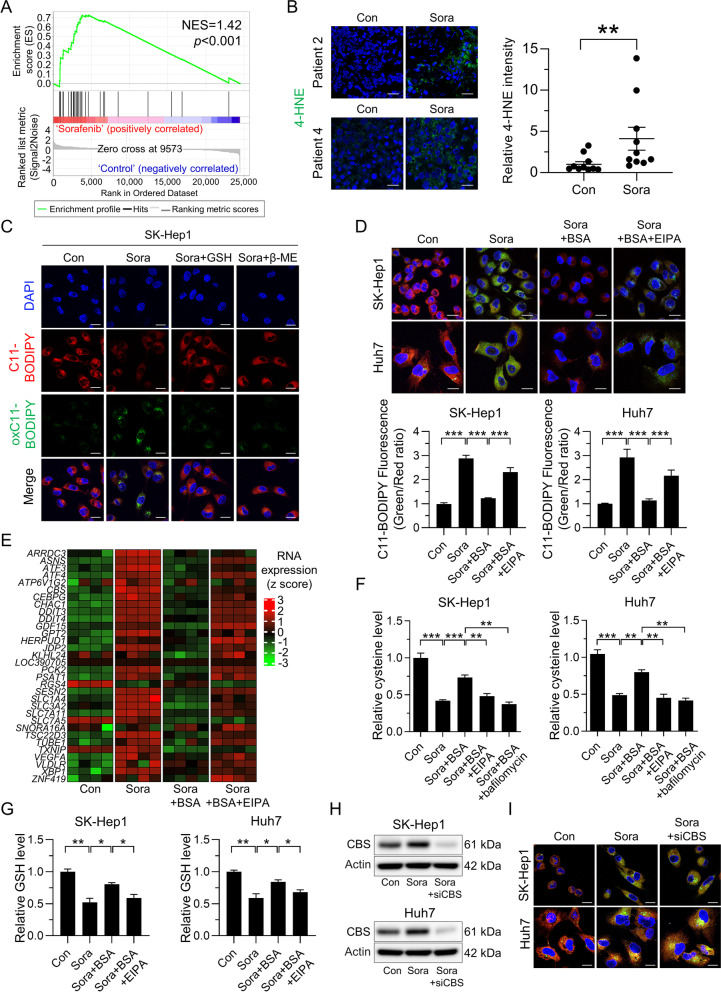
Methods: Macropinocytosis, both in HCC cells and HCC tissues, was evaluated by measuring TMR-dextran uptake or lysosomal degradation of DQ-BSA, and ferroptosis was evaluated via C11-BODIPY fluorescence and 4-HNE staining. Sorafenib-induced ferroptosis and macropinocytosis were validated in tumor tissues taken from HCC patients who underwent ultrasound-guided needle biopsy.

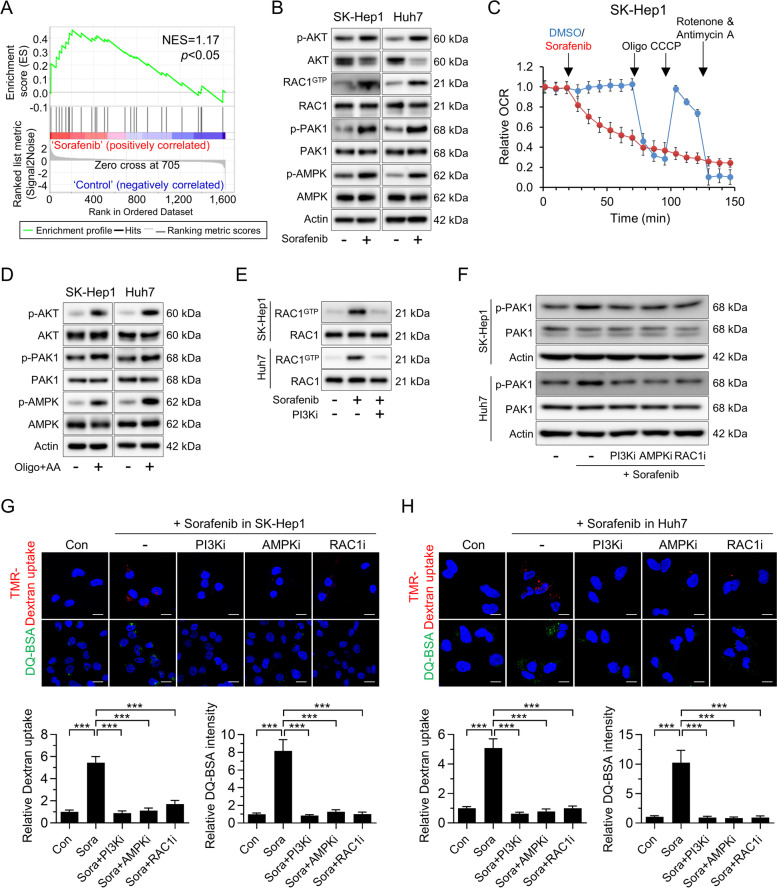
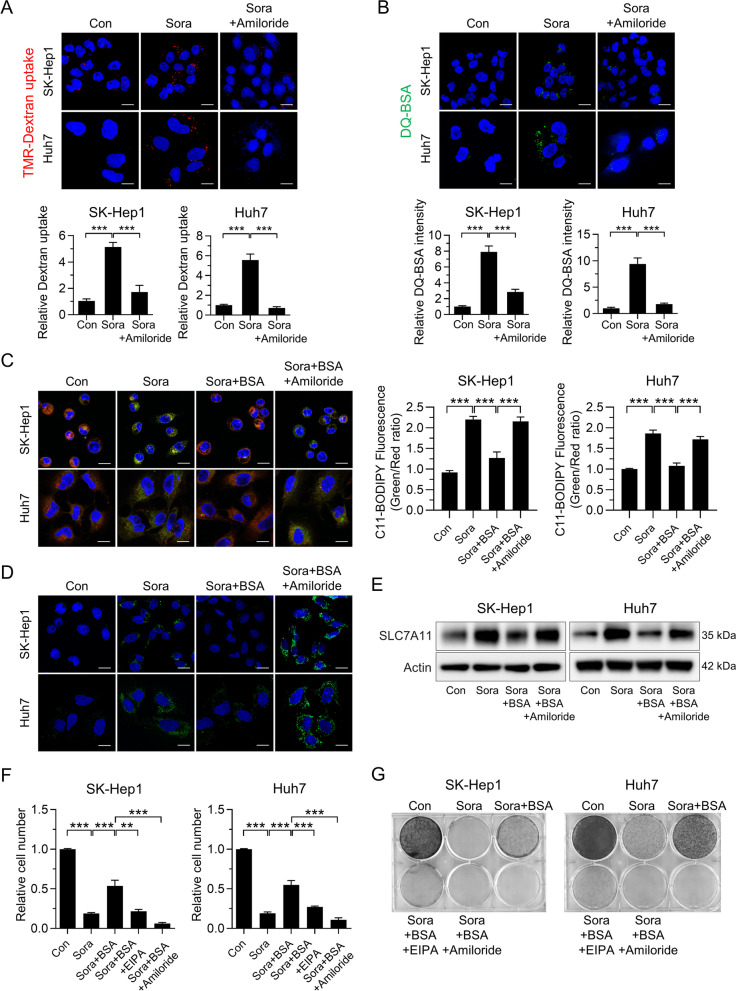
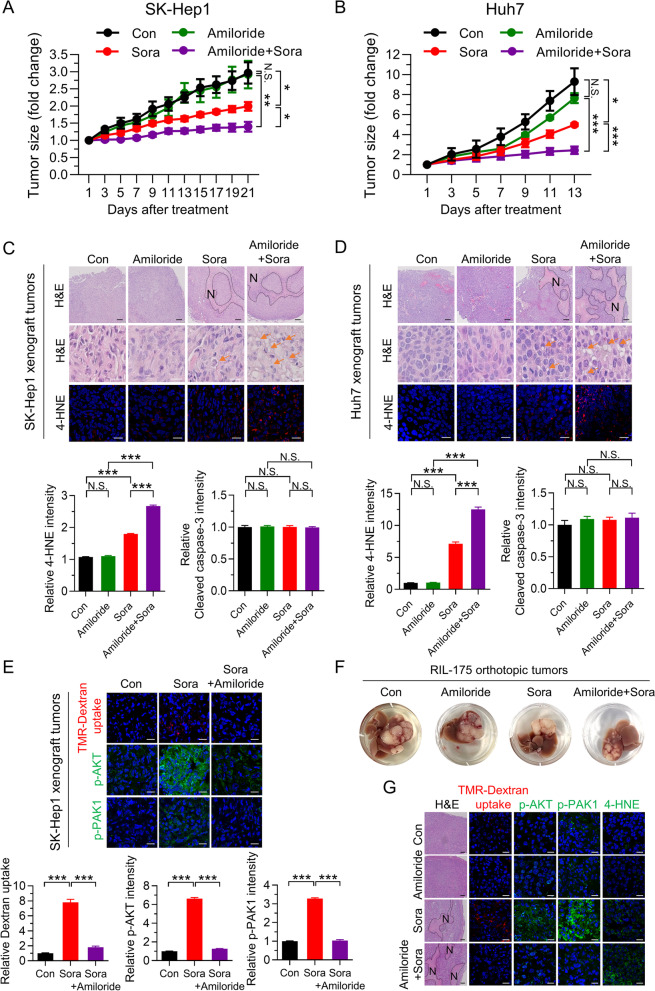
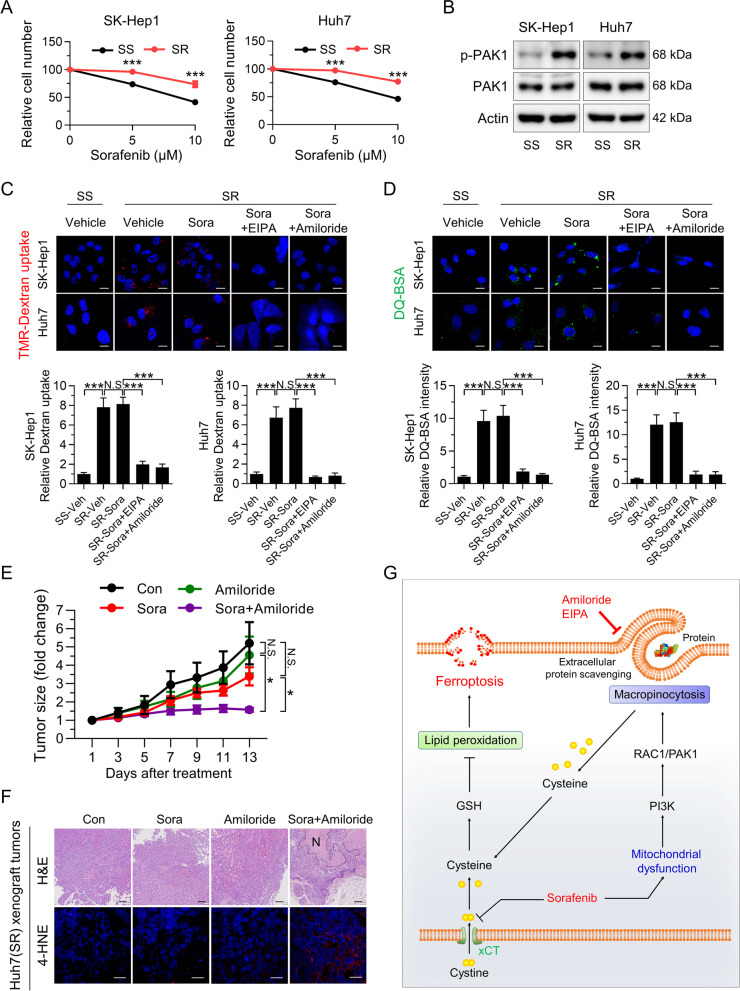
Results: Sorafenib increased macropinocytosis in human HCC specimens and xenografted HCC tissues. Sorafenib-induced mitochondrial dysfunction was responsible for activation of PI3K-RAC1-PAK1 signaling, and amplified macropinocytosis in HCC. Importantly, macropinocytosis prevented sorafenib-induced ferroptosis by replenishing intracellular cysteine that was depleted by sorafenib treatment; this rendered HCC cells resistant to sorafenib. Finally, inhibition of macropinocytosis by amiloride markedly enhanced the anti-tumor effect of sorafenib, and sensitized resistant tumors to sorafenib.

Conclusion: In summary, sorafenib induced macropinocytosis, which conferred drug resistance by mitigating sorafenib-induced ferroptosis. Thus, targeting macropinocytosis is a promising therapeutic strategy to facilitate ferroptosis-based therapy for HCC.

Keywords: Ferroptosis; Hepatocellular carcinoma; Macropinocytosis; Sorafenib; Sorafenib resistance.


Conflict of interest statement

The authors declare no competing interests.

Figures

Fig. 1
Fig. 1
Sorafenib induces macropinocytosis in human HCC tissues and HCC cells. A Images of macropinocytotic uptake of labeled TMR-dextran (red), immunofluorescence staining with anti-phosphorylated PAK1 (green), and B quantification of macropinosomes and phosphorylated PAK1 fluorescence in response to sorafenib in tumor tissues from six treatment-naïve HCC patients. C Representative images of macropinosomes (red) in sorafenib-treated liver cancer cells in the presence or absence of EIPA, an inhibitor of macropinocytosis, and D quantification of macropinosomes in the cells shown in Fig. 1C. E Representative images of DQ-BSA fluorescence (green) in sorafenib-treated liver cancer cells in the presence or absence of EIPA, and F quantification of DQ-BSA fluorescence in the cells shown in Fig. 1E. G TCGA analysis of PAK1, RAC1, and CDC42 expression in human HCC tumor (n = 369) and non-tumor tissues (n = 50). H Correlation between PAK1, RAC1, or CDC42 expression and overall survival of human HCC patients (n = 91). Data are normalized against values measured in vehicle-treated cells (Con) and expressed as the mean ± SEM of at least three independent experiments. Scale bar, 20 µm. *p < 0.05; **p < 0.01, ***p < 0.001
Fig. 2
Fig. 2
Macropinocytosis-mediated acquisition of cysteine rescues sorafenib-induced ferroptosis. A Gene set enrichment analysis of published ferroptosis expression signatures among genes expressed by sorafenib-treated SK-Hep1 cells. B Representative immunofluorescence staining with anti-4-HNE (left panel) and quantification of 4-HNE fluorescence in response to sorafenib in tumor tissues from ten treatment-naïve HCC patients (right panel). C Representative images of C11-BODIPY, a marker of lipid peroxidation, in SK-Hep1 cells treated with sorafenib, either alone or in combination with the antioxidant GSH or β-mercaptoethanol (β-ME). C11-BOIPY represents levels of staining with the probe (unoxidized), while oxC11-BODIPY (oxidized) indicates the levels of lipid ROS. D Representative images of C11-BODIPY in SK-Hep1 and Huh7 cells treated with sorafenib, either alone or in combination with BSA and/or EIPA (upper panel). Quantification of C11-BODIPY fluorescence in cells (lower panel). E Genes shown in the heatmap of SK-Hep1 cells treated with sorafenib, either alone or in combination with BSA or/and EIPA. F Relative cysteine levels in SK-Hep1 and Huh7 cells treated with sorafenib, either alone or in combination with BSA, EIPA, and/or bafilomycin A1, an inhibitor of protein degradation in lysosomes. G Relative GSH levels in SK-Hep1 and Huh7 cells treated with sorafenib, either alone or in combination with BSA and/or EIPA. H Effect of sorafenib on CBS proteins in control siRNA or siCBS-transfected SK-Hep1 and Huh7 cells. I Representative images of C11-BODIPY in SK-Hep1 and Huh7 cells shown in Fig. 2H. Data are normalized against values measured in vehicle-treated cells (Con) and expressed as the mean ± SEM of at least three independent experiments. Scale bar, 20 µm. *p < 0.05, **p < 0.01, and *** p < 0.001
Fig. 3
Fig. 3
Sorafenib induces macropinocytosis via mitochondrial dysfunction-induced activation of PI3K-RAC1-PAK1 signaling. A Gene set enrichment analysis of PI3K signaling related genes expressed by sorafenib-treated SK-Hep1 cells. B Levels of phosphorylated AKT, activation of RAC1, and phosphorylated PAK1 and AMPK, in SK-Hep1 and Huh7 treated with sorafenib. C The oxygen consumption rate (OCR) of SK-Hep1 at the indicated time points after sorafenib treatment. D Levels of phosphorylated AKT, PAK1, and AMPK in SK-Hep1 and Huh7 cells after treatment with oligomycin (Oligo) and antimycin A (AA). E Effect of a PI3K inhibitor (LY294002) on RAC1 activation in sorafenib-treated SK-Hep1 and Huh7 cells. F Levels of phosphorylated PAK1 in sorafenib-treated SK-Hep1 and Huh7 cells in the presence or absence of a PI3K inhibitor (LY294002), an AMPK inhibitor (compound c), or a RAC1 inhibitor (NSC23766). (G and H) Representative images of macropinosomes (red), and DQ-BSA fluorescence (green) in sorafenib-treated SK-Hep1 (G) and Huh7 (H) in the presence or absence of a PI3K inhibitor, an AMPK inhibitor, or a RAC1 inhibitor (upper panel). Quantification of macropinosomes and DQ-BSA fluorescence in cells (lower panel). Data are normalized against values measured in vehicle-treated cells (Con) and expressed as the mean ± SEM of at least three independent experiments. Scale bar, 20 µm. ***p < 0.001
Fig. 4
Fig. 4
Inhibition of macropinocytosis increases sorafenib-induced ferroptosis in HCC. A Representative images of macropinosomes (red) in sorafenib-treated SK-Hep1 and Huh7 cells in the presence or absence of amiloride (upper panel). Quantification of macropinosomes in cells (lower panel). B Representative images of DQ-BSA fluorescence (green) in sorafenib-treated SK-Hep1 and Huh7 cells in the presence or absence of amiloride (upper panel). Quantification of DQ-BSA fluorescence in cells (lower panel). C Representative images of C11-BODIPY in SK-Hep1 and Huh7 cells treated with sorafenib, either alone or in combination with BSA and/or amiloride (left panel). Quantification of C11-BODIPY fluorescence in cells (right panel). D Immunofluorescence of 4-HNE staining in SK-Hep1 and Huh7 cells treated with sorafenib, either alone or in combination with BSA and/or amiloride (green). E Level of SLC7A11 in SK-Hep1 and Huh7 cells treated with sorafenib, either alone or in combination with BSA and/or amiloride. F Relative number of SK-Hep1 and Huh7 cells treated for 48 h with sorafenib, either alone or in combination with BSA, EIPA, and/or amiloride. G Clonogenic assay of SK-Hep1 and Huh7 cells treated for 7 days with sorafenib, either alone or in combination with BSA, EIPA, and/or amiloride. Data are normalized against values measured in vehicle-treated cells (Con) and expressed as the mean ± SEM of at least three independent experiments. Scale bar, 20 µm. **p < 0.01, and ***p < 0.001
Fig. 5
Fig. 5
Inhibition of macropinocytosis by amiloride augments sorafenib-induced inhibition of tumor growth. (A and B) Tumor growth curves. (C and D) Hematoxylin and eosin (H&E) staining and immunofluorescence staining with anti-4-HNE (scale bar, 20 µm) (upper panel), and quantification of immunofluorescence tissue staining with anti-4-HNE and cleaved caspase-3 (See Fig. S5E and F) (lower panel) (n = 5 per group). Hashed lines and arrows indicate regional necrosis (N) and lipid droplet formation, respectively. (E) Representative images of macropinosomes and immunofluorescence staining for anti-phosphorylated AKT and PAK1 in sections of SK-Hep1 xenografted tumor tissue (upper panel). Quantification of macropinosomes, phosphorylated AKT and PAK1 fluorescence in tumor tissues (lower panel) (n = 3 per group). (F) Representative gross images of orthotopic RIL-175 tumor tissues from 57BL/6 mice after drug treatments (n = 6–8 per group). G H&E staining (scale bar, 150 µm), representative images of macropinosomes, phosphorylated AKT and PAK1, and 4-HNE staining (scale bar, 20 µm) in sections of RIL-175-orthotophic tumor tissues. Hashed lines indicate regional necrosis (N). Data are normalized against values measured in vehicle-treated tumors (Con) and expressed as the mean ± SEM. Black scale bar, 150 µm; White scale bar, 20 µm. N.S., not significant; *p < 0.05, ** p < 0.01, and *** p < 0.001
Fig. 6
Fig. 6
Sorafenib-resistant HCC cells show enhanced macropinocytosis, and amiloride sensitizes resistant HCC tumors to sorafenib. A Relative numbers of Huh7 and SK-Hep1 (sorafenib-sensitive, SS) and sorafenib-resistant Huh7 and SK-Hep1 (sorafenib-resistant, SR) cells treated with sorafenib for 24 h. B Levels of phosphorylated PAK1 in Huh7 (SS and SR) and SK-Hep1 (SS and SR) cells. C and D Representative images of macropinosomes (red; C) and DQ-BSA fluorescence (green; D) in sorafenib-resistant Huh7 (SR) and SK-Hep1 (SR) in the presence or absence of EIPA or amiloride (scale bar, 20 µm). E Growth curve of Huh7 (SR)-xenografted tumors after drug treatment. F H&E staining (scale bar, 150 µm) and immunofluorescence staining of tumor tissues with anti-4-HNE (scale bar, 20 µm). Hashed lines indicate regional necrosis (N). (G) Schematic showing the role of macropinocytosis in sorafenib resistance: macropinocytosis mitigates sorafenib-induced ferroptosis in HCC. Data are normalized against values measured in vehicle-treated cells (SS-Veh) or tumors (Con), and expressed as the mean ± SEM of at least three independent experiments, or from independent xenografts (n = 3–4 per group). N.S., not significant; *p < 0.05 and *** p < 0.001

References

    1. Rawla P, Sunkara T, Muralidharan P, Raj JP. Update in global trends and aetiology of hepatocellular carcinoma. Contemp Oncol (Pozn) 2018;22(3):141–150. - PMC - PubMed
    1. Berasain C. Hepatocellular carcinoma and sorafenib: too many resistance mechanisms? Gut. 2013;62(12):1674–1675. - PubMed
    1. Zhang Y, Commisso C. Macropinocytosis in Cancer: A Complex Signaling Network. Trends Cancer. 2019;5(6):332–334. - PMC - PubMed
    1. Liver EA. EASL Clinical Practice Guidelines: Management of hepatocellular carcinoma. J Hepatol. 2018;69(1):182–236. - PubMed
    1. Llovet JM, Kelley RK, Villanueva A. Hepatocellular carcinoma Nat Rev Dis Primers. 2021;7(1):6. - PubMed

MeSH terms