. 2022 Mar 14;11(1):14.
doi: 10.1186/s40164-022-00256-3.

METTL3 modulates m6A modification of CDC25B and promotes head and neck squamous cell carcinoma malignant progression

Affiliations

METTL3 modulates m6A modification of CDC25B and promotes head and neck squamous cell carcinoma malignant progression

Yu-Qing Guo et al. Exp Hematol Oncol. .

Abstract

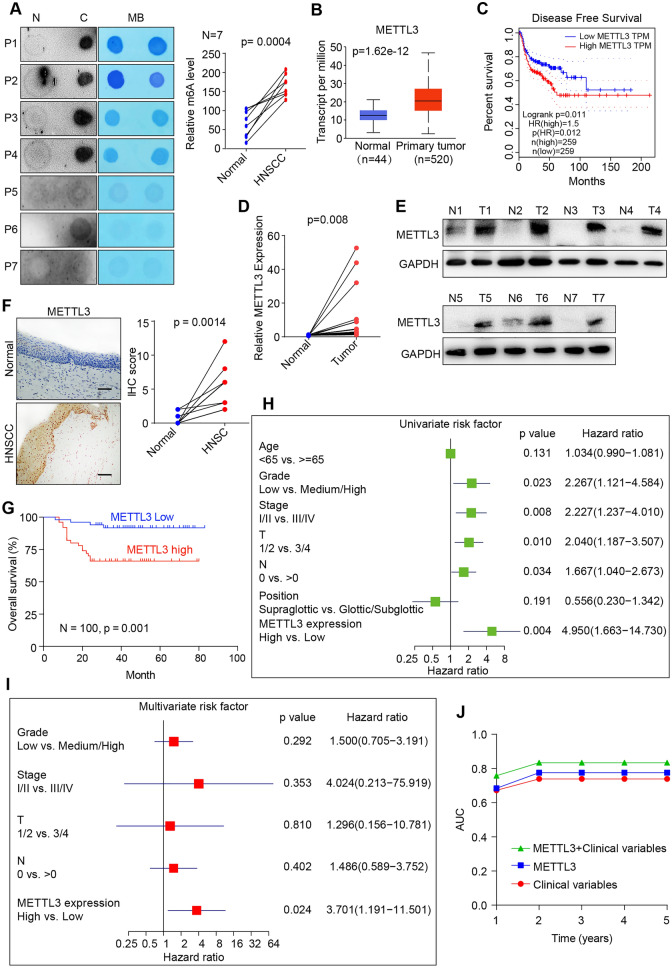
Background: N6-methyladenosine (m6A) RNA methylation and its methyltransferase METTL3 have been widely reported to be involved in different cancers by regulating RNA metabolism and function. Here, we aimed to explore the biological function and clinical significance of m6A modification and METTL3 in head and neck squamous cell carcinoma (HNSCC).

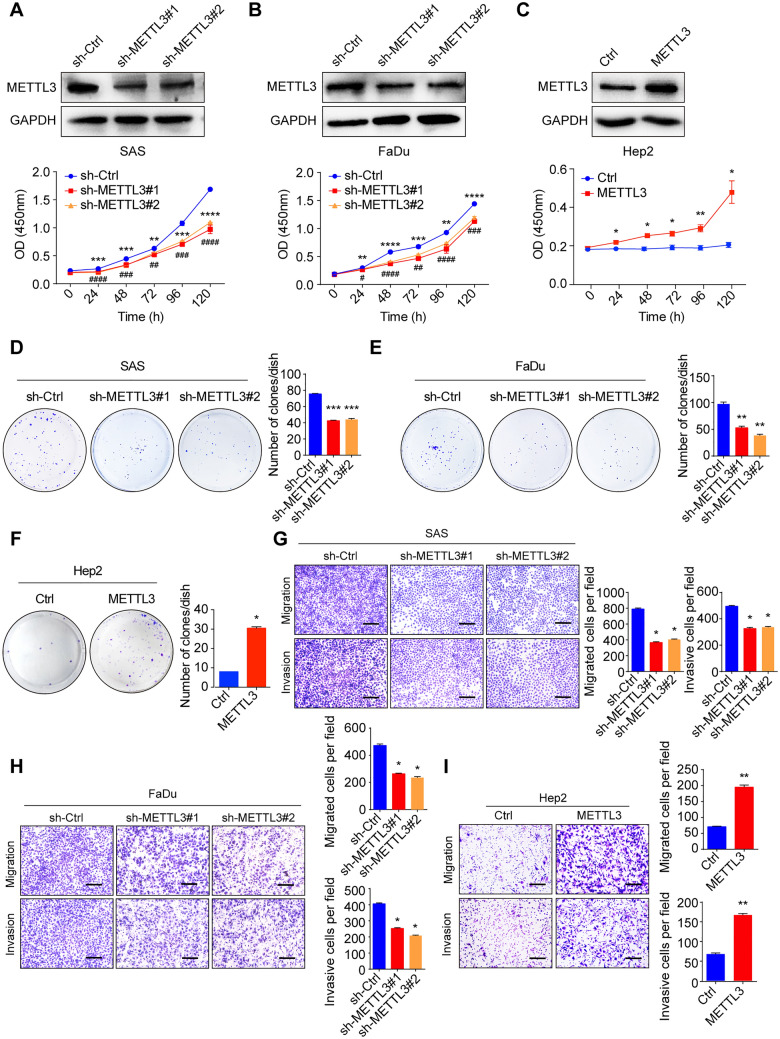
Methods: The prognostic value of METTL3 expression was evaluated using tissue microarray and immunohistochemical staining analyses in a human HNSCC cohort. The biological role and mechanism of METTL3 in HNSCC tumour growth, metastasis and angiogenesis were determined in vitro and in vivo.

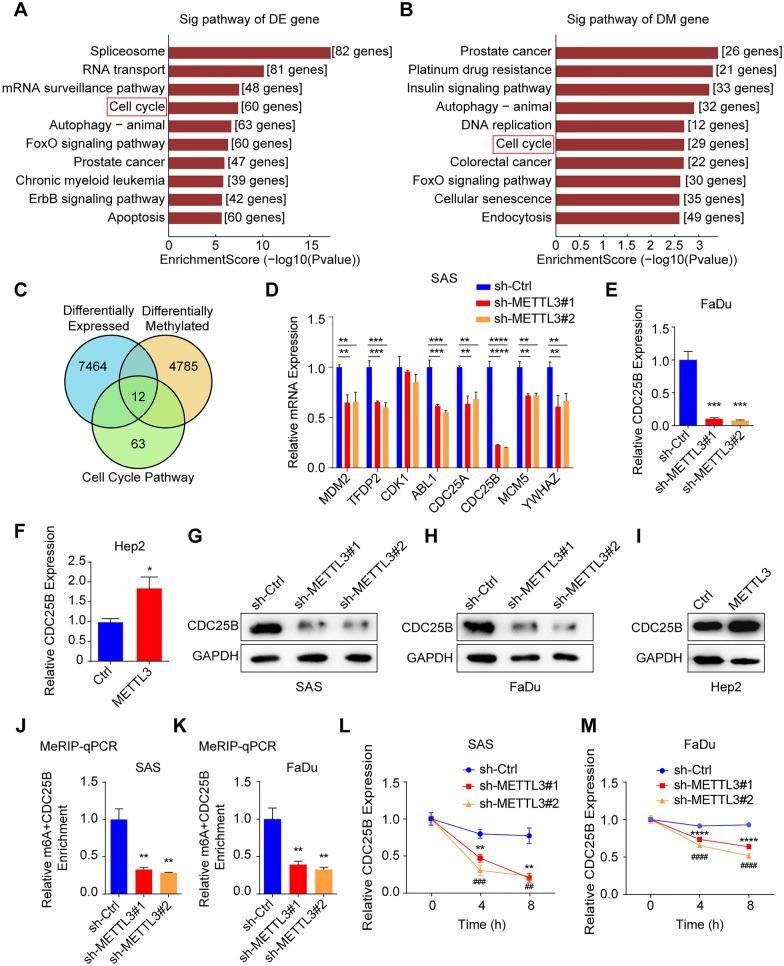
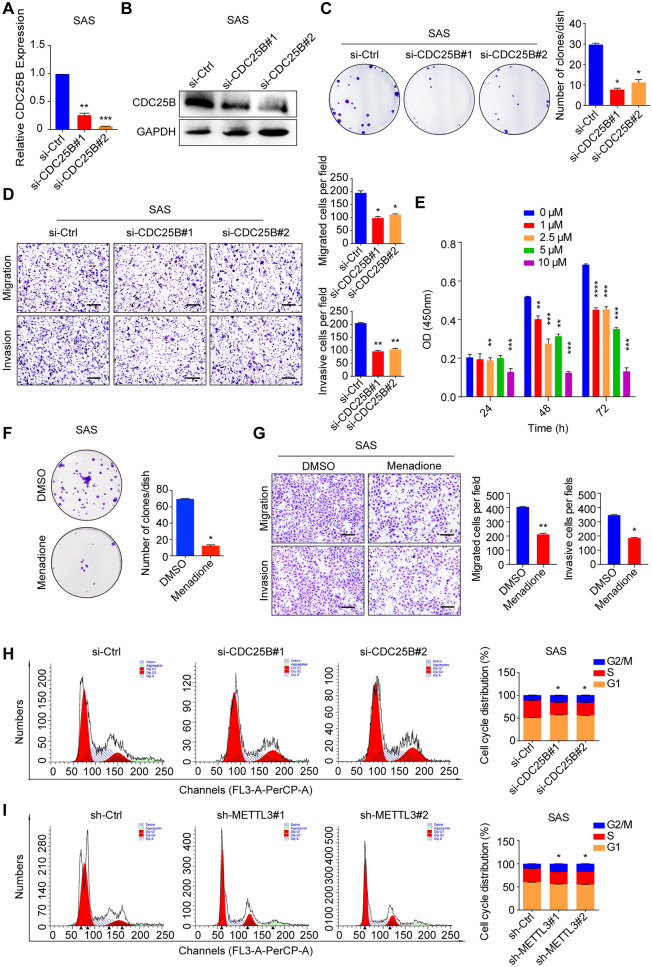
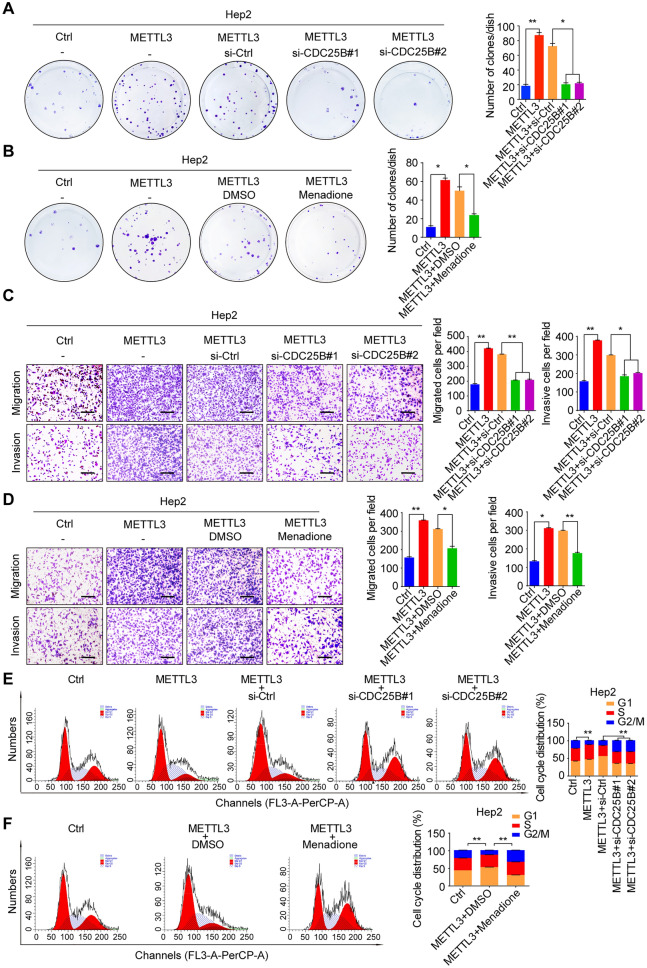
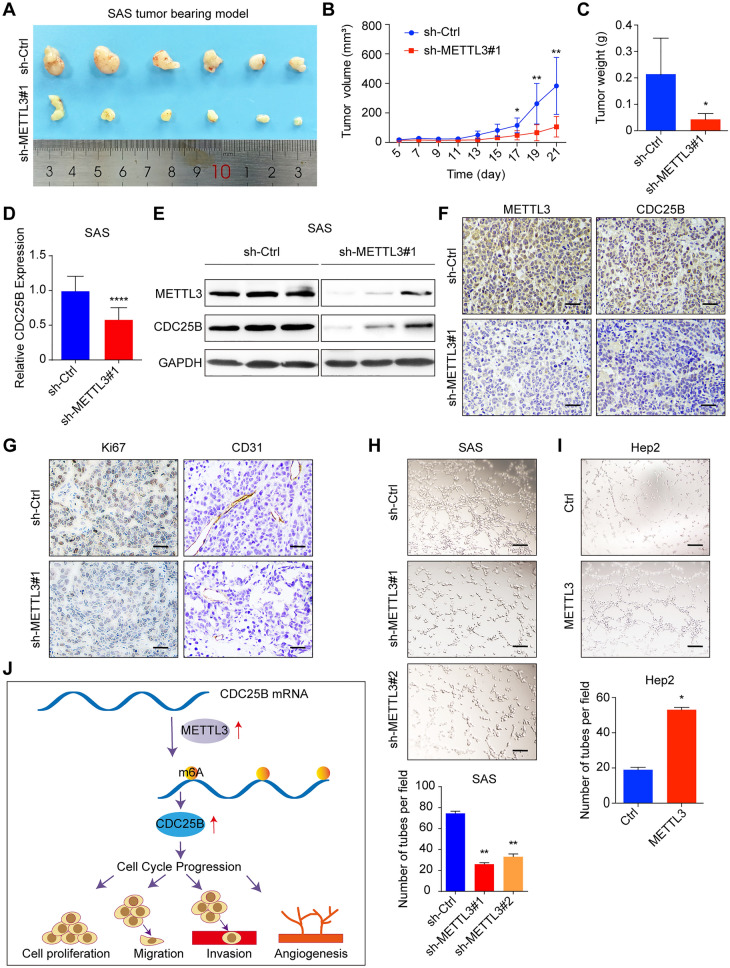
Results: M6A levels and METTL3 expressions in HNSCC tissues were significantly increased compared with paired adjacent tissues. Meanwhile, METTL3 was an independent risk factor for the prognosis of HNSCC patients. Moreover, METTL3 overexpression promoted HNSCC cell proliferation, migration, invasion, and angiogenesis, while knockdown of METTL3 had an opposite effect in vivo and in vitro. Mechanistically, METTL3 enhanced the m6A modification of CDC25B mRNA, which maintained its stability and upregulated its expression, thereby activating G2/M phase of cell cycle and leading to HNSCC malignant progression.

Conclusions: METTL3 may be a potential prognostic biomarker and therapeutic target for HNSCC.

Keywords: CDC25B; Cell cycle; HNSCC; METTL3; m6A.


Conflict of interest statement

None.

Figures

Fig. 1
Fig. 1
METTL3 high expression is associated with poor prognosis of HNSCC patients. A Dot blot assay was conducted with mRNA extracted from HNSCC tissues and paired paracancerous normal tissues using an anti-m6A antibody, and MB (methylene blue) staining served as the loading control (representative images in left panel). The relative m6A contents on mRNA in HNSCC tissues and paired normal normal tissues were calculated (right panel, n = 7). B TCGA data showed that METTL3 expression was significantly upregulated in HNSCC (n = 520) than normal tissue (n = 44). C Disease-free survival (RFS) of HNSCC patients based on METTL3 expression obtained from GEPIA website (http://gepia.cancer-pku.cn/). D The levels of METTL3 expression in HNSCC and paired normal tissues were measured by qRT-PCR (n = 10). E METTL3 protein levels were measured in HNSCC tissues and paired normal tissues by western blotting (n = 7). F METTL3 expression was significantly upregulated in HNSCC compared with the paired paracancerous normal tissue by IHC staining (n = 5, scale bars = 100 μm). G Kaplan–Meier OS analysis of HNSCC patients based on METTL3 expression measured by IHC of tissue microarray (n = 100). H Univariate Cox regression analysis was conducted in HNSCC patients (n = 100). All bars correspond to 95% confidence intervals. I Multivariate Cox regression analysis was conducted in HNSCC patients (n = 100). J The time-dependent receiver operating characteristic (ROC) analysis for the clinical risk score (TNM stage), the METTL3 risk score, and the combined METTL3 and clinical risk scores in HNSCC cohort
Fig. 2
Fig. 2
METTL3 promotes HNSCC cell proliferation, migration, and invasion. A The protein levels of METTL3 in SAS cells with METTL3 knockdown were measured by western blotting (upper panel), and cell proliferation ability in METTL3 knockdown and their corresponding control SAS cells were measured by a CCK8 assay (bottom panel). B The protein levels of METTL3 in FaDu cells with METTL3 knockdown were measured by western blotting (upper panel), and cell proliferation ability in METTL3 knockdown or control FaDu cells were measured by a CCK8 assay (bottom panel). C The protein levels of METTL3 in Hep2 cells with METTL3 overexpression were measured by western blotting (upper panel), and cell proliferation ability in METTL3 knockdown or control Hep2 cells were measured by a CCK8 assay (bottom panel). D, E knockdown of METTL3 inhibits HNSCC cell proliferation by colony formation assay (left panel). Quantification of the colony formation assay results (right panel). F METTL3 overexpression promotes HNSCC cell proliferation by colony formation assay (left panel). Quantification of the colony formation assay results (right panel). G, H knockdown of METTL3 inhibits HNSCC cell migration and invasion by transwell assays. Representative images (scale bars = 100 μm, left panel) and quantification (right panel) of the cell migration and invasion assay results were shown. I METTL3 overexpression promotes HNSCC cell migration and invasion by transwell assays. Representative images (scale bars = 100 μm, left panel) and quantification (right panel) of the cell migration and invasion assay results were shown. The data are the means ± SD of three independent experiments. */# p < 0.05; **/## p < 0.01; ***/### p < 0.001; ****/#### p < 0.0001
Fig. 3
Fig. 3
METTL3 mediates the m6A modification on CDC25B mRNA in HNSCC. A m6A-mRNA epitranscriptomic microarray showed signal pathways in which most differentially expressed gene enriched in METTL3 knockdown cells (SAS), DE represents differentially expressed. B m6A-mRNA epitranscriptomic microarray showed signal pathways in which most differentially methylated genes enriched in METTL3 knockdown cells (SAS), DM represents differentially methylated. C m6A-mRNA epitranscriptomic microarray showed an overlap of the total differentially expressed gene, total differentially methylated gene, and differentially expressed and methylated gene enriched in the cell cycle pathway. D Genes selected from the overlap were used for qRT-PCR in METTL3 knockdown and their corresponding control cells, and CDC25B was the most significantly downregulated gene upon knockdown of METTL3. E, F CDC25B mRNA expression was confirmed by qRT-PCR in METTL3 knockdown (FaDu) and METTL3 overexpression (Hep2) cells. G CDC25B protein level was measured by western blot assay in METTL3 knockdown SAS cells. H CDC25B protein level was measured by western blot assay in METTL3 knockdown FaDu cells. I CDC25B protein level was measured by western blot assay in METTL3 overexpressed Hep2 cells. J MeRIP-qPCR was conducted to detect the m6A level of CDC25B mRNA in METTL3 knockdown (SAS) cells. K MeRIP-qPCR was conducted to detect the m6A level of CDC25B mRNA in METTL3 knockdown (FaDu) cells. L, M The levels of CDC25B expression in METTL3 knockdown and their corresponding control cells treated with actinomycin D (5 μg/mL) at the indicated time points were detected by qRT-PCR. The data are the means ± SD of three independent experiments. */# p < 0.05; **/## p < 0.01; ***/### p < 0.001; ****/#### p < 0.0001
Fig. 4
Fig. 4
CDC25B promotes SAS cell proliferation, migration, invasion, and cell cycle progression. A The qRT-PCR was conducted to confirm CDC25B knockdown efficiency at mRNA level. B Western blot assay was conducted to confirm CDC25B knockdown efficiency at protein level. C Knockdown of CDC25B inhibited cell proliferation in colony formation assay (left panel); quantification results of colony formation (right panel). D CDC25B knockdown inhibited cell migration and invasion by transwell assays. Representative images (scale bars = 100 μm, left panel) and quantification (right panel) of the cell migration and invasion assay results were shown. E CCK8 assay was conducted on SAS cell after different concentrations of CDC25B inhibitor (menadione) treatment at indicated time. F CDC25B inhibitor (menadione) concentration of 5 μM was used for constant inhibition in colony formation assay and showed that menadione can inhibit cell proliferation (upper panel); quantification results of colony formation (bottom panel). G SAS cells were treated with 5 μM menadione for 24 h and used for transwell assays, showing that menadione can inhibit cell migration and invasion. Representative images (scale bars = 100 μm, left panel) and quantification (right panel) of the cell migration and invasion assay results were shown. Cell cycle G2/M arrest was observed in CDC25B knockdown cells (H) and METTL3 knockdown cells (I). The data are the means ± SD of three independent experiments. * p < 0.05; ** p < 0.01; *** p < 0.001; **** p < 0.0001
Fig. 5
Fig. 5
METTL3 accelerates HNSCC malignant progression by upregulating CDC25B. A Colony formation assay of METTL3 overexpressing Hep2 cells transfected with CDC25B siRNAs and the corresponding control (left panel), numbers of the colony formation were calculated (right panel). B Colony formation assay of METTL3 overexpressing Hep2 cells treated with 5 μM menadione or DMSO for 24 h (left panel), numbers of the colony formation were calculated (right panel). C Transwell assay of METTL3 overexpressing Hep2 cells transfected with CDC25B siRNAs and the corresponding control (left panel) to evaluate cell migration and invasion ability (scale bars = 100 μm, left panel), numbers of cells migrated and invaded were calculated (right panel). D Transwell assay of METTL3 overexpressing Hep2 cells treated with 5 μM menadione or DMOS for 24 h and the corresponding control (scale bars = 100 μm, left panel), numbers of cells migrated and invaded were calculated (right panel). E Cell cycle assay of METTL3 overexpressing Hep2 cells transfected with CDC25B siRNAs and the corresponding control (left panel), percentage of cell cycle phase was calculated (right panel). F Cell cycle assay of METTL3 overexpressing Hep2 cells treated with 5 μM menadione or DMSO for 24 h and the corresponding control (left panel), percentage of cell cycle phase was calculated (right panel). The data are the means ± SD of three independent experiments. * p < 0.05; ** p < 0.01
Fig. 6
Fig. 6
Overexpression of METTL3 promotes tumor growth and angiogenesis. A Knockdown of METTL3 significantly inhibits subcutaneous tumor growth in nude mice (n = 6). B The tumor volume curve was conducted by measuring every other day. C The mice were executed and tumors were extracted and weighed after 21 days. D CDC25B mRNA level in extracted tumor tissues from METTL3 knockdown and corresponding control groups was measured by qRT-PCR. E METTL3 and CDC25B protein level in extracted tumors from METTL3 knockdown and corresponding control groups was measured by western blot assay. F METTL3 and CDC25B protein level was measured by IHC on extracted tumors from METTL3 knockdown and corresponding control groups (scale bars = 100 μm). G Ki67 and CD31 protein level was measured by IHC on extracted tumors from METTL3 knockdown and corresponding control groups (scale bars = 100 μm). H Tube formation assay was conducted using HUVEC cultured in medium from METTL3 knockdown SAS cells and their corresponding control cells (upper panel), and the number of tubes was calculated (bottom panel). I Tube formation assay was conducted using HUVEC cultured in medium from METTL3 overexpressing Hep2 cells and their corresponding control cell (upper panel), and the number of tubes was calculated (bottom panel; scale bars = 100 μm). J The graphic illustration of METTL3 mediated the m6A modification of CDC25B mRNA, promoting HNSCC cell cycle progression to lead to the cell proliferation, migration, invasion, and angiogenesis. The data are the means ± SD of three independent experiments. * p < 0.05; ** p < 0.01; **** p < 0.0001

References

    1. Gupta B, Johnson NW, Kumar N. Global epidemiology of head and neck cancers: a continuing challenge. Oncology. 2016;91(1):13–23. - PubMed
    1. Siegel RL, Miller KD, Jemal A. Cancer statistics, 2019. Ca-a Cancer J Clin. 2019;69(1):7–34. - PubMed
    1. Bray F, et al. Global cancer statistics 2018: GLOBOCAN estimates of incidence and mortality worldwide for 36 cancers in 185 countries. CA Cancer J Clin. 2018;68(6):394–424. - PubMed
    1. Dhull AK, et al. Major risk factors in head and neck cancer: a retrospective analysis of 12-year experiences. World J Oncol. 2018;9(3):80–84. - PMC - PubMed
    1. Liu Z, et al. Apoptotic capacity and risk of squamous cell carcinoma of the head and neck. Eur J Cancer. 2017;72:166–176. - PMC - PubMed