

Clinicians' Use of Quantitative Information while Assessing the Rate of Functional Progression in Glaucoma
- PMID: 35288335
- PMCID: PMC9464792
- DOI: 10.1016/j.ogla.2022.03.002
Clinicians' Use of Quantitative Information while Assessing the Rate of Functional Progression in Glaucoma
Abstract
Purpose: Clinicians use both global and point-wise information from visual fields to assess the rate of glaucomatous functional progression. We asked which objective, quantitative measures best correlated with subjective assessment by glaucoma experts. In particular, we aimed to determine how much that judgment was based on localized rates of change vs. on global indices reported by the perimeter.
Design: Prospective cohort study.
Participants: Eleven academic, expert glaucoma specialists independently scored the rate of functional progression, from 1 (improvement) to 7 (very rapid progression), for a series of 5 biannual clinical printouts from 100 glaucoma or glaucoma suspect eyes of 51 participants, 20 of which were scored twice to assess repeatability.
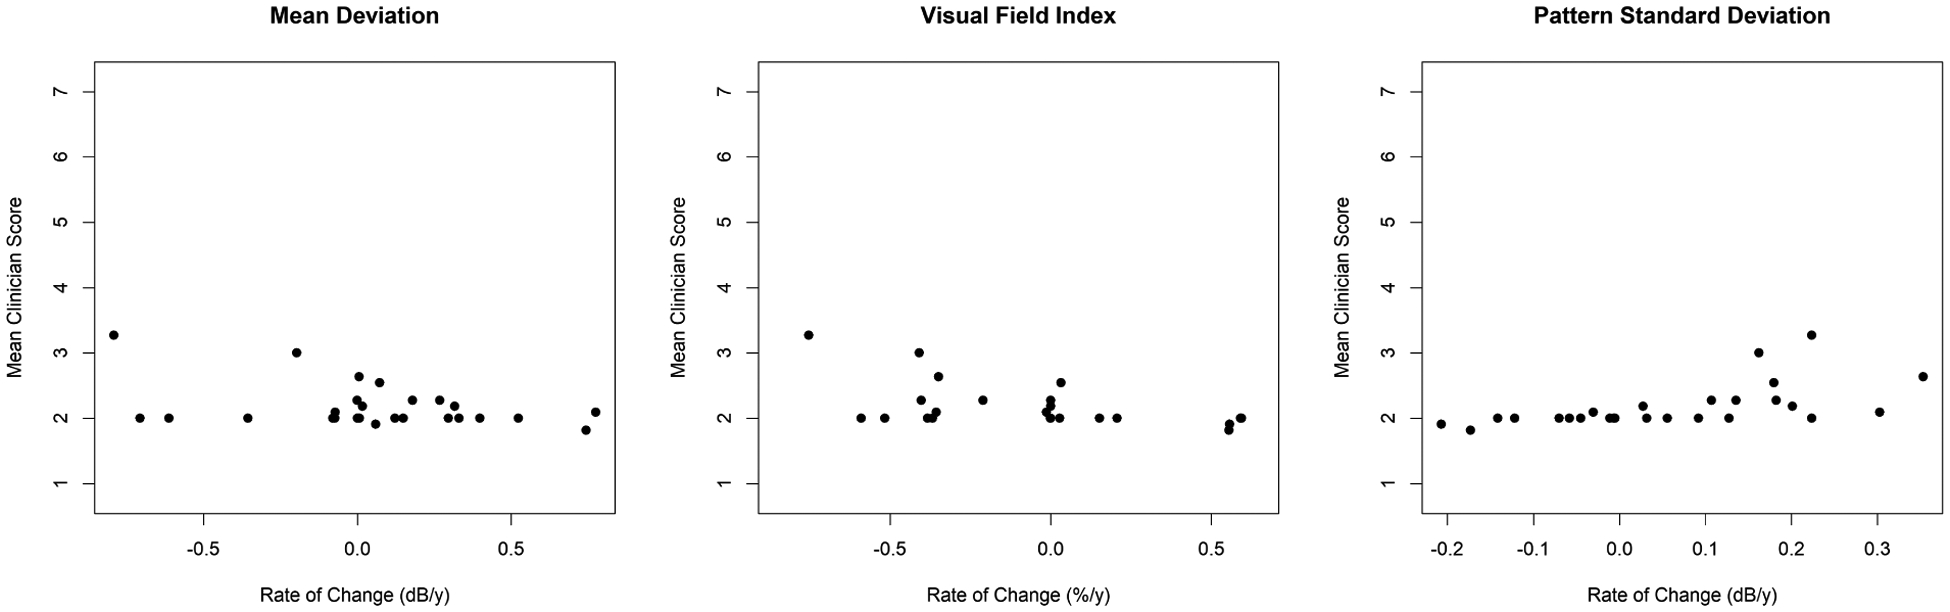
Methods: Regression models were used to predict the average of the 11 clinicians' scores based on objective rates of change of mean deviation (MD), visual field index (VFI), pattern standard deviation (PSD), the Nth fastest progressing location, and the Nth fastest progressing of 10 anatomically defined clusters of locations after weighting by eccentricity.
Main outcome measures: Correlation between the objective rates of change and the average of the 11 clinicians' scores.
Results: The average MD of the study eyes was -2.4 dB (range, -16.8 to +2.8 dB). The mean clinician score was highly repeatable, with an intraclass correlation coefficient of 0.95. It correlated better with the rate of change of VFI (pseudo-R2 = 0.73, 95% confidence interval [CI, 0.60-0.83]) than with MD (pseudo-R2 = 0.63, 95% CI [0.45-0.76]) or PSD (pseudo-R2 = 0.41, 95% CI [0.26-0.55]). Using point-wise information, the highest correlations were found with the fifth-fastest progressing location (pseudo-R2 = 0.71, 95% CI [0.56-0.80]) and the fastest-progressing cluster after eccentricity weighting (pseudo-R2 = 0.61, 95% CI [0.48-0.72]). Among 25 eyes with an average VFI of > 99%, the highest observed pseudo-R2 value was 0.34 (95% CI [0.16-0.61]) for PSD.
Conclusions: Expert academic glaucoma specialists' assessment of the rate of change correlated best with VFI rates, except in eyes with a VFI near the ceiling of 100%. Sensitivities averaged within clusters of locations have been shown to detect change sooner, but the experts' opinions correlated more closely with global VFI. This could be because it is currently the only index for which the perimeter automatically provides a quantitative estimate of the rate of functional progression.
Keywords: Clinical care; Diagnostics; Perimetry; Progression; Survey.
Copyright © 2022 American Academy of Ophthalmology. Published by Elsevier Inc. All rights reserved.
Figures


References
-
- Shah NN, Bowd C, Medeiros FA, et al. Combining structural and functional testing for detection of glaucoma. Ophthalmology 2006;113(9):1593–602. - PubMed
-
- Caprioli J The importance of rates in glaucoma. Am J Ophthalmol 2008;145(2):191–2. - PubMed
-
- Saunders LJ, Russell RA, Kirwan JF, McNaught AI, Crabb DP. Examining Visual Field Loss in Patients in Glaucoma Clinics During Their Predicted Remaining Lifetime. Invest Ophthalmol Vis Sci 2014;55(1):102–9. - PubMed
Publication types
MeSH terms
Grants and funding
LinkOut - more resources
Full Text Sources
Medical
Miscellaneous
