. 2022 Aug;20(4):765-779.
doi: 10.1016/j.gpb.2021.08.014. Epub 2022 Mar 11.

Defining A Global Map of Functional Group-based 3D Ligand-binding Motifs

Affiliations

Defining A Global Map of Functional Group-based 3D Ligand-binding Motifs

Liu Yang et al. Genomics Proteomics Bioinformatics. 2022 Aug.

Abstract

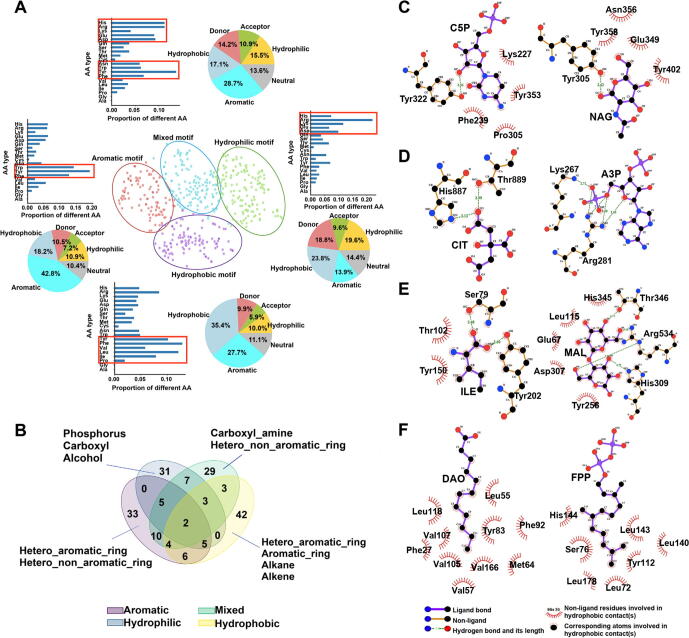
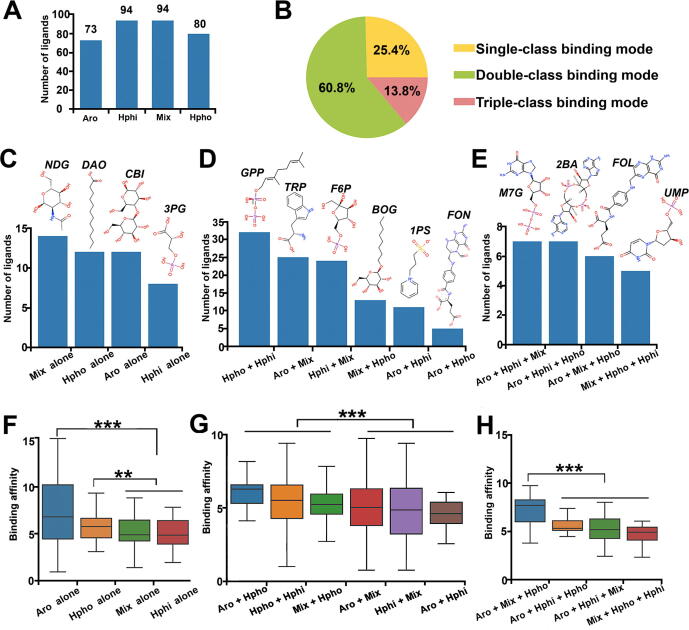
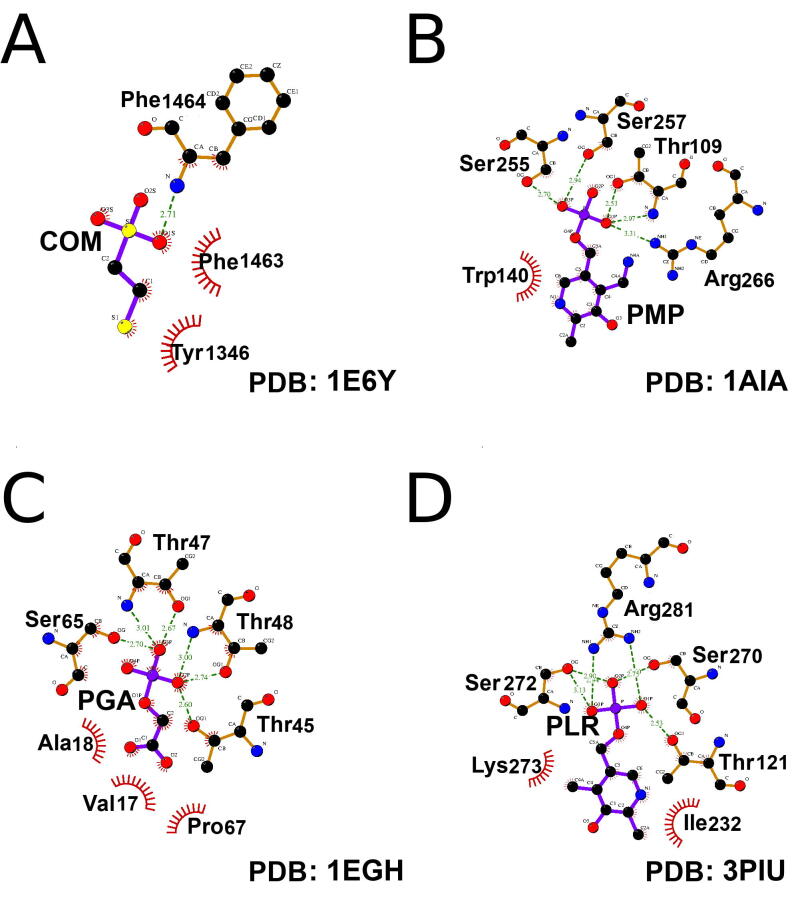
Uncovering conserved 3D protein-ligand binding patterns on the basis of functional groups (FGs) shared by a variety of small molecules can greatly expand our knowledge of protein-ligand interactions. Despite that conserved binding patterns for a few commonly used FGs have been reported in the literature, large-scale identification and evaluation of FG-based 3D binding motifs are still lacking. Here, we propose a computational method, Automatic FG-based Three-dimensional Motif Extractor (AFTME), for automatic mapping of 3D motifs to different FGs of a specific ligand. Applying our method to 233 naturally-occurring ligands, we define 481 FG-binding motifs that are highly conserved across different ligand-binding pockets. Systematic analysis further reveals four main classes of binding motifs corresponding to distinct sets of FGs. Combinations of FG-binding motifs facilitate the binding of proteins to a wide spectrum of ligands with various binding affinities. Finally, we show that our FG-motif map can be used to nominate FGs that potentially bind to specific drug targets, thus providing useful insights and guidance for rational design of small-molecule drugs.

Keywords: Binding motif; Computational method; Drug design; Functional group; Protein–ligand interaction.


Figures

Figure 1
Figure 1
Workflow of AFTME and its application to ATP-binding proteins A. A schematic view of major steps of the AFTME method. B. Two-dimensional clustering of the distance matrix for ATP-binding pockets. The vertical and horizontal axes correspond to FAs and LAs, respectively. The color encodes the distance between an FA and an LA. Three LA clusters corresponding to the triphosphate group, ribose, and adenine ring of ATP were identified, respectively. Three FA clusters or binding motifs (M1, M2, and M3) corresponding to the aforementioned three FGs were also obtained simultaneously. C. Distribution of amino acids and atom properties for M1 (top), M2 (middle), and M3 (bottom). D. An example (PDB: 1VJC) showing the spatial distribution of amino acids within each identified FG-binding motif. E. Different ATP-binding proteins use different combinations of FG-binding motifs M1, M2, and M3. F. Boxplot comparing the number of FAs within ATP-binding pockets with high affinity and those with low affinity. n refers to the number of pockets. G. Comparison of the FA numbers in FG-binding motifs of ATP-binding pockets with high and low affinities. The center line, bounds of box, and whiskers represent the median, interquartile range, and median ± 1.5 times interquartile range, respectively. The significant differences were calculated using Manney-Whitney test (**, P < 0.01; N.S., not significant). FA, functional atom; LA, ligand atom; FG, functional group; AA, amino acid; MFAD, functional atom distance matrix.
Figure 2
Figure 2
Conservation of FG-based 3D binding motifs A.–C. The chemical compositions of adenine- (A), ribose- (B), and triphosphate-binding  (C) motifs identified from proteins binding different ligands are similar. Adenine- and ribose-binding motifs are extracted from ATP-, ADP- and AMP-binding proteins, and triphosphate-binding motifs are obtained from proteins binding ATP, GTP, and UTP, respectively. D.–F. Pairs of adenine- (D), ribose- (E), and triphosphate-binding (F) motifs show significantly higher composition correlation than motif pairs binding random FGs. G. A schematic view of large-scale identification of FG-based binding motifs using AFTME. L, G, and M represent ligand, FG, and motif, respectively. H. Correlation analysis of the 481 identified FG-binding motifs indicates that motifs binding the same FG are highly consistent in their composition. The center line, bounds of box, and whiskers represent the median, interquartile range, and median ± 1.5 times interquartile range, respectively. The significant differences were calculated using two-tailed Student’s t-test (***, P < 0.001).
Figure 3
Figure 3
Systematic mapping of motif classes to different FG types A. FG-binding motifs can be clustered into four well-separated classes, each of which has distinct distribution of amino acids (bar plot with the major amino acid types marked in red rectangular box) and atom types (pie plot, referring to the FA property proportion). B. Venn plot showing different FG-binding preferences for different motif classes. The numbers refer to the counts of FGs within each category. Dominant FG types for each motif class are denoted beside the plot. C.F. Examples of 2D interaction map between FGs and identified motifs. The aromatic motifs identified for cytosine ring of cytidine-5′-monphosphate (PDB: 4G5T, left) and glucose ring in N-acetyl-D-glucosamine (PDB: 6EN3, right) (C). The hydrophilic motifs identified for the carboxyl group of citric acid (PDB: 6FXI, left) and the phosphate group of adenosine-3′-5′-diphosphate (PDB: 1KAI, right) (D). The mixed motifs identified for amino acid isoleucine (PDB: 1Z17, left) and two glucose rings in maltose (PDB: 1AHP, right) (E). The hydrophobic motifs identified for the hexane group of lauric acid (PDB: 2OVD, left) and the farnesyl group in farnesyl diphosphate (PDB: 2E90, right) (F). The 2D ligand–protein interactions were generated by LigPlot .
Figure 4
Figure 4
Combinations of FG-binding motif classes in a ligand-binding pocket A. Distribution of the four classes of FG-binding motifs in ligands. The number above the blue rectangular box represents the counts of ligands in the corresponding FG-binding motif class. B. Proportion of the three different combination modes for motif classes. C.E. Distribution of different FG-binding motif combinations and examples of ligands involved in single-class (C), double-class (D), and triple-class (E) modes. The ligand name and its 2D diagram are indicated above the corresponding blue rectangular box. F.H. Ligand-binding affinity is affected by the combination of FG-binding motif classes for the single-class (F), double-class (G), and triple-class (H) combination modes. The center line, bounds of box, and whiskers represent the median, interquartile range, median ± 1.5 times interquartile range, respectively. The significant differences were calculated using Manney-Whitney test (**, P < 0.01; ***, P < 0.001). Mix, mixed-class; Hpho, hydrophobic-class; Aro, aromatic-class; Hphi, hydrophilic-class.
Figure 5
Figure 5
FGmotif map can be used for rational drug design A. 3D map showing the distribution of FG-binding motifs relative to different FGs of small-molecule drugs (left) and the corresponding 2D ligand–protein interaction map (right) for DOT1L-EPZ5676 complex (PDB: 3SR4). C1, C2, and C3 refer to three FA clusters interacting with adenine, ribose, and methionine of EPZ5676, respectively. B.D. Nomination of potential FG candidates that bind to C1 (B), C2 (C), and C3 (D) of DOT1L. E. 3D map showing the distribution of FG-binding motifs relative to different FGs of small-molecule drugs (left) and the corresponding 2D ligand–protein interaction map (right) for Mpro of COVID-19 in complex with 11b (PDB: 6M0K). C1, C2, and C3 refer to three FA clusters interacting with indole-carboxamide, fluorophenyl, and Ala((2-oxopyrrolidin-3-yl))-al of 11b, respectively. F.H. Nomination of potential FG candidates that bind to C1 (F), C2 (G), and C3 (H) of Mpro. In (A) and (E), atoms with different physicochemical property are rendered in different colors: hydrophobic (green), polar (purple), and aromatic (yellow), and the 2D ligand–protein interaction maps are generated by LigPlot . In (B–D) and (F–H), FGs are ranked based on the FM score; the dash line indicates the top 20% hits with highest probabilities to bind the specific target; and the red dots are specific FGs or FG types that significantly enriched in the top. The name of specific FG or FG type together with the frequency of its appearance in the top and the corresponding P value are displayed in the corner. The significant differences were calculated using Fisher’s exact test. FM, FG-matching.
Supplementary figure 1
Four examples showing the 3D distribution of the amino acids within three different FG-binding motifs for ATP. Amino acids involved in different functional group FG-binding motifs are marked in different colors: triphosphate-motif (red), adenine-motif (green), and ribose-motif (blue) are circled together with the corresponding functional group using dash lines in the same color. FG, functional group.
Supplementary figure 2
Effect of metal ions in global ligand-binding profile. A. An example of ATP-binding sites composed of only motif for triphosphate group and two Mg ions. B. The 2D protein–ligand interaction map showing how metal ions affect the global interaction patterns between functional atoms and ATP. The figure is generated with LigPlot software.
Supplementary figure 3
FG-binding motifs for ligands share same functional group with ATP. 2D structures and corresponding heatmaps showing the FG-binding motifs identified using AFTME for adenine and ribose in (A) ADP and (B) AMP, triphosphate group in (C) GTP and (D) UTP. The functional group(s) shared with ATP in each ligand are marked with dashed rectangles. FG, functional group.
Supplementary figure 4
Significance of conservation scores among multi-ligand FGs. Bar plots showing the significance of conservation scores of FGs appeared in multiple ligands in the dataset, the specific P values are displayed in Table 1. FGs, functional groups.
Supplementary figure 5
Elbow plot finding the optimal number of clustering. The plot showing the number of clusters selected in k-means clustering and the corresponding sum of squared distances. An optimal number of 4 was determined at the “elbow” of the plot.
Supplementary figure 6
Examples of hydrophobic-hydrophilic binding modes. 2D protein–ligand interaction maps for four different ligands contains a hydrophobic and a polar FG, which interact with hydrophobic and hydrophilic motifs respectively. The figures are generated with LigPlot software. FG, functional group.
Supplementary figure 7
Interaction patterns for different ligand binding modes. Examples of 2D protein–ligand interaction maps for different ligands involved in (A) same-type-binding mode, (B) two-type-binding mode, and (C) three-type-binding mode. The figures are generated with LigPlot software.

Similar articles

References

    1. Paul S.M., Mytelka D.S., Dunwiddie C.T., Persinger C.C., Munos B.H., Lindborg S.R., et al. How to improve R&D productivity: the pharmaceutical industry's grand challenge. Nat Rev Drug Discov. 2010;9:203–214. - PubMed
    1. Loewenstein Y., Raimondo D., Redfern O.C., Watson J., Frishman D., Linial M., et al. Protein function annotation by homology-based inference. Genome Biol. 2009;10:207. - PMC - PubMed
    1. Persson J., Beall B., Linse S., Lindahl G. Extreme sequence divergence but conserved ligand-binding specificity in Streptococcus pyogenes M protein. PLoS Pathog. 2006;2:e47. - PMC - PubMed
    1. Abrusan G., Marsh J.A. Ligand binding site structure influences the evolution of protein complex function and topology. Cell Rep. 2018;22:3265–3276. - PMC - PubMed
    1. Du X., Li Y., Xia Y.L., Ai S.M., Liang J., Sang P., et al. Insights into protein-ligand interactions: mechanisms, models, and methods. Int J Mol Sci. 2016;17:144. - PMC - PubMed