. 2022 Mar;10(3):e003715.
doi: 10.1136/jitc-2021-003715.

T cell receptor engineering of primary NK cells to therapeutically target tumors and tumor immune evasion

Affiliations

T cell receptor engineering of primary NK cells to therapeutically target tumors and tumor immune evasion

Laura T Morton et al. J Immunother Cancer. 2022 Mar.

Abstract

Background: T cell receptor (TCR)-engineered cells can be powerful tools in the treatment of malignancies. However, tumor resistance by Human Leukocyte antigen (HLA) class I downregulation can negatively impact the success of any TCR-mediated cell therapy. Allogeneic natural killer (NK) cells have demonstrated efficacy and safety against malignancies without inducing graft-versus-host-disease, highlighting the feasibility for an 'off the shelf' cellular therapeutic. Furthermore, primary NK cells can target tumors using a broad array of intrinsic activation mechanisms. In this study, we combined the antitumor effector functions of NK cells with TCR engineering (NK-TCR), creating a novel therapeutic strategy to avoid TCR-associated immune resistance.

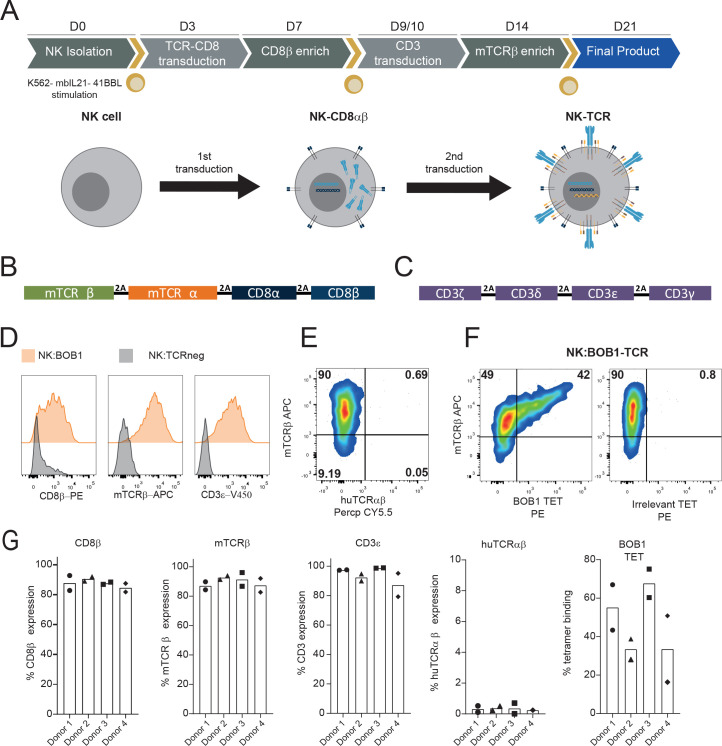
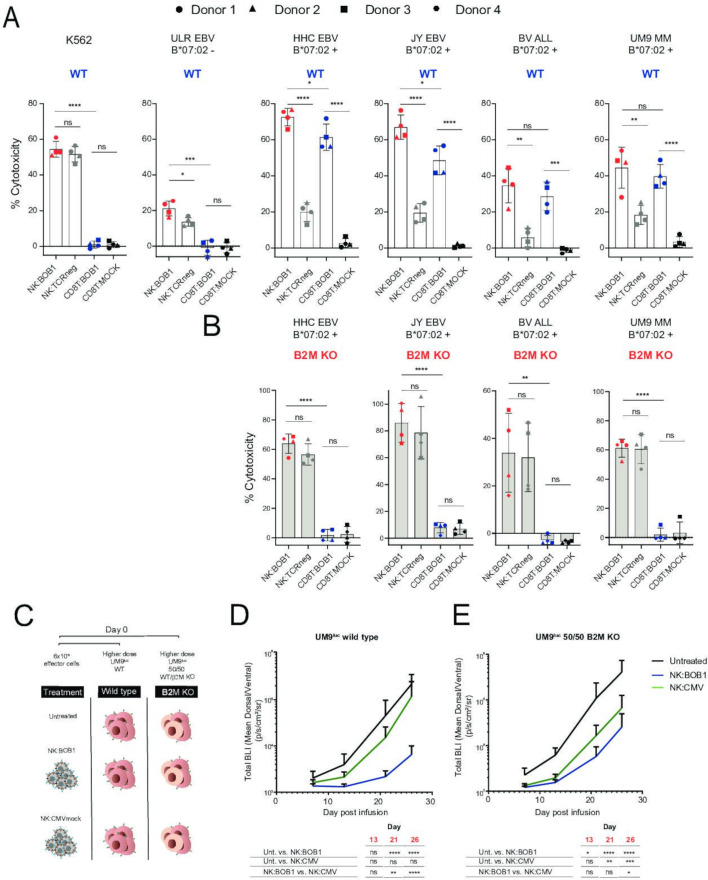
Methods: BOB1, is a transcription factor highly expressed in all healthy and malignant B cell lineages, including multiple myeloma (MM). Expression of an HLA-B*07:02 restricted BOB1-specifc TCR in peripheral blood-derived NK cells was achieved following a two-step retroviral transduction protocol. NK-TCR was then compared with TCR-negative NK cells and CD8-T cells expressing the same TCR for effector function against HLA-B*07:02+ B-cell derived lymphoblastoid cell lines (B-LCL), B-cell acute lymphoblastic leukemia and MM cell lines in vitro and in vivo.

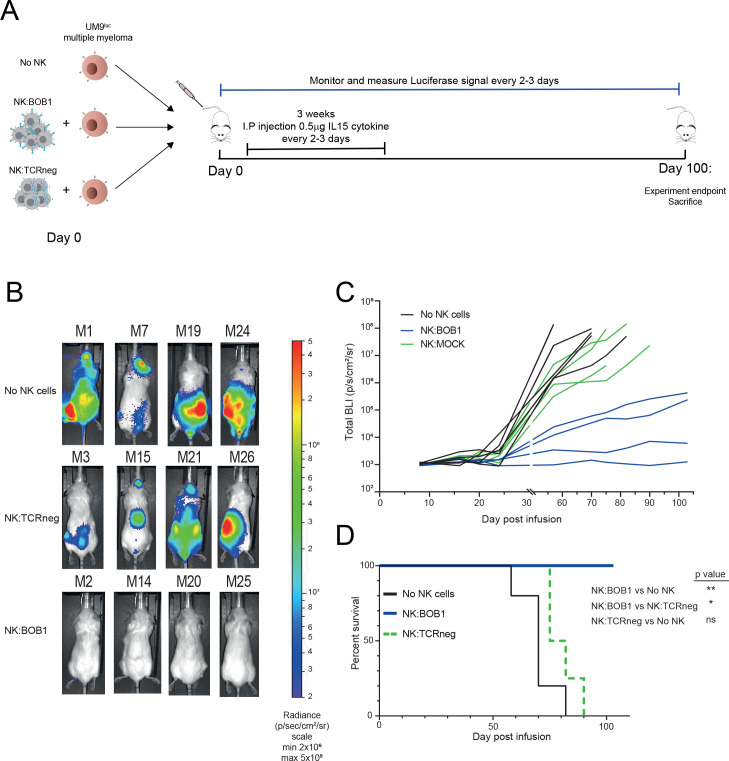
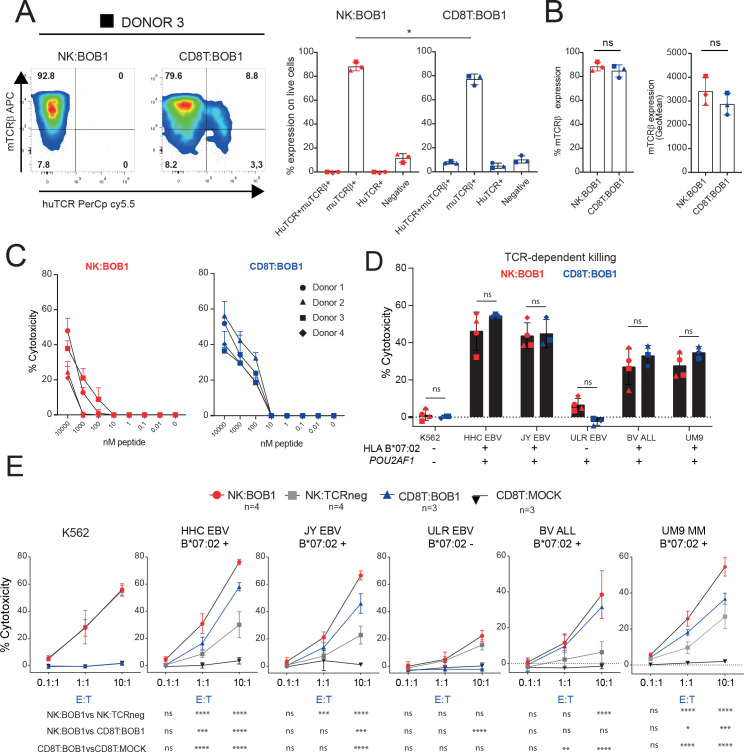
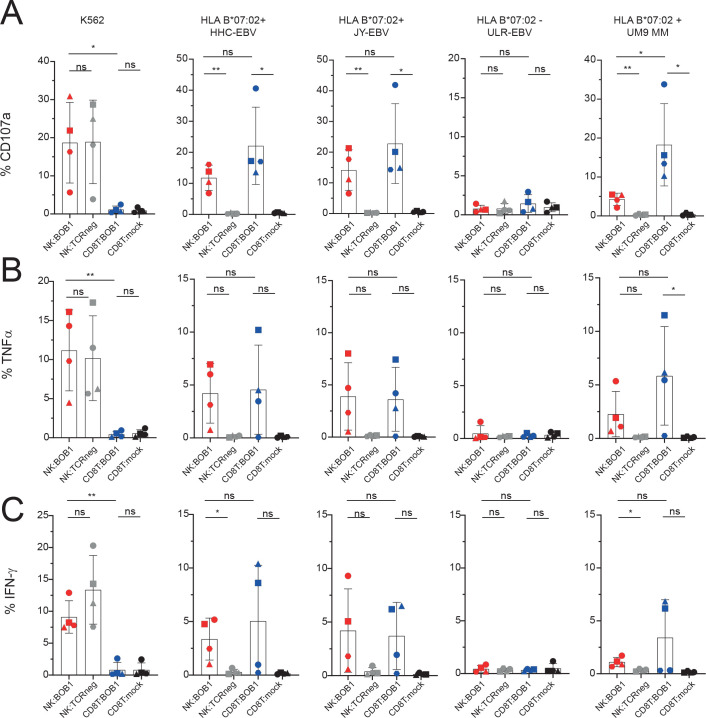
Results: Firstly, TCR could be reproducibly expressed in NK cells isolated from the peripheral blood of multiple healthy donors generating pure NK-TCR cell products. Secondly, NK-TCR demonstrated antigen-specific effector functions against malignancies which were previously resistant to NK-mediated lysis and enhanced NK efficacy in vivo using a preclinical xenograft model of MM. Moreover, antigen-specific cytotoxicity and cytokine production of NK-TCR was comparable to CD8 T cells expressing the same TCR. Finally, in a model of HLA-class I loss, tumor cells with B2M KO were lysed by NK-TCR in an NK-mediated manner but were resistant to T-cell based killing.

Conclusion: NK-TCR cell therapy enhances NK cell efficacy against tumors through additional TCR-mediated lysis. Furthermore, the dual efficacy of NK-TCR permits the specific targeting of tumors and the associated TCR-associated immune resistance, making NK-TCR a unique cellular therapeutic.

Keywords: cell engineering; immunologic; immunotherapy; killer cells; natural; receptors; tumor escape.


Conflict of interest statement

Competing interests: None declared.

Figures

Figure 1
Figure 1
Generation of TCR expressing NK cells following a two-step retroviral production protocol. (A) Schematic of the 21-day production protocol to generate TCR expressing NK cells (NK-TCR). Retroviral construct design for (B) TCR linked via 2A sites to CD8ab (TCR-CD8) and (C) CD3ζδεγ invariant chains linked via 2A sites. (D) Representative histograms of CD8β, mTCRβ, CD3ε and human TCRαβ expression in a final NK-TCR cell product expressing BOB1-specific TCR (NK:BOB1) or NK cells without TCR expression (NK:TCRneg) on day 21. Representative FACS plot of NK:BOB1 stained for (E) mTCRβ and human (hu) TCRαβ expression and with (F) BOB1 or an irrelevant pMHC tetramer on day 21 post isolation. (G) Summary of expression frequencies of CD8β, mTCRβ, CD3ε, huTCRαβ expression and BOB1-specific tetramer binding frequencies on day 21 of NK:BOB1 cell products generated from four different donors. NK:BOB1 was generated twice for each donor. Means and individual values are depicted. NK, natural killer; TCR, T cell receptor.
Figure 2
Figure 2
NK-TCR elicit antigen-specific cytotoxicity against tumor targets. NK cells expressing the HLA-B*07:02 restricted, BOB1-specific TCR (NK:BOB1) or negative for TCR expression (NK:TCRneg) were co-cultured, at multiple E:T ratios, with 51Cr labeled (A) K562-mbIL21-41BBL or HLA-B*07:02±EBV LCLs, (B) HLA-B*07:02+fibroblasts negative for BOB1 expression, (C) HLA-B*07:02+B ALL cell line (BV-ALL) or HLA-B*07:02+ multiple myeloma cell line UM9 and leukapheresis samples from HLA-B*07:02+ patients with (D) B-cell acute lymphocytic leukemia (B-ALL) or (E) B-cell chronic lymphocytic leukemia (B-CLL). Each patient material had >70% malignant cells present and was untreated. (A)–(E): Error bars represent mean and SD of technical triplicates. (F) Summary of % cytotoxicity at the highest E:T ratio (5:1) from four NK cell products generated from different donors. Statistical test used was paired t-test. E:T, effector:target ratio; NK, natural killer; TCR, T cell receptor.
Figure 3
Figure 3
NK-TCR increases survival of treated mice in a preclinical model of multiple myeloma. (A) Schematic of experiment setup, NOD scid gamma (NSG) mice were infused intravenously with 0.4×10⁶ HLA-B*07:02+, luciferase-expressing UM9 multiple myeloma cell line alone (No NK, n=5) or simultaneously with 6×10⁶ NK cells expressing BOB1-TCR (NK:BOB1, n=4) or TCR negative NK cells (NK:TCRneg, n=4) in the presence of human IL15 cytokine. Mice were injected every 2–3 days with 0.5 µg IL15 for 3 weeks. For measurement, mice were injected intraperitoneally with luciferin and measured for bioluminescence. (B) Bioluminescent images of mice at day 70. (C) Tumor burden as measured by bioluminescence of UM9 over time. Each line represents an individual mouse. (D) Kaplan-Meier survival curve of mice receiving No NK cells, NK:BOB1 and NK:TCRneg. Remaining mice were sacrificed on day 100 at experiment end. Differences between survival was analyzed using Gehan-Breslow-Wilcoxon test. IL, interleukin; NK, natural killer; TCR, T cell receptor.
Figure 4
Figure 4
Dual-targeting characteristics of NK-TCR enhanced overall cytotoxicity against tumor targets. Alongside NK:BOB1, CD8 T-cells (CD8T), with CRISPR-mediated knock out of endogenous TCRαβ chains, were transduced to express murinized BOB1-specific TCR (CD8T:BOB1) or mock transduced with murinized CMV-specific TCR (CD8T:MOCK). (A) Representative FACS plot and summary data of mTCRβ and huTCRαβ expression in NK:BOB1 (D7 post stimulation) and CD8T:BOB1 (D10 post stimulation) generated from the same three healthy donors. (B) Overall expression frequencies and geometric mean of mTCRβ expression in CD8T:BOB1 and NK:BOB1. Error bars represent mean and SD from biological replicates. (C) % cytotoxicity of NK:BOB1 and CD8T:BOB1 against HLA-B*07:02 CD8T target cells, exogenously loaded with BOB1(B7)-peptide (APAPTAVVL) at a 10:1 E:T ratio. Each symbol represents a different donor and error bars represent mean and SD of biological replicates. Statistical test used was unpaired t-test. (D) TCR-dependent killing of NK:BOB1 and CD8T:BOB1 calculated as the difference between NK:BOB1\NK:TCRneg and CD8T:BOB1\CD8T:MOCK cytotoxicity at the highest E:T ratio. POU2AF1 encodes the BOB1 protein. (E) Combined data from multiple donors depicting the % cytotoxicity of NK:BOB1 (n=4), NK:TCRneg (n=4), CD8T:BOB1 (n=3) and CD8T:MOCK (n=3) co-cultured with HLA-class I negative K562, HLA-B*07:02±EBV LCLs, HLA-B*07:02+B ALL cell line (BV-ALL) and HLA-B*07:02+multiple myeloma cell line UM9. (A, B, D, E) Mean and SD of biological replicates are depicted, comparisons were made using unpaired t-tests. (C) Mean and SD of technical triplicates are depicted for four donors. E:T, effector:target ratio; NK, natural killer; TCR, T cell receptor.
Figure 5
Figure 5
NK-TCR demonstrate antigen-specific degranulation and cytokine production. CD8T expressing BOB1-TCR or CMV-TCR (day 10 (D10) post stimulation) and NK cells expressing BOB1-TCR or TCR negative NK cells (day 7 post stimulation) were co-cultured overnight with HLA-class I negative K562, HLA-B*07:02±EBV LCLs, HLA-B*07:02+B ALL cell line (BV-ALL) and HLA-B*07:02+multiple myeloma cell line UM9 in the presence of Brefeldin-A and anti-CD107a. After 12–14 hours of incubation, cells were stained for inflammatory cytokines TNFα and IFN-γ and assessed by FACS. Depicted is the combined data of cell products derived from different donors for (A) CD107a, (B) TNFα and (C) IFN-γ expression. Live NK cells were gated on CD56 expression and live CD8T were gated on CD8 expression. Positive cells were gated according to unstimulated. Target cells were td-tomato positive and were removed from analysis. Each symbol represents a different donor and error bars represent mean and SD of biological replicates. Statistical test used was unpaired t-test. IFN, interferon; natural killer; TCR, T cell receptor; TNF, tumor necrosis factor.
Figure 6
Figure 6
NK-TCR demonstrate NK-mediated killing of tumor targets with HLA-class I loss. NK cells expressing the BOB1-specific TCR (NK:BOB1) or TCR negative NK cells (NK:TCRneg) and CD8T expressing BOB1-TCR (CD8T:BOB1) or CMV-TCR (CD8T:MOCK) were co-cultured with HLA-B*07:02+tumor targets which were either (A) wild type or (B) B2M KO. Depicted is the combined cytotoxicity data at 10:1 E:T ratio by cell products derived from four different healthy donors. Each symbol represents a different donor and error bars represent mean and SD of biological replicates. Statistical test used was unpaired t-test. (C) Schematic representation of high-dose tumor burden experiment. (D) NOD scid gamma (NSG) mice were infused intravenously with a total 0.8×10⁶ (higher dose) UM9luc alone (untreated, n=4) or simultaneously with 6×10⁶ NK:BOB1, n=5 or CMV-TCR expressing NK cells (NK:CMV n=4). (E) NSG mice were infused intravenously with a 50/50 mix of 0.4×10⁶ wild-type UM9luc and 0.4×10⁶ UM9luc B2M KO cells alone (untreated, n=4) or simultaneously with 6×10⁶ NK:BOB1, n=7 or NK:CMV n=6. IL15 was infused every 2–3 days for 3 weeks. Experiment endpoint was 6 days after IL15 withdrawal. Error bars represent mean and SD and statistical analysis was calculated using one-way analysis of variance with Tukey’s multiple comparison. B2M KO, β-2-microglobulin knock-out; E:T, effector:target ratio; IL, interleukin; NK, natural killer; TCR, T cell receptor; WT, wild type.

References

    1. Brown CE, Mackall CL. CAR T cell therapy: inroads to response and resistance. Nat Rev Immunol 2019;19:73–4. 10.1038/s41577-018-0119-y - DOI - PubMed
    1. Maude SL, Laetsch TW, Buechner J, et al. . Tisagenlecleucel in children and young adults with B-cell lymphoblastic leukemia. N Engl J Med 2018;378:439–48. 10.1056/NEJMoa1709866 - DOI - PMC - PubMed
    1. Xu X, Sun Q, Liang X, et al. . Mechanisms of relapse after CD19 CAR T-cell therapy for acute lymphoblastic leukemia and its prevention and treatment strategies. Front Immunol 2019;10:2664. 10.3389/fimmu.2019.02664 - DOI - PMC - PubMed
    1. Bethge WA, Hegenbart U, Stuart MJ, et al. . Adoptive immunotherapy with donor lymphocyte infusions after allogeneic hematopoietic cell transplantation following nonmyeloablative conditioning. Blood 2004;103:790–5. 10.1182/blood-2003-07-2344 - DOI - PubMed
    1. Kolb H-J. Graft-versus-leukemia effects of transplantation and donor lymphocytes. Blood 2008;112:4371–83. 10.1182/blood-2008-03-077974 - DOI - PubMed

Publication types

Substances