. 2022 Mar;10(3):e003762.
doi: 10.1136/jitc-2021-003762.

PI3Kδ/γ inhibitor BR101801 extrinsically potentiates effector CD8+ T cell-dependent antitumor immunity and abscopal effect after local irradiation

Affiliations

PI3Kδ/γ inhibitor BR101801 extrinsically potentiates effector CD8+ T cell-dependent antitumor immunity and abscopal effect after local irradiation

Yi Na Yoon et al. J Immunother Cancer. 2022 Mar.

Abstract

Background: Radiotherapy enhances antitumor immunity. However, it also induces immunosuppressive responses, which are major hurdles for an effective treatment. Thus, targeting the immunosuppressive tumor microenvironment is essential for enhancing the antitumor immunity after radiotherapy. Retrospective studies show that a blockade of PI3Kδ and/or γ, which are abundant in leukocytes, exhibits antitumor immune response by attenuating activity of immune suppressive cells, however, the single blockade of PI3Kδ or γ is not sufficient to completely eliminate solid tumor.

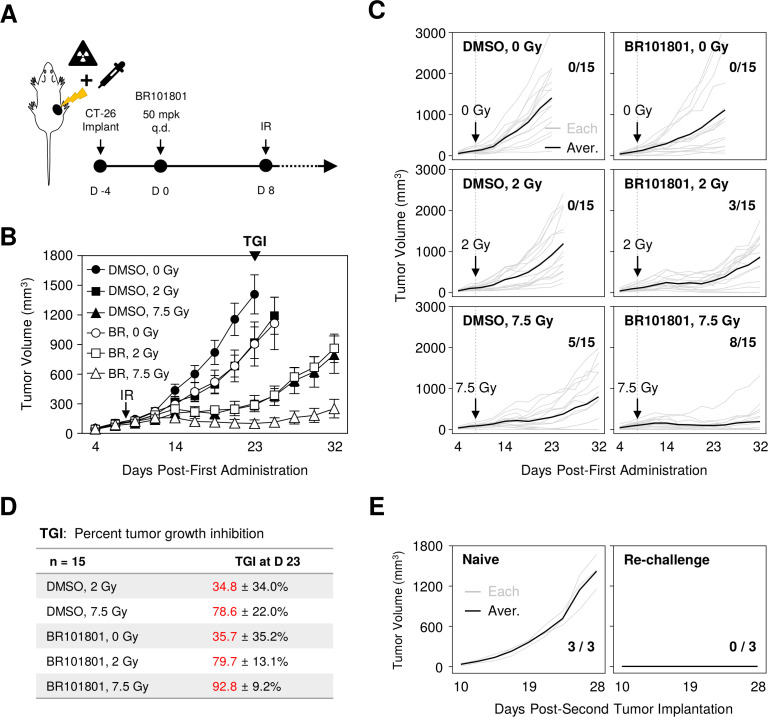
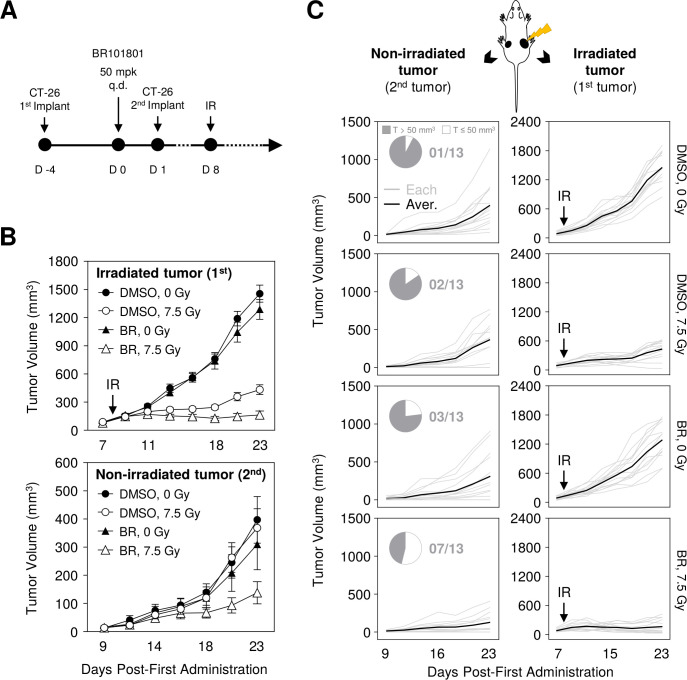
Methods: We used BR101801, PI3Kδ/γ inhibitor in the CT-26 syngeneic mouse model with a subcutaneously implanted tumor. BR101801 was administered daily, and the target tumor site was locally irradiated. We monitored the tumor growth regularly and evaluated the immunological changes using flow cytometry, ELISpot, and transcriptional analysis.

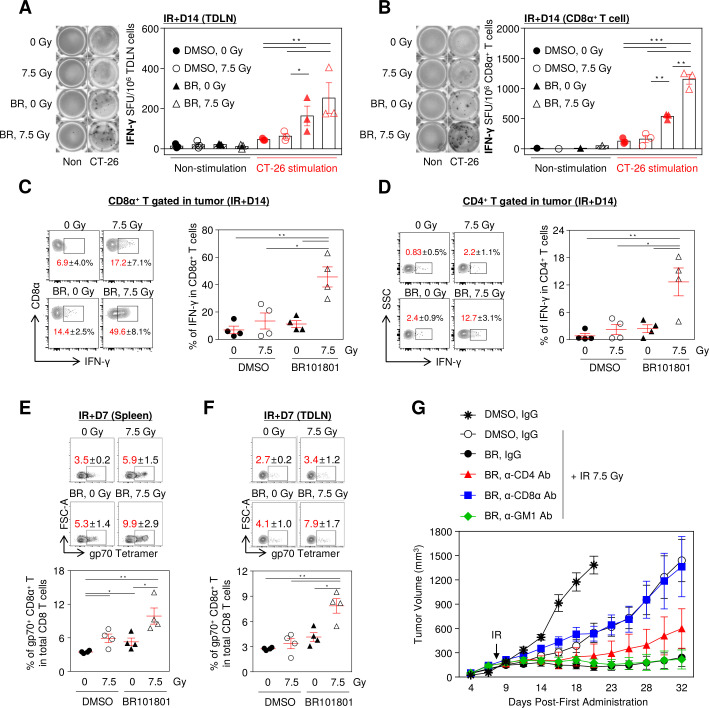
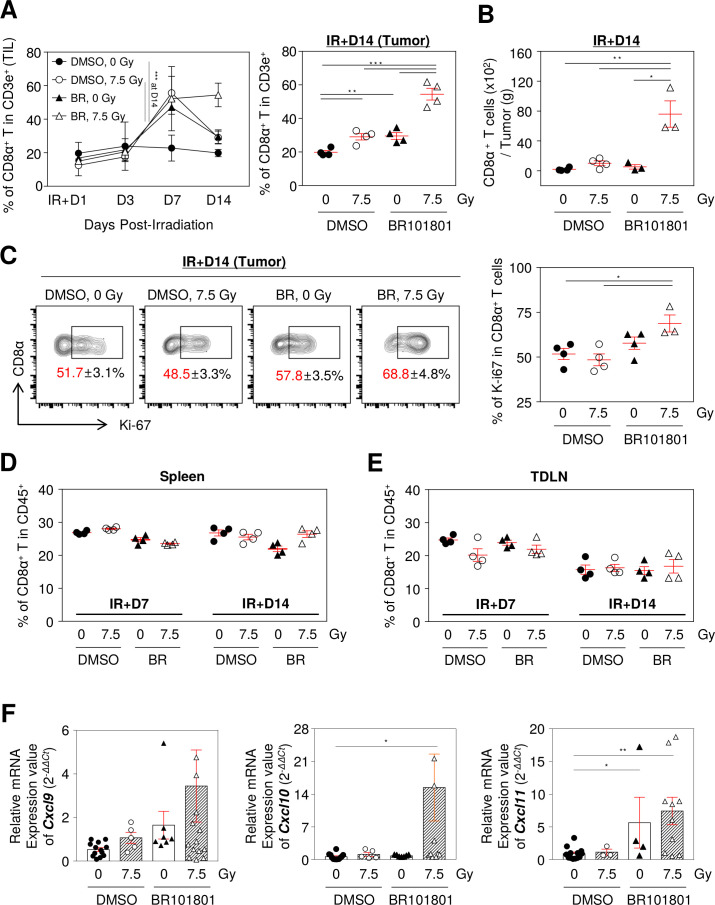
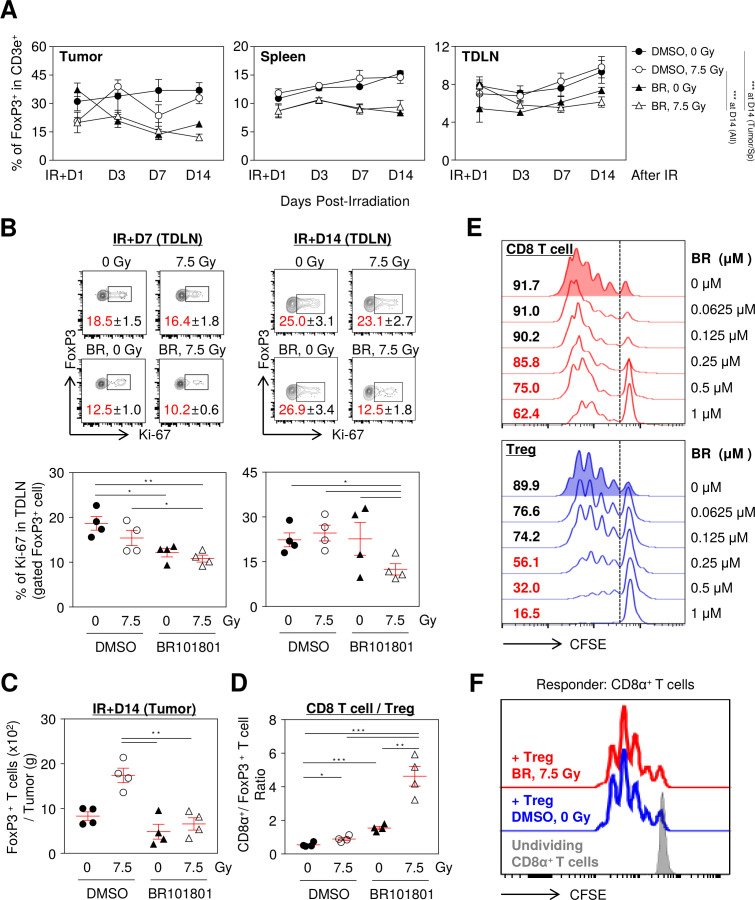
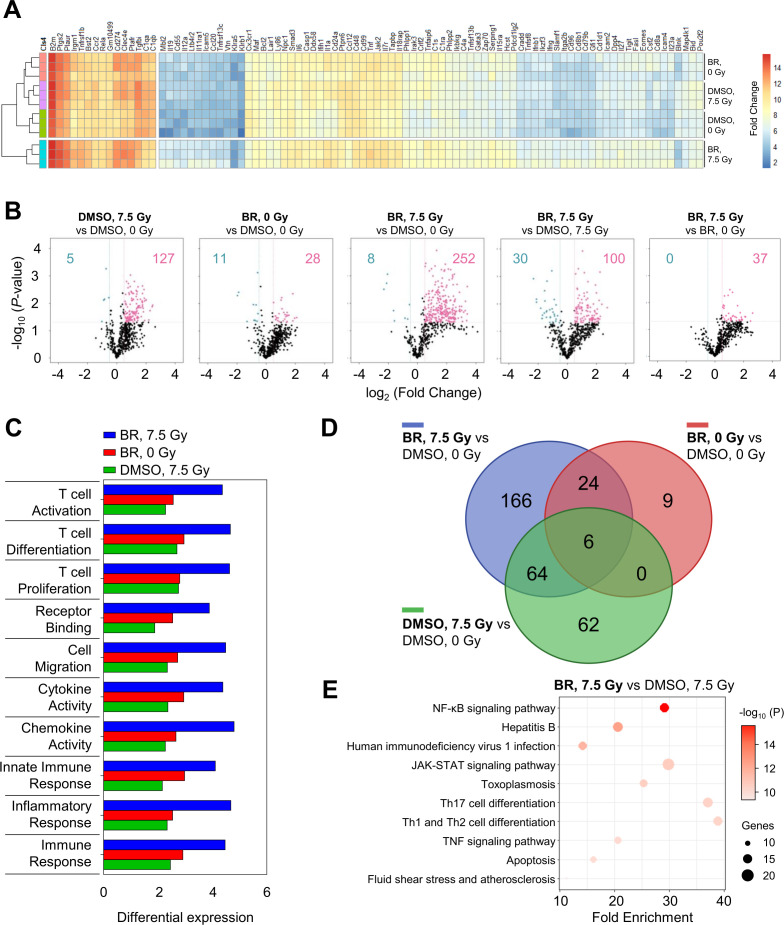
Results: This study showed that BR101801 combined with irradiation promotes systemic antitumor immunity and abscopal response by attenuating the activity of immune suppressive cells in the CT-26 tumor model. BR101801 combined with irradiation systemically reduced the proliferation of regulatory T cells (Tregs) and enhanced the number of tumor-specific CD8α+ T cells in the tumor microenvironment, thereby leading to tumor regression. Furthermore, the high ratio of CD8α+ T cells to Tregs was maintained for 14 days after irradiation, resulting in remote tumor regression in metastatic lesions, the so-called abscopal effect. Moreover, our transcriptomic analysis showed that BR101801 combined with irradiation promoted the immune-stimulatory tumor microenvironment, suggesting that the combined therapy converts immunologically cold tumors into hot one.

Conclusions: Our data suggest the first evidence that PI3Kδ/γ inhibition combined with irradiation promotes systemic antitumor immunity against solid tumors, providing the preclinical result of the potential use of PI3Kδ/γ inhibitor as an immune-regulatory radiosensitizer.

Keywords: immunotherapy; lymphocytes, tumor-infiltrating; radioimmunotherapy; radiotherapy.


Conflict of interest statement

Competing interests: None declared.

Figures

Figure 1
Figure 1
Combining BR101801 and irradiation synergistically increases the antitumor efficacy in CT-26 syngeneic mouse model. (A) Schematic representation of PI3Kδ/γ inhibitor (BR101801) schedules and local irradiation. BALB/c mice-bearing CT-26 colon cancer orally administrated (q.d.) with 50 mg/kg BR101801 for 32 days. The tumor mass was locally irradiated 8 days after the first dose of BR101801. (B) Mean tumor volume of subcutaneous (CT-26) implants in BR101801 and irradiation treated mice (n=15 mice per group). (C) Individual CT-26 tumor growth curves with the number of mice showing complete antitumor response at the end point (black line indicates the mean tumor volume in each group; gray line indicates individual tumor growth). (D) Percentages of tumor growth inhibitor in each group. (E) Tumor growth following CT-26 cells rechallenge to naive mice (left) and complete responder mice (right) with the number of mice showing tumor mass (n=3 mice in the naive and re-implanted group). DMSO, dimethyl sulfoxide.
Figure 2
Figure 2
Combining BR101801 and irradiation induces CD8α+ T cell-mediated antitumor immunity. BALB/c mice-bearing CT-26 colon cancer were orally administrated (q.d.) with 50 mg/kg BR101801 till the sacrifice time point (duration of BR101801 treatment; IR+1: for 9 days, IR+3: for 11 days, IR+7: for 15 days, IR+14: for 22 days). (A) Representative images of IFN-γ ELISpot assay (left) and a graph (right) indicating the number of spots for tumor-draining lymph nodes (TDLNs) induced by BR101801 and irradiation with or without additional stimulated CT-26 cells (n=3 mice per group) (black: non-stimulation, red: CT-26 stimulation). (B) Representative images of IFN-γ ELISpot assay (left) and a graph (right) indicating the number of spots for CD8α+ T cells isolated from TDLNs (n=3 mice per group). (C, D) IFN-γ releasing CD8α+ T cell population in the tumor. cells were stimulated with PMA and ionomycin for 2 hour and accumulated IFN-γ was detected in (C) CD8α+ T cells and (D) CD4+ T cells (n=4 mice per group). (E) Representative contour plots of systemic distribution of tumor antigen (gp70)-specific CD8α+ T cells in spleen (top) and quantification of the percentages of gp70+ CD8α+ T cells in total CD8 T cells (bottom) (n=4 mice per group). (F) Representative contour plots of systemic distribution of gp70-specific CD8α+ T cells in tumor-draining lymph nodes (TDLNs) (top) and quantification of the percentages of gp70+ CD8α+ T cells in total CD8 T cells (bottom) (n=4 mice per group). (G) Antibody-mediated depletion of CD4, CD8 T, and NK cells in BALB/c mice treated with BR101801 for 32 days and irradiation. Each mouse was intraperitoneally injected with 200 µg anti-mouse CD4, CD8, or GM1 antibodies 3 days before irradiation and once a week (n≥4 mice per group). All data are presented as mean±SEM *p<0.05, **p<0.01, ***p<0.001 with an unpaired two-tailed t-test. DMSO, dimethyl sulfoxide.
Figure 3
Figure 3
BR101801 enhances CD8α+ T cells infiltration in response to irradiation in tumor microenvironment. The flow cytometry analysis was performed on day 1, 3, 7, and 14 post-irradiation in the CT-26 tumor and lymphoid organs. (A) The percentage of tumor infiltrated CD8α+ T cells from day 1 to 14 after irradiation (left) and an individual graph of day 14 (right). (B) The absolute number of tumor infiltrated CD8α+ T cells per tumor (g) at day 14. (C) Representative contour plots depicting proliferating expression (Ki-67+) on tumor infiltrated CD8α+ T cells at day 14 (left) and quantitation of the percentages of Ki-67+ tumor infiltrated CD8α+ T cells (right). The percentages of CD8α+ T cells in (D) spleen and (E) TDLN. (F) mRNA expression of Cxcl9, 10, and 11 genes in tumor mass (n≥3 mice per group). All data are presented as mean±SEM *p<0.05, **p<0.01, ***p<0.001 with an unpaired two-tailed t-test. DMSO, dimethyl sulfoxide; TDLN, tumor-draining lymph nodes.
Figure 4
Figure 4
BR101801 reduces regulatory T cell population following irradiation. The flow cytometry analysis was performed on day 1, 3, 7, and 14 postirradiation in the CT-26 tumor and lymphoid organs. (A) The percentage of Tregs from day 1 to 14 after irradiation in tumor (left), spleen (middle), and TDLN (right). (B) Representative contour plots depicting Ki-67+ expression on Tregs at day 7 (top-left) and 14 (top-right) and the percentages of Ki-67+ Tregs (bottom). (C) The absolute number of tumor infiltrated Foxp3+ T cells per tumor (G) at day 14. (D) CD8α+ / Treg ratio at day 14 after irradiation. (E) The proliferative capacity of isolated CD8α+ T cells (top) and CD4+/CD25+ Tregs (bottom) after 3 days in absence or presence of gradient concentration of BR101801 (μM). (F) Representative CFSE dilution flow cytometric histograms showing the suppressive capacity of purified CD3+/CD4+/CD25+/CD127- splenic Tregs against Responder CD8 T cells for 4 days in the presence of immobilized anti-CD3 and soluble anti-CD28. The splenic Tregs were isolated from PI3Kδ/γ inhibition and irradiation treated and DMSO treated mice, and Responder CD8 T cells were isolated from naïve (non-treated) mice (n≥3 mice per group). All data are presented as mean±SEM *p<0.05, **p<0.01, ***p<0.001 with an unpaired two-tailed t-test. DMSO, dimethyl sulfoxide; TDLN, tumor-draining lymph nodes.
Figure 5
Figure 5
Combining BR101801 and irradiation promotes the immune-stimulatory antitumor microenvironment. The gene copy number of CD45+ cells from CT-26 tumor was analyzed using NanoString nCounter immunology panel 7 days after irradiation (n=3 mice per group). (A) Heatmap of mean fold-change in gene expressions of other treatment groups vs DMSO along group for genes that are differently expressed (p<0.01). (B)Volcano plot representation of differential expression analysis of transcripts between two groups as indicating on each panel. (C) Bar graphs indicating undirected global significance scores measured the overall differential expression of the selected genes set relative to DMSO single treatment. (D) Venn diagram of differently expressed genes of other treatment groups vs DMSO alone group. (E) enrichment terms between BR101801, 7.5 Gy group vs DMSO, 7.5 Gy group. Circle size and color indicates the number of genes and statistic significances, respectively. DMSO, dimethyl sulfoxide.
Figure 6
Figure 6
BR101801 enhances the abscopal effect of irradiation by modulating the immunogenic tumor microenvironment. BALB/c mice-bearing CT-26 colon cancer were orally administrated (q.d.) with 50 mg/kg BR101801 for 23 days. (A) Schematic representation of the schedules for abscopal effect model. (B) Mean tumor volume of subcutaneous (CT-26) implants in BR101801 administration and irradiation treated mice at the irradiated site (first tumor, top) and non-irradiated site (second tumor, bottom). (C) Individual CT-26 tumor growth curves of the non-irradiated site (second tumor, left) with the number of mice and pie charts showing under 50 mm3 sized tumor at the endpoint and individual CT-26 tumor growth curves of the irradiated site (first tumor, right) (n=13 mice per group) (the black line indicates the mean tumor volume of each group, the gray line indicates individual tumor growth). DMSO, dimethyl sulfoxide.

References

    1. Weichselbaum RR, Liang H, Deng L, et al. . Radiotherapy and immunotherapy: a beneficial liaison? Nat Rev Clin Oncol 2017;14:365–79. 10.1038/nrclinonc.2016.211 - DOI - PubMed
    1. Li M, You L, Xue J, et al. . Ionizing radiation-induced cellular senescence in normal, non-transformed cells and the involved DNA damage response: a mini review. Front Pharmacol 2018;9:522. 10.3389/fphar.2018.00522 - DOI - PMC - PubMed
    1. Ngwa W, Irabor OC, Schoenfeld JD, et al. . Using immunotherapy to boost the abscopal effect. Nat Rev Cancer 2018;18:313–22. 10.1038/nrc.2018.6 - DOI - PMC - PubMed
    1. Kachikwu EL, Iwamoto KS, Liao Y-P, et al. . Radiation enhances regulatory T cell representation. Int J Radiat Oncol Biol Phys 2011;81:1128–35. 10.1016/j.ijrobp.2010.09.034 - DOI - PMC - PubMed
    1. De Palma M, Lewis CE. Macrophage regulation of tumor responses to anticancer therapies. Cancer Cell 2013;23:277–86. 10.1016/j.ccr.2013.02.013 - DOI - PubMed

Publication types

Substances

LinkOut - more resources