. 2022 Mar 14;13(3):235.
doi: 10.1038/s41419-022-04674-3.

Plasma proteomic and metabolomic characterization of COVID-19 survivors 6 months after discharge

Affiliations

Plasma proteomic and metabolomic characterization of COVID-19 survivors 6 months after discharge

Hongwei Li et al. Cell Death Dis. .

Abstract

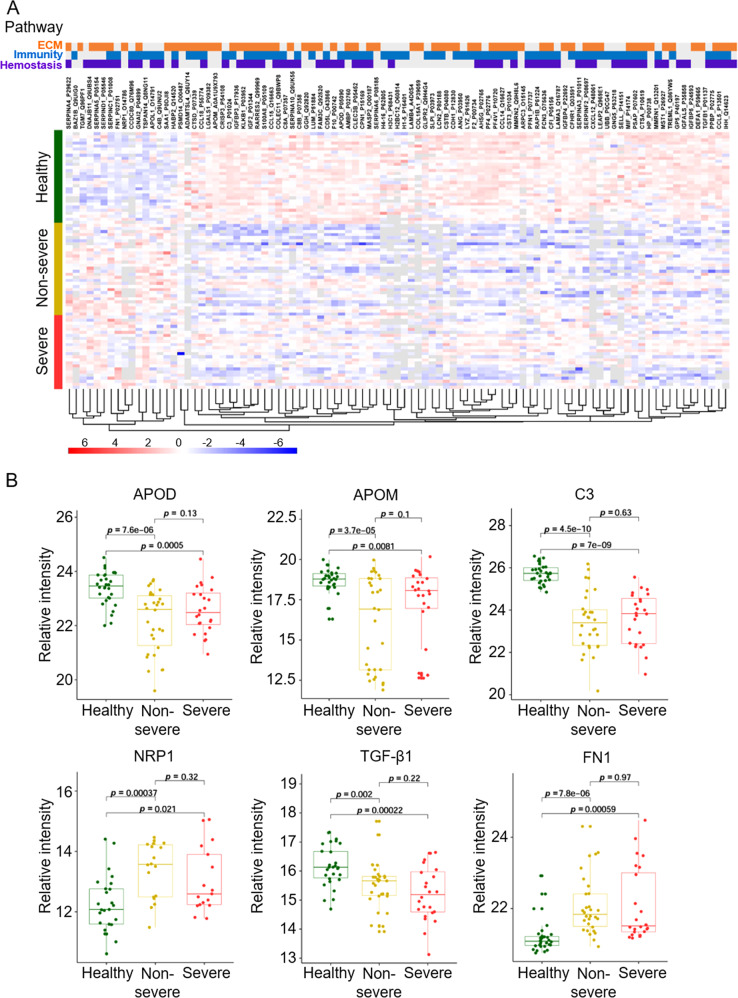
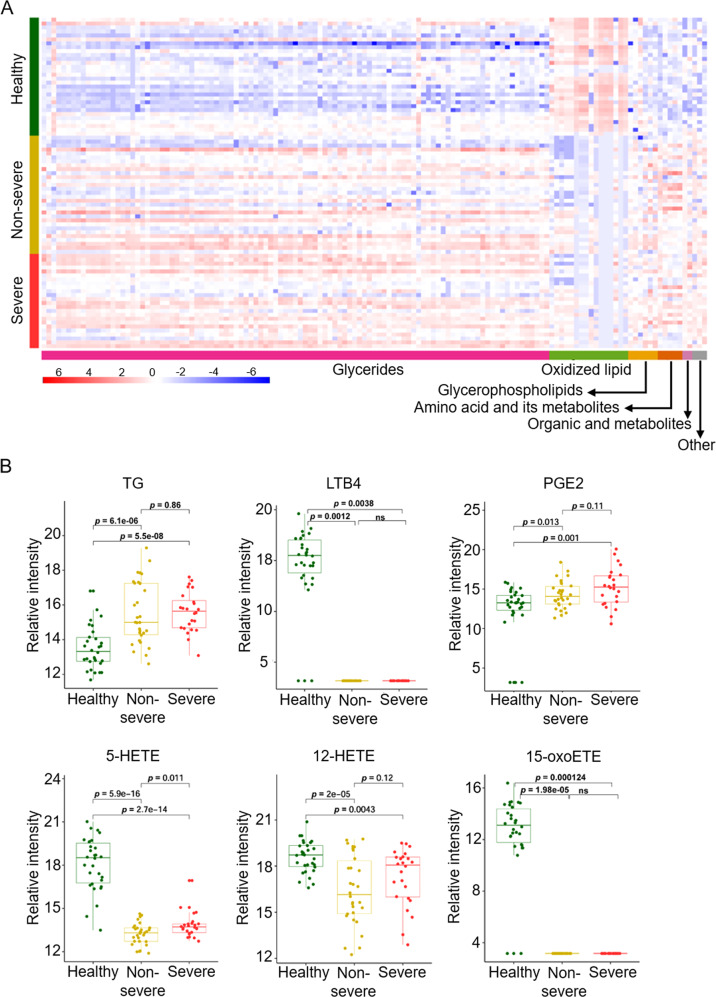
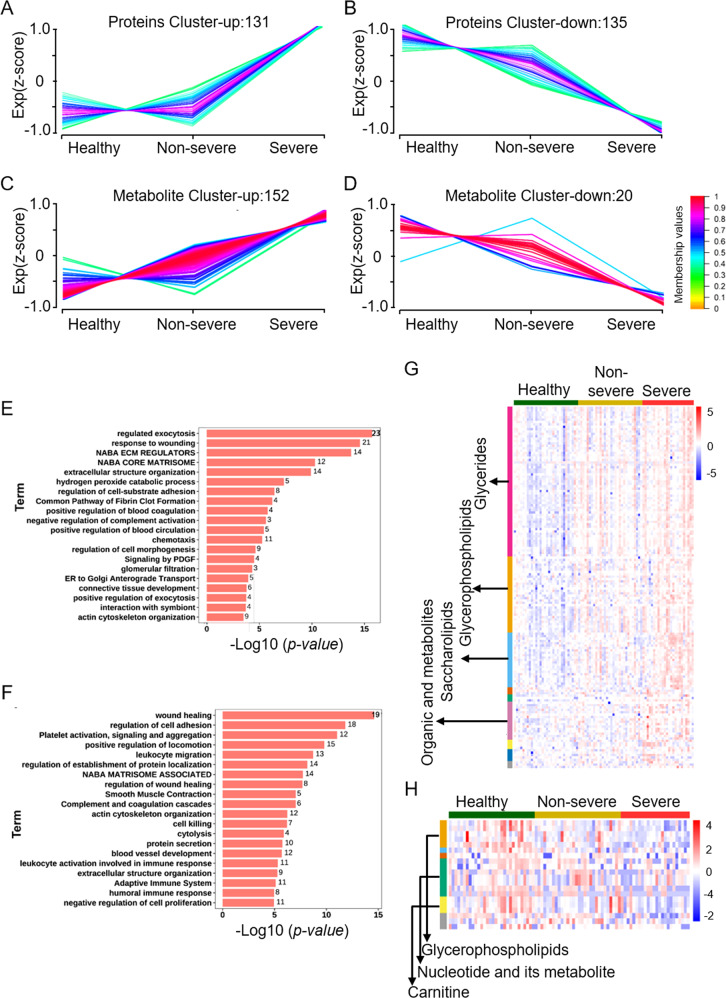
Coronavirus disease 2019 (COVID-19) has gained prominence as a global pandemic. Studies have suggested that systemic alterations persist in a considerable proportion of COVID-19 patients after hospital discharge. We used proteomic and metabolomic approaches to analyze plasma samples obtained from 30 healthy subjects and 54 COVID-19 survivors 6 months after discharge from the hospital, including 30 non-severe and 24 severe patients. Through this analysis, we identified 1019 proteins and 1091 metabolites. The differentially expressed proteins and metabolites were then subjected to Gene Ontology and Kyoto Encyclopedia of Genes and Genomes pathway enrichment analysis. Among the patients evaluated, 41% of COVID-19 survivors reported at least one clinical symptom and 26.5% showed lung imaging abnormalities at 6 months after discharge. Plasma proteomics and metabolomics analysis showed that COVID-19 survivors differed from healthy control subjects in terms of the extracellular matrix, immune response, and hemostasis pathways. COVID-19 survivors also exhibited abnormal lipid metabolism, disordered immune response, and changes in pulmonary fibrosis-related proteins. COVID-19 survivors show persistent proteomic and metabolomic abnormalities 6 months after discharge from the hospital. Hence, the recovery period for COVID-19 survivors may be longer.


Conflict of interest statement

The authors declare no competing interests.

Figures

Fig. 1
Fig. 1. Overview of the study design.
A Flow chart of inclusion and exclusion for COVID-19 patients enrolled in this study. B Schematic summary of the study design and patient cohort. C PCA plot of the proteomics data from the plasma samples. Each dot represents one plasma sample, color-coded for the different groups. Green, yellow, and red data points are healthy control subjects and non-severe and severe COVID-19 survivors at 6 months after discharge, respectively. D PCA plot of the metabolomics data from the plasma samples. Each dot represents one plasma sample, color-coded for the different groups as described for panel (C).
Fig. 2
Fig. 2. Proteomic profiling of plasma samples obtained from COVID-19 survivors 6 months after discharge and healthy control subjects.
A Heatmap visualization of significantly differentially expressed proteins (DEPs) whose regulation concentrated on three enriched pathways. The graphs show the relative intensity of DEPs. Proteins included in the heatmap meet the requirement that fold-change >1.5 or <0.67 and p value (t test) of <0.05. p values were then adjusted using the Benjamini-Hochberg correction (false discovery rate, <0.05). The color bar represents the relative intensity of identified proteins from −6 to 6. B The boxplots show six proteins, which are significantly different between COVID-19 survivors 6 months after discharge and healthy control subjects. Healthy group, n = 30; non-severe group, n = 30; severe group, n = 24. APOD apolipoprotein D; APOM apolipoprotein M; C3 complement 3; FN1 fibronectin 1; NRP1 Neuropilin-1; TGFβ1 transforming growth factor beta 1.
Fig. 3
Fig. 3. Metabolomics profiling of plasma samples obtained from COVID-19 survivors 6 months after discharge and healthy control subjects.
A Heatmap visualization of significantly different altered metabolites (DEMs) in COVID-19 survivors at 6 months after discharge and in healthy control subjects. Metabolites included in the heatmap showed a fold-change >2 or <0.5 and p value (t test) of <0.05. The color bar represents the relative intensity of identified proteins from −6 to 6. B Boxplots of six elected metabolites that significantly differed between COVID-19 survivors at 6 months after discharge and healthy control subjects. For the healthy control group, n = 30; for the non-severe group, n = 30; for the severe group, n = 24. 5-HETE 5-hydroxyeicosatetraenoic acid; 12-HETE 12-hydroxyeicosatetraenoic acid; LTB4 leukotriene B4; 15-oxoETE 15-oxoeicosatetraenoic acid; PGE2 prostaglandin E2; TG triglycerides.
Fig. 4
Fig. 4. Expression profiles were analyzed according to protein and metabolic abundance between severe and non-severe COVID-19 survivors 6 months after discharge.
AD The result of cluster analysis in processing conditions (Healthy-Non-severe-Severe) by the Mfuzz package. The result of continuous up-regulation proteins (A) and continuous down-regulation proteins (B). Results of continuously up-regulated metabolites (C) and continuously down-regulated metabolites (D). Numbers of proteins and metabolites are indicated for each cluster. Color bar represents Z score change from −1 to 1. E, F Barplot for function enrichment result (including KEGG and GO) for up-regulated proteins (E, protein cluster-up) and down-regulated proteins (F, protein cluster-down) (Top20); p value < 0.05 was identified as significantly changed terms. The X axis shows the p value of each term, and Y axis shows the function terms. G, H Heatmap visualization of up-regulated metabolites (G, metabolites cluster-up) and down-regulated metabolites (H, metabolites cluster-down) under the processing conditions (healthy, non-severe, severe).

References

    1. Siemieniuk RA, Bartoszko JJ, Ge L, Zeraatkar D, Izcovich A, Kum E, et al. Drug treatments for covid-19: living systematic review and network meta-analysis. BMJ. 2020;370:m2980. - PMC - PubMed
    1. Anka AU, Tahir MI, Abubakar SD, Alsabbagh M, Zian Z, Hamedifar H, et al. Coronavirus disease 2019 (COVID-19): an overview of the immunopathology, serological diagnosis and management. Scand J Immunol. 2021;93:e12998. - PMC - PubMed
    1. Bakadia BM, He F, Souho T, Lamboni L, Ullah MW, Boni BO, et al. Prevention and treatment of COVID-19: Focus on interferons, chloroquine/hydroxychloroquine, azithromycin, and vaccine. Biomed Pharmacother. 2021;133:111008. - PMC - PubMed
    1. Berekaa MM. Insights into the COVID-19 pandemic: Origin, pathogenesis, diagnosis, and therapeutic interventions. Front Biosci (Elite Ed) 2021;13:117–39. - PubMed
    1. Mohamadian M, Chiti H, Shoghli A, Biglari S, Parsamanesh N, Esmaeilzadeh A. COVID-19: Virology, biology and novel laboratory diagnosis. J Gene Med. 2021;23:e3303. - PMC - PubMed

Publication types