. 2022 Mar 14;13(1):1321.
doi: 10.1038/s41467-022-28852-1.

Rescuing low frequency variants within intra-host viral populations directly from Oxford Nanopore sequencing data

Affiliations

Rescuing low frequency variants within intra-host viral populations directly from Oxford Nanopore sequencing data

Yunxi Liu et al. Nat Commun. .

Abstract

Infectious disease monitoring on Oxford Nanopore Technologies (ONT) platforms offers rapid turnaround times and low cost. Tracking low frequency intra-host variants provides important insights with respect to elucidating within-host viral population dynamics and transmission. However, given the higher error rate of ONT, accurate identification of intra-host variants with low allele frequencies remains an open challenge with no viable computational solutions available. In response to this need, we present Variabel, a novel approach and first method designed for rescuing low frequency intra-host variants from ONT data alone. We evaluate Variabel on both synthetic data (SARS-CoV-2) and patient derived datasets (Ebola virus, norovirus, SARS-CoV-2); our results show that Variabel can accurately identify low frequency variants below 0.5 allele frequency, outperforming existing state-of-the-art ONT variant callers for this task. Variabel is open-source and available for download at: www.gitlab.com/treangenlab/variabel .


Conflict of interest statement

F.S. received research support from PacBio and ONT. The remaining authors declare no competing interests.

Figures
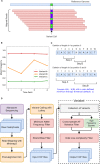
Fig. 1
Fig. 1. Illustration of Variabel algorithm and workflow.
A Sequencing reads from ONT are aligned to the reference genome of SARS-CoV-2 with Minimap2, then variants are called based on the alignments using LoFreq. The figure shows 4 reference supporting (green) reads and 5 alternative supporting reads (blue) amounting to an overall of 55.6% allele frequency within this sample. B Cross-sample AF variation filter identifies variants that are shared between samples. Variant calls with maximum AF less 0.65 and maximum AF variation less than 0.05 are classified as false calls. In this example, variant A and B pass the filter while variant C fails. C Low-entropy filter calculates the Shannon’s entropy H for subsequences (Seq A and B) of the reference genome around the position where the indel call occurs. The length of the subsequences is determined by the length of the indel. Product of two entropy of the subsequences is used to determine whether the indel is a false positive or not. D Workflow of Variabel for detecting intra-host variants for ONT sequences.
Fig. 2
Fig. 2. Variants called by LoFreq with Illumina and ONT sequences before and after applying Variabel for COVID-19 datasets.
In each of the subfigures, the left plot shows the variant calls before applying variabel and the right plot shows the variant calls after applying variabel. The x-axis shows the position of the variant on the reference genome. The y-axis shows the minimum allele frequency of the variant found in multiple samples. Variants found in the Illumina sequences only are marked in blue, and variants found in the ONT sequences only are marked in red. Variants that are shared between both Illumina and ONT data are shown in green. The size of the dot represents the number of samples supporting the variant. A Variant calls of the time series dataset. B Variant calls of the cross-patient dataset. For both A and B, source data are provided as a Source Data file.
Fig. 3
Fig. 3. Intra-host variant detection on COVID-19 datasets.
A Venn diagram showing counts of variant calls shared between LoFreq on Illumina sequencing runs and Variabel and Clair3 on nanopore sequencing runs on the same samples from the time series dataset. B False positive rates at different variant allele frequencies and cumulative count of false positive variant calls of Variabel and Clair3 for the time series dataset. C Precision, recall, and F-score comparison of LoFreq default, Clair3, and Variabel on both the time series dataset (n = 18 samples from the same COVID-19-positive patient collected over distinct time points) and the cross-patient dataset (n = 103 biologically independent samples collected from COVID-19-positive patients). Each box plot includes both median line (solid) and mean line (dashed), and the box bounds the interquartile range (IQR). The Tukey-style whiskers extend from the box by at most 1.5 × IQR. The circle denotes outliers that extend beyond the whiskers. Significance between Clair3 and Variabel were calculated using the two-sided paired t-test. Significance labeling: n.s.(P > 0.05), *(P ≤ 0.05), **(P ≤ 0.01), ***(P ≤ 0.001). The exact p-values of the two-sided paired t-test of precision, recall, and F-score between Clair3, and Variabel for the time series dataset are 3.36 × 10−11, 0.479, and 9.26 × 10−7. The exact p-values of the two-sided paired t-test of precision, recall, and F-score between Clair3, and Variabel for the cross-patient dataset are 1.63 × 10−8, 3.86 × 10−9, and 4.98 × 10−4. For A, B, and C, source data are provided as a Source Data file.
Fig. 4
Fig. 4. Intra-host variant detection on the COVID-19 cross-patient dataset.
A Venn diagram showing counts of variant calls shared between LoFreq on Illumina sequencing runs and Variabel and Clair3 on nanopore sequencing runs on the same samples from the cross-patient dataset. B Simulation of fraction of shared variants recovered from different sizes of collections of COVID-19 samples. For both A and B, source data are provided as a Source Data file.
Fig. 5
Fig. 5. Intra-host variant detection on Ebola virus and norovirus datasets.
A Variant calls before and after filtering by Variabel for the Ebola virus dataset. The x-axis shows the positions of the variant calls on the reference genome, and the y-axis shows the minimum allele frequency the same variant calls among the samples. Variant calls before the filtering are marked in blue and the variant calls after applying Variabel are marked in red. The size of the dot shows the number of samples in which the variant is detected. B Variant calls before and after filtering by Variabel for the norovirus dataset. The x-axis shows the positions of the variant calls on the reference genome, and the y-axis shows the minimum allele frequency the same variant calls among the samples. Variant calls before the filtering are marked in blue and the variant calls after applying Variabel are marked in red. The size of the dot shows the number of samples in which the variant is detected. For both A and B, source data are provided as a Source Data file.
Fig. 6
Fig. 6. False positive rate analysis with the synthetic datasets.
A The bar plot with x-axis on the left shows the total number of variant calls in the synthetic dataset before and after applying Variabel. The line with x-axis on the right shows the false positive rate at each minimum coverage setting. The variant calls are pre-filtered with 4 different minimum coverage settings (y-axis) before applying Variabel. B The stacked bar plot showing the number of unique variants removed by different filters of Variabel. The variants removed by the low-entropy filter are shown in green, and the variants removed by the AF variation filter are shown in orange. The remaining false positive calls are shown in blue. For both A and B, source data are provided as a Source Data file.

Update of

References

    1. Bull RA, et al. Analytical validity of nanopore sequencing for rapid SARS-CoV-2 genome analysis. Nat. Commun. 2020;11:6272. doi: 10.1038/s41467-020-20075-6. - DOI - PMC - PubMed
    1. Nicholls SM, et al. CLIMB-COVID: continuous integration supporting decentralised sequencing for SARS-CoV-2 genomic surveillance. Genome Biol. 2021;22:196. doi: 10.1186/s13059-021-02395-y. - DOI - PMC - PubMed
    1. Sapoval N, et al. SARS-CoV-2 genomic diversity and the implications for qRT-PCR diagnostics and transmission. Genome Res. 2021;31:635–644. doi: 10.1101/gr.268961.120. - DOI - PMC - PubMed
    1. Kemp SA, et al. SARS-CoV-2 evolution during treatment of chronic infection. Nature. 2021;592:277–282. doi: 10.1038/s41586-021-03291-y. - DOI - PMC - PubMed
    1. Lythgoe, K. A. et al. SARS-CoV-2 within-host diversity and transmission. Science372, eabg0821 (2021). - PMC - PubMed

Publication types