. 2022 Mar 14;13(1):1328.
doi: 10.1038/s41467-022-28996-0.

Oxidative metabolisms catalyzed Earth's oxygenation

Affiliations

Oxidative metabolisms catalyzed Earth's oxygenation

Haitao Shang et al. Nat Commun. .

Abstract

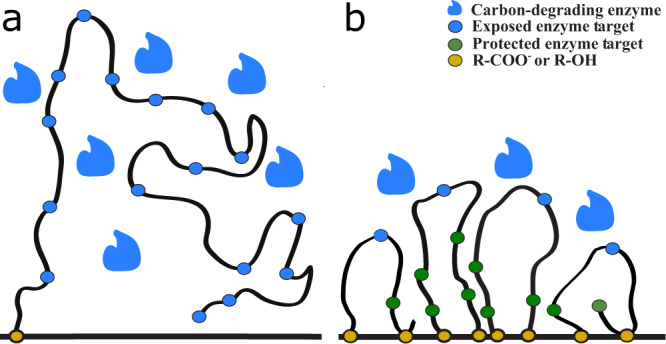
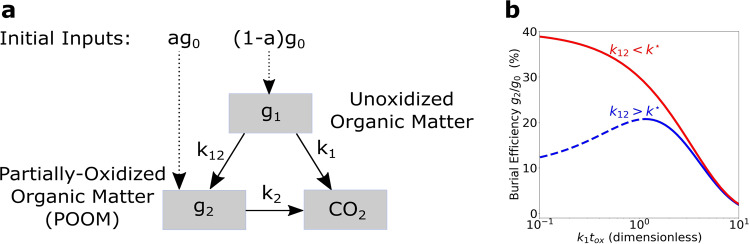
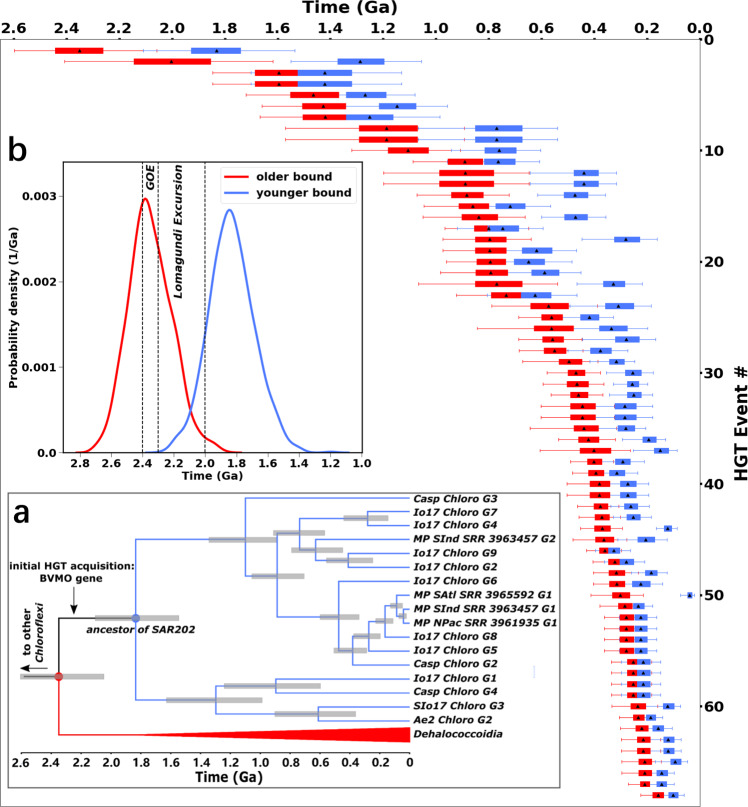
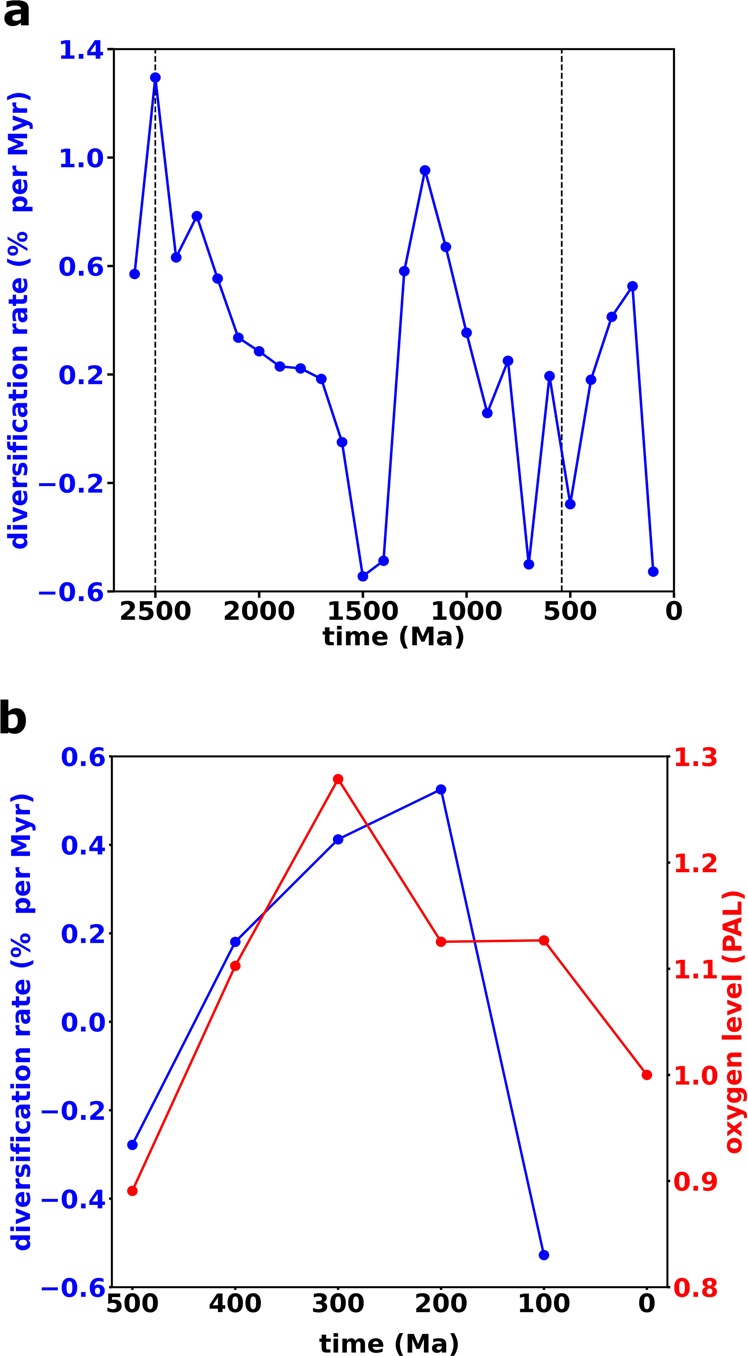
The burial of organic carbon, which prevents its remineralization via oxygen-consuming processes, is considered one of the causes of Earth's oxygenation. Yet, higher levels of oxygen are thought to inhibit burial. Here we propose a resolution of this conundrum, wherein Earth's initial oxygenation is favored by oxidative metabolisms generating partially oxidized organic matter (POOM), increasing burial via interaction with minerals in sediments. First, we introduce the POOM hypothesis via a mathematical argument. Second, we reconstruct the evolutionary history of one key enzyme family, flavin-dependent Baeyer-Villiger monooxygenases, that generates POOM, and show the temporal consistency of its diversification with the Proterozoic and Phanerozoic atmospheric oxygenation. Finally, we propose that the expansion of oxidative metabolisms instigated a positive feedback, which was amplified by the chemical changes to minerals on Earth's surface. Collectively, these results suggest that Earth's oxygenation is an autocatalytic transition induced by a combination of biological innovations and geological changes.


Conflict of interest statement

The authors declare no competing interests.

Figures

Fig. 1
Fig. 1. Comparison of biopolymers and their interaction with mineral surfaces before and after partial degradation by oxidative metabolisms.
Panel (a) illustrates a generic scenario in which only one site of the biopolymer is sorbed to the mineral surface (horizontal line) and the exposed enzyme targets on the biopolymer are freely accessible to carbon-degrading enzymes secreted by microorganisms. Panel (b) shows the result of further degradation of the biopolymer in (a) after partial oxidation. Reactive oxygen-containing functional groups, such as carboxyls (R-COO) and hydroxyls (R-OH) are formed by oxidative enzymes (e.g., Baeyer–Villiger monooxygenases) that catalyze the production of partially oxidized organic matter in the presence of O2. These functional groups create additional sorption sites, enhancing the association of the shorter organic carbon chains with the mineral surface. These partially oxidized, shorter organic carbon chains in (b) are more constrained compared to (a); consequently a large portion of enzyme targets on these shorter organic carbon chains are relatively inaccessible to microbial enzymes. Compared to (a), their degradation requires more investment of free energy to overcome the energy barrier that prevents enzyme access. The juxtaposition of (a) and (b) shows how partial oxidation impedes the biopolymer’s accessibility to microbial enzymes and enhances its potential for long-term preservation.
Fig. 2
Fig. 2. A theoretical prediction of a positive feedback responsible for Earth’s oxygenation.
a Degradation paths of unoxidized organic matter and partially oxidized organic matter (POOM). The quantities g1 and g2 represent the amount of unoxidized organic matter and the amount of (physically protected) POOM deposited in sediments, respectively. Unoxidized organic matter is either directly oxidized to CO2 with a rate constant k1 or transformed to POOM with a rate constant k12. POOM is oxidized to CO2 with a rate constant k2. b Burial efficiency g2/g0 as a function of dimensionless oxygen-exposure time k1tox. Positive feedback occurs when burial efficiency increases with oxygen-exposure time (blue dashed curve), which requires k12 > k [Eq. (6)].
Fig. 3
Fig. 3. Phylogenetic and molecular clock analyses for the Baeyer–Villiger monooxygenases (BVMOs) of the SAR202 cluster bacteria and their closely related microbial species.
The main figure shows a graphic summary for weighted means and 95% confidence intervals (CIs) of the older and younger time bounds (n = 1023 posterior samples for the BVMO gene tree chronogram) for 68 inferred horizontal gene transfer (HGT) events between/within the Chloroflexi, Actinobacteria, and Proteobacteria phyla presented in Supplementary Information, Supplementary Table 5. The directions (i.e., donors and recipients) of these HGT events are provided in Supplementary Table 6. In the main figure, red and blue boxes represent older and younger time bounds, respectively. The right and left bounds of each box are the 25th and 75th percentiles, respectively; the right and left whiskers mark the 2.5th and 97.5th percentiles, respectively; the black triangles represent means. a A subtree of calibrated chronogram showing SAR202 (blue) and related Dehalococcoidia group (red); the complete chronogram is provided in Supplementary Fig. 4. The initial HGT acquisition (also illustrated in Supplementary Fig. 7) occurred on the branch between stem SAR202 node (red filled circle) and crown node SAR202 (blue filled circle). Gray horizontal bars on the nodes indicate 95% CIs (n = 1023 posterior samples for the BVMO gene tree chronogram). b The posterior date intervals of the older and younger age bounds for the initial HGT event into SAR202 (i.e., the stem (red) and crown (blue) SAR202 nodes in (a)). Stem and crown date intervals correspond to the distributions of older (red) and younger (blue) time bounds for the initial HGT acquisition shown in (a), and also correspond to the HGT event #1 shown in the main figure. The mean date of older bound is 2350 Ma (95% CI: 2056 Ma–2598 Ma), and the mean date of younger bound is 1830 Ma (95% CI: 1535 Ma–2110 Ma), where n = 1023 posterior samples for the BVMO gene tree chronogram. The time windows of the Great Oxidation Event and the Lomagundi Excursion Event overlap the distributions of older and younger time bounds.
Fig. 4
Fig. 4. Diversification of SAR202 Baeyer–Villiger monooxygenase (BVMO) genes and its temporal correlation with the evolution of Earth’s atmospheric O2 levels.
a Evolution of the per-gene diversification rate of the SAR202 BVMO genes over geologic time. The two vertical dashed lines represent the Archean/Proterozoic boundary and Proterozoic/Phanerozoic boundary, respectively. Three positive peaks stand out, during the Neoarchean/Paleoproterozoic (around 2500 Ma), the Middle/Late Mesoproterozoic (around 1200 Ma), and the Late Paleozoic/Early Mesozoic (around 300–200 Ma), corresponding, respectively, to the time of the Great Oxidation Event, the rapid divergence of eukaryotic marine algae, and the Permo-Carboniferous O2 pulse. b The temporal correlation between the SAR202 BVMO diversification rate (blue) and Earth’s atmospheric O2 level (red) in the Phanerozoic. The red dots from 100 Ma to 500 Ma are the moving averages of the O2 levels in, using an averaging window of 200 Myr, which is the uncertainty range (i.e., 95% confidence interval) of the age distributions in the Phanerozoic on the gene tree chronogram of BVMO homologs (Supplementary Fig. 4). The O2 concentration at time 0 is the present atmospheric level (PAL).

References

    1. Canfield, D. E. Oxygen: A Four Billion Year History (Princeton University Press, 2014).
    1. Lyons TW, Reinhard CT, Planavsky NJ. The rise of oxygen in Earth’s early ocean and atmosphere. Nature. 2014;506:307–315. - PubMed
    1. Catling DC, Claire MW. How Earth’s atmosphere evolved to an oxic state: a status report. Earth Planet. Sci. Lett. 2005;237:1–20.
    1. Catling DC, Zahnle KJ, McKay CP. Biogenic methane, hydrogen escape, and the irreversible oxidation of early Earth. Science. 2001;293:839–843. - PubMed
    1. Kump LR, Barley ME. Increased subaerial volcanism and the rise of atmospheric oxygen 2.5 billion years ago. Nature. 2007;448:1033–1036. - PubMed

Publication types