. 2022 Mar 14;13(1):1303.
doi: 10.1038/s41467-022-28809-4.

The arginine methyltransferase PRMT7 promotes extravasation of monocytes resulting in tissue injury in COPD

Affiliations

The arginine methyltransferase PRMT7 promotes extravasation of monocytes resulting in tissue injury in COPD

Gizem Günes Günsel et al. Nat Commun. .

Abstract

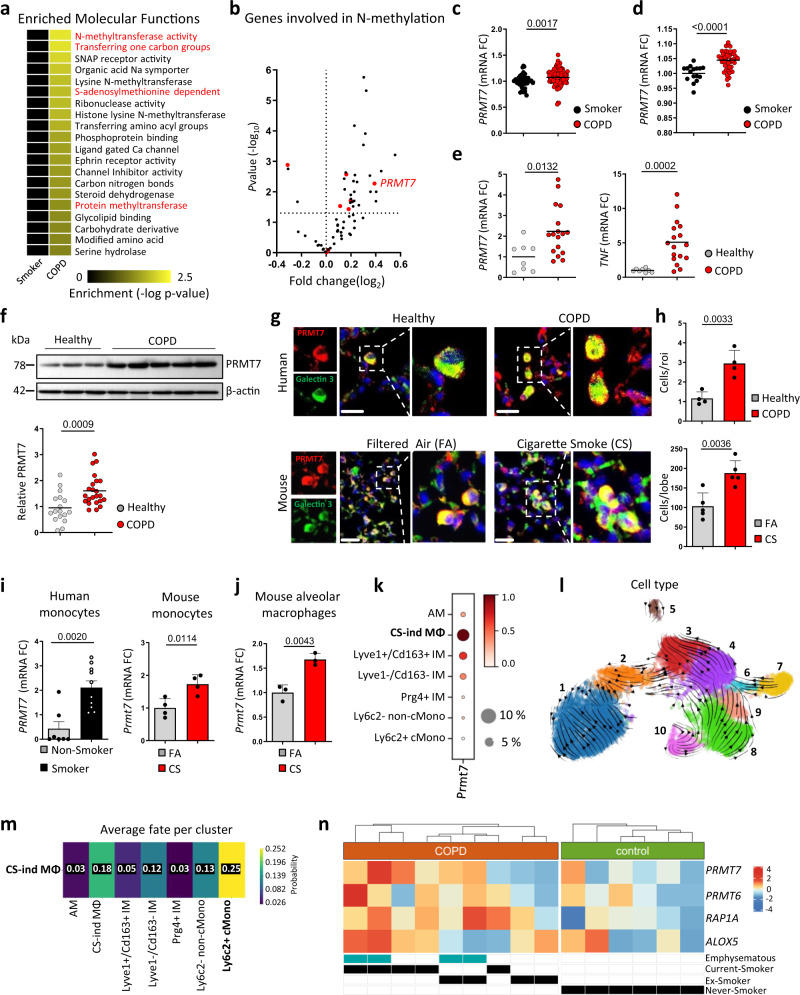
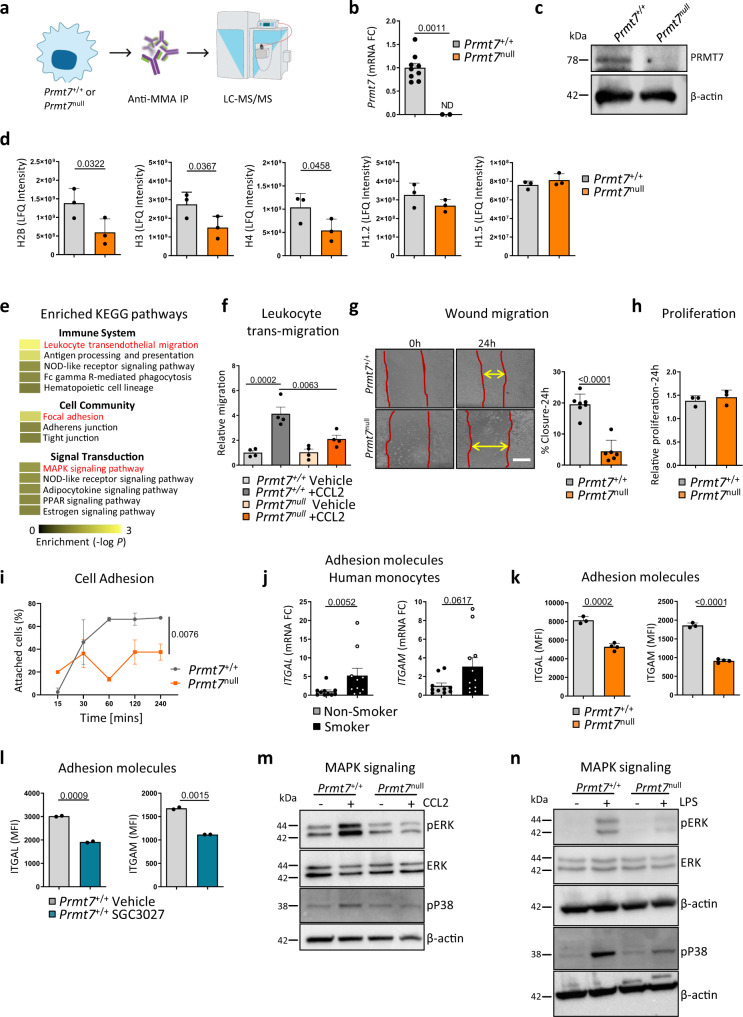
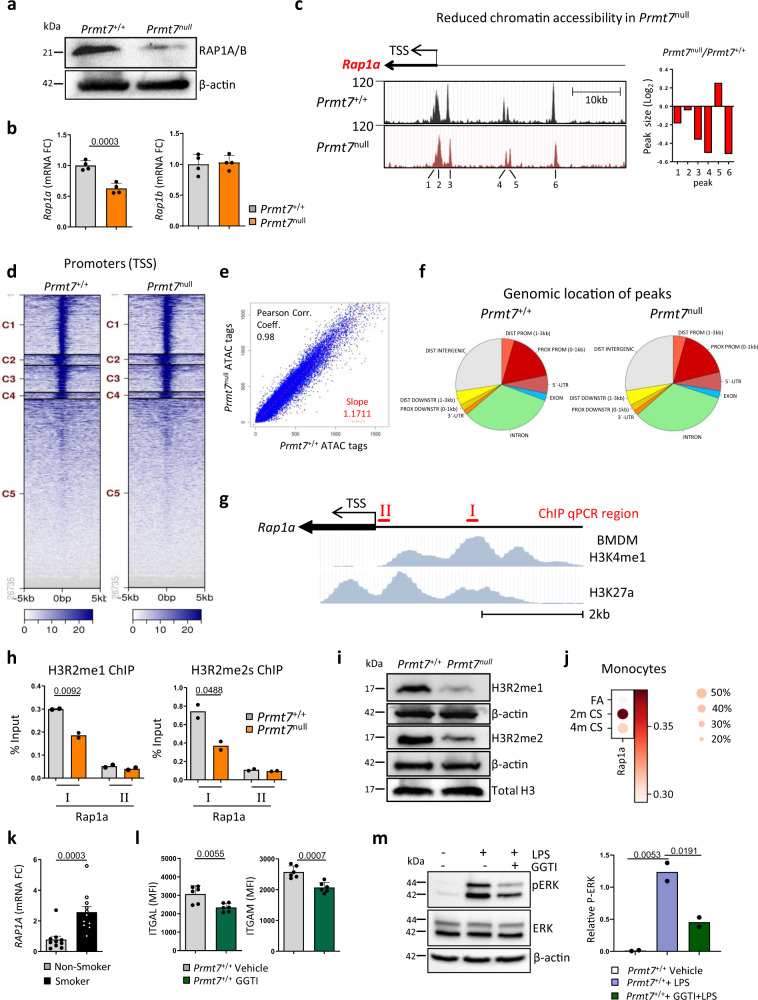
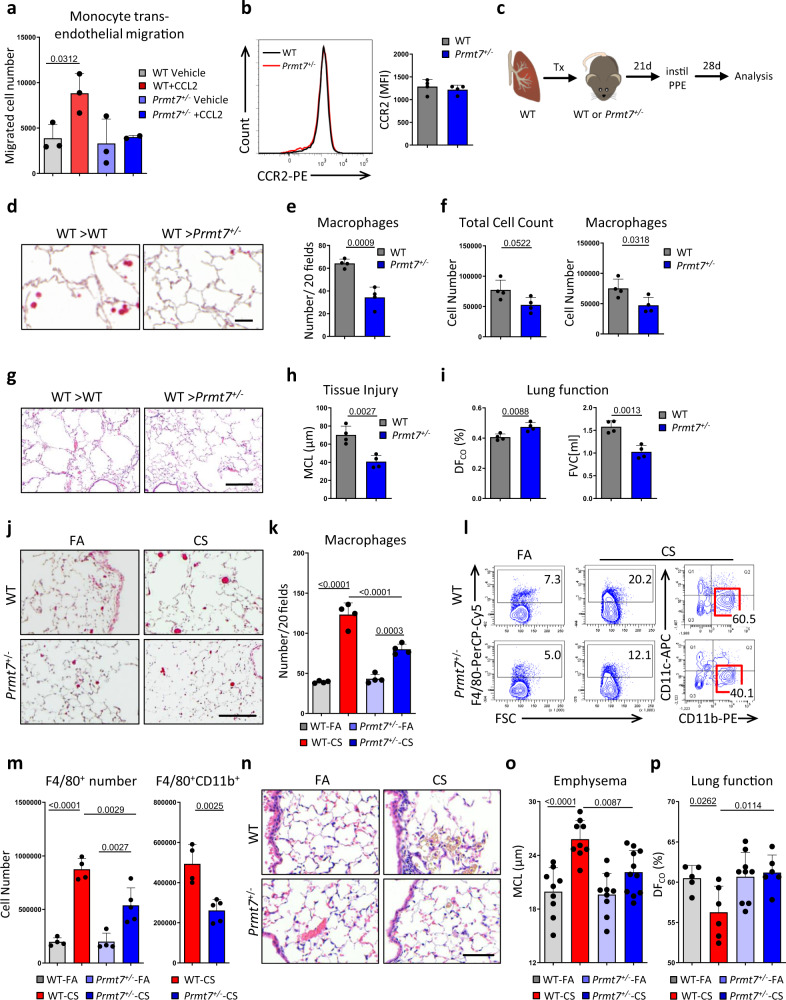
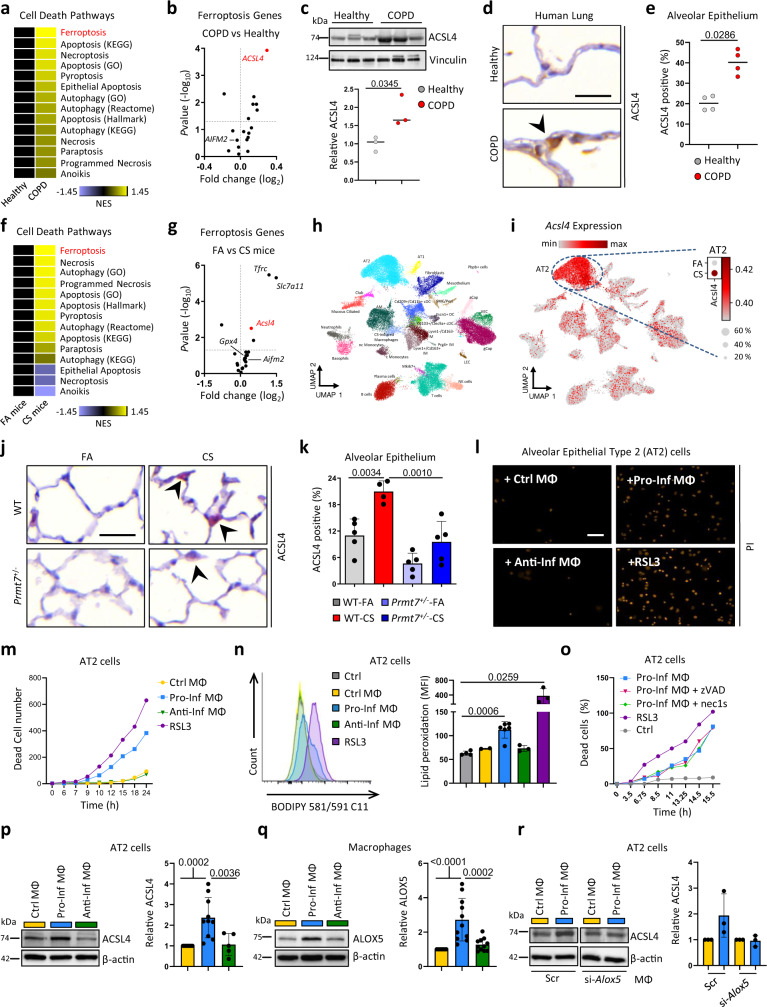
Extravasation of monocytes into tissue and to the site of injury is a fundamental immunological process, which requires rapid responses via post translational modifications (PTM) of proteins. Protein arginine methyltransferase 7 (PRMT7) is an epigenetic factor that has the capacity to mono-methylate histones on arginine residues. Here we show that in chronic obstructive pulmonary disease (COPD) patients, PRMT7 expression is elevated in the lung tissue and localized to the macrophages. In mouse models of COPD, lung fibrosis and skin injury, reduced expression of PRMT7 associates with decreased recruitment of monocytes to the site of injury and hence less severe symptoms. Mechanistically, activation of NF-κB/RelA in monocytes induces PRMT7 transcription and consequential mono-methylation of histones at the regulatory elements of RAP1A, which leads to increased transcription of this gene that is responsible for adhesion and migration of monocytes. Persistent monocyte-derived macrophage accumulation leads to ALOX5 over-expression and accumulation of its metabolite LTB4, which triggers expression of ACSL4 a ferroptosis promoting gene in lung epithelial cells. Conclusively, inhibition of arginine mono-methylation might offer targeted intervention in monocyte-driven inflammatory conditions that lead to extensive tissue damage if left untreated.


Conflict of interest statement

M.C. holds patents for some of the compounds described herein and is co-founder and shareholder of ROSCUE Therapeutics GmbH. The remaining authors declare no competing interests.

Figures

Fig. 1
Fig. 1. PRMT7 expression is increased in COPD lungs and localized to macrophages.
a Heat map of the most significantly enriched gene lists in the lungs of COPD patients following gene set enrichment analysis (GSEA) of the GO molecular function set on publicly available array data from lung tissue (GSE76925) of healthy smokers (n = 40) v COPD patients (n = 111). Nominal P value generated by the GSEA software of the enrichment score relative to the null distribution shown. b Expression of genes involved in N-methyltransferase activity in COPD patients relative to healthy smokers taken from GSE76925, relative fold change, and P value calculated using the GEO2R interactive web tool running limma R. PRMT genes highlighted in red. c, d Expression of PRMT7, in the lungs of healthy smokers and COPD patients, individuals are shown, expression relative to healthy smokers, taken from GSE76925 (n = 40 smokers and n = 111 COPD patients) (c) and GSE27597 (n = 16 smokers and n = 48 COPD patients) (d). e qPCR analysis of PRMT7 and TNF expression in human lung core biopsies from healthy controls (n = 8) and COPD patients (n = 18) relative to controls. f Western blot analysis of PRMT7 expression in lung core biopsies from healthy (n = 17) and COPD patients (n = 23), normalized to β-actin and shown relative to controls. g Representative images of immunofluorescence analysis for PRMT7 (Red) and the macrophage marker Galectin 3 (Green) in sections from core biopsies of healthy and COPD human lung (n = 4, scale bar 20 μm) and sections from filtered air (FA) and cigarette smoke (CS) mouse lung (n = 5, scale bar 25 μm). h Quantification of double-positive cells from (g). i, j mRNA expression levels of PRMT7 determined by qPCR in human monocytes isolated from blood of non-smokers (n = 7) vs smokers (n = 10) (i) and circulating monocytes (n = 4 for FA and CS) (i) and alveolar macrophages (n = 4 for FA and n = 3 for CS) (j) from B6 mice exposed to FA or CS for 3 days, relative to controls. km scRNA-Seq (Drop-Seq) analysis on the lungs of mice following exposure to FA (n = 3) and CS for 2 (n = 5) and 4 months (n = 5). AM alveolar macrophages, CS-ind MØ CS-induced macrophages, IM interstitial macrophages, cMono classical monocytes. k Dot blot depicting Prmt7 expression (log-transformed, normalized UMI counts) and percentage of cells positive for Prmt7 in the myeloid cell compartment. l RNA velocity analysis of the myeloid compartment. (1) AM; (2) CS-ind MØ; (3) Lyve1 + /Cd163 + IM; (4) Lyve1−/Cd163− IM; (5) Prg4 + IM; (6) Ly6c2 + cMono; (7) Ly6c2- non-cMono; (8) Cd103 + /Clec9a + cDC; (9) Cd209 + /Cd11b + cDC; (10) Fscn1 + DC. m Fate probability mapping towards the CS-ind MØ population utilizing CellRank. n Heat map of gene expressions of PRMT6/7, RAP1A, and ALOX5 in monocyte-like macrophages obtained from scRNA-Seq data of bronchoalveolar lavage from COPD patients (n = 9) and healthy controls (n = 6). Mean gene expression per donor is shown as a z-transformed value (across all donors). Data shown mean ± SD and individual patients or mice (cf and hj), P values shown in charts determined by two-tailed Mann–Whitney test (cf), unpaired two-tailed Student’s t-test (hj). Source data are provided as a Source Data file.
Fig. 2
Fig. 2. Loss of PRMT7 results in impaired migration, focal adhesion, and MAPK signaling.
ad Mono-methylated proteins were immunoprecipitated by anti-mono-methylarginine antibody from whole-cell lysates of Prmt7+/+ and Prmt7null MH-S macrophage cells and analyzed by LC-MS/MS proteomics (n = 3 pull-downs per cell line). a Schematic representation of the experiment. b mRNA expression level of Prmt7 determined by qPCR in Prmt7+/+ and Prmt7null MH-S macrophage cells generated by CRISPR/Cas9-mediated targeting of Prmt7 (n = 9 replicates per cell line, ND not detectable). c Western blot analysis of PRMT7 expression in Prmt7+/+ and Prmt7null MH-S cells (repeated two times). d Immunoprecipitation intensity of core histones H2B, H3, H4, and linker H1.2 and H1.5 (Individual pull-downs shown). e Top enriched KEGG pathways under the immune system, cell community, and signal transduction following InCroMAP analysis of the differentially pulled down proteins with less abundance in Prmt7null compared to Prmt7+/+ MH-S cells (FC <−1.6). P values were calculated using a hypergeometric test embedded in the InCroMAP software, no testing for multiple correction. f The fold change of trans-well migrating Prmt7+/+ and Prmt7null MH-S macrophage cells in 24 h towards serum-free (SF) medium ± 100 ng/ml CCL2 (n = 4, repeated two times). g Wound migration assay in Prmt7+/+ (n = 7) and Prmt7null (n = 6) MH-S cells grown to confluence and scratched. Representative images at 0 and 24 h post scratch plus the percentage wound closure at 24 h (repeated twice). Scale bar, 200 μm. h WST assay of Prmt7+/+ (n = 3) and Prmt7null (n = 3) MH-S cells at 24 h. i Percentage of attached Prmt7+/+ and Prmt7null MH-S cells at the time points indicated post-seeding (n = 2 per cell line, repeated twice). j mRNA expression levels of ITGAL and ITGAM determined by qPCR in the monocytes of smokers (n = 11) and non-smokers (n = 10) isolated from the peripheral blood. k MFI of ITGAL and ITGAM surface expression as determined by flow cytometry in Prmt7+/+ (n = 3) and Prmt7null (n = 4) MH-S cells. l MFI of ITGAL and ITGAM surface expression as determined by flow cytometry in WT MH-S cells incubated with 5 μM SGC3027 (PRMT7 inhibitor) for 24 h and analyzed (n = 2). m Western blot analysis of phosphorylated ERK and p38 in Prmt7+/+ and Prmt7null MH-S cells incubated for 30 min with 100 ng/ml CCL2 (repeated independently two times). n Western blot analysis of phosphorylated ERK and p38 in Prmt7+/+ and Prmt7null MH-S cells incubated for 15 min with 1 μg/ml LPS (repeated independently two times). Data shown mean ± SD, P values shown in charts determined by one-way ANOVA Bonferroni’s multiple comparisons test (f, i), unpaired two-tailed Student’s t-test (b, d, g, jl). Source data are provided as a Source Data file.
Fig. 3
Fig. 3. PRMT7 targets RAP1A expression through histone methylation.
a Western blot analysis of RAP1A/RAP1B expression in Prmt7+/+ and Prmt7null MH-S cells (repeated twice). b mRNA expression level of Rap1a and Rap1b determined by qPCR in Prmt7+/+ and Prmt7null MH-S macrophage cells (n = 4 replicates per cell line). cf ATAC-Seq analysis of Prmt7+/+ v Prmt7null MH-S cells. c ATAC-seq signal enrichment peaks around the transcription start site (TSS) of the Rap1a gene in Prmt7+/+ and Prmt7null MH-S cells and difference in peak height across the two lines. d Heat map of tag distributions across TSSs for Prmt7+/+ and Prmt7null MH-S cells. e Peak correlation scatter plot. f Pie chart showing the genomic distribution of accessible regions in Prmt7+/+ and Prmt7null MH-S cells. g Schematic representation of the location of the Rap1a regions targeted for qPCR following ChIP, plus H3K4me1 and H3K27a enrichment in BMDM (from UCSC genome browser Track accessions: wgEncodeEM002658 and wgEncodeEM002657). h Enrichment of H3R2 mono and dimethylation at Rap1a regions in Prmt7+/+ and Prmt7null MH-S by qPCR following ChIP (n = 2 per cell line). i Western blot analysis of mono and dimethylation of H3R2 in Prmt7+/+ and Prmt7null MH-S cells (repeated twice). j Dot blot depicting Rap1a expression (log-transformed, normalized UMI counts) and percentage of cells positive for Rap1a in monocytes from mouse lung single-cell RNA-seq data following exposure to FA (n = 3) and CS for 2 (n = 5) and 4 months (n = 5). k mRNA expression levels of RAP1A determined by qPCR in the monocytes of smokers (n = 10) and non-smokers (n = 11) isolated from the peripheral blood. l MFI of ITGAL and ITGAM surface expression as determined by flow cytometry in Prmt7+/+ MH-S cells incubated with 20 μM GGTI (RAP1 inhibitor) for 2 h and analysed 6 h later (n = 2, repeated three times). m Western blot analysis of phosphorylated ERK in WT MH-S cells pretreated with the RAP1 inhibitor GGTI (20 μM) for 2 h and incubated for 15 min with 1 μg/ml LPS. Quantification relative to actin shown (repeated two times). Data shown mean ± SD, P values shown in charts determined by unpaired two-tailed Student’s t-test (b, h, k, l), one-way ANOVA Bonferroni’s multiple comparisons test (m). Source data are provided as a Source Data file.
Fig. 4
Fig. 4. PRMT7 regulates monocyte recruitment.
a The number of trans-well migrating monocytes isolated from the bone marrow of WT and Prmt7+/− mice migrating in 4 h through TNF (10 ng/ml) activated SVECs towards serum-free (SF) medium ± 100 ng/ml CCL2 (n = 3 independent experiments). b Flow cytometry plot of CCR2 expression and MFI of CCR2 in monocytes isolated from the bone marrow of WT and Prmt7+/− mice (n = 4 per genotype). ci Left lungs from wild-type (WT) mice were orthotopically transplanted into WT or Prmt7+/− recipients, left for 3 weeks to recover from surgery, and then exposed to a single dose of porcine pancreatic elastase (PPE) 40 U/Kg and analyzed 28 days later (n = 4 per group). c Schematic representation of the experiment. d Representative images of immunohistochemical analysis for Galectin 3 positive macrophages (red signal, hematoxylin counterstained, scale bar 50 μm) in sections from the transplanted lungs. e Quantification of macrophage number in lung sections from (d) given as the number of positive cells per 20 random fields of view. f Bronchoalveolar lavage fluid total and macrophage cell count. g Representative images of Hematoxylin and Eosin (H&E)-stained sections from the transplanted lungs (scale bar 200 μm). h Quantification of airspace enlargement as mean chord length (MCL) in lung sections from (g). i Lung function is measured as the diffusing capacity of carbon monoxide and forced vital capacity (FVC). jp WT and Prmt7+/− mice were exposed to FA or cigarette smoke (CS) for 4 months (n = 4–8 per group, repeated twice). j Representative images of immunohistochemical analysis for Galectin 3 positive macrophages (red signal, hematoxylin counterstained, scale bar 100 μm) in lung sections. k Quantification of macrophage number in lung sections (n = 4 per group) from (j) given as the number of positive cells per 20 random fields of view. l Representative flow cytometry plots of whole lung single-cell suspensions to assess F4/80+ macrophages gated on CD45+ cells and CD11b vs CD11c expression gated on the F4/80+ cells, see Supplementary Fig. 24 for gating strategy. m Quantification of total F4/80+ macrophages (n = 4 for WT FA, WT CS, Prmt7+/− FA and n = 5 for Prmt7+/− CS) and CD11b+ F4/80+ macrophages (n = 4 for WT CS and n = 5 for Prmt7+/ CS). n Representative images of H&E stained lung sections (scale bar 50 μm). o Quantification of airspace enlargement as mean chord length (MCL) in lung sections (n = 9 for WT FA, WT CS, Prmt7+/− FA and n = 11 for Prmt7+/− CS) from (n). p Lung function measured as diffusing capacity of carbon monoxide (n = 5 for WT FA, n = 6 for WT CS, n = 9 for Prmt7+/− FA, and n = 6 for Prmt7+/− CS). Data shown mean ± SD, P values shown in charts determined by one-way ANOVA Bonferroni’s multiple comparisons test (a, k, m, o, p), unpaired two-tailed Student’s t-test (e, f, h, i). Source data are provided as a Source Data file.
Fig. 5
Fig. 5. Ferroptosis of lung alveolar epithelial cells in COPD induced by inflammatory macrophages.
a Heat map of normalized enrichment score (NES) following GSEA of cell death pathway gene lists on array data from lung tissue of COPD patients (GSE47460-GPL14550; 145 COPD patients vs 91 healthy controls). b Expression of ferroptotic genes in the lungs of COPD patients relative to healthy controls taken from GSE47460-GPL14550, relative fold change and P value calculated using the GEO2R interactive web tool running limma R. c Western blot analysis of ACSL4 expression in lung core biopsies from healthy (n = 3) and COPD patients (n = 3), quantification relative to vinculin shown for individual patients. d Representative images of immunohistochemical analysis for ACSL4 (brown signal indicated by arrowhead, hematoxylin counterstained, scale bar 25 μm) in lung sections from COPD patients (n = 4) and healthy controls (n = 4). e Quantification of alveolar epithelial cells positive for ACSL4. f Heat map of NES following GSEA of cell death pathway gene lists on array data from mice exposed to 4 m chronic cigarette smoke (CS, n = 3) v filtered air (FA, n = 3). g Expression of ferroptotic genes in the lungs of mice exposed to 4 m chronic CS (n = 3) relative to FA (n = 3) taken from array data used in (f), relative fold change and P value calculated using the GEO2R interactive web tool running limma R. h, i Cells from whole lung suspensions of mice exposed to FA (n = 3) or CS for 4 m (n = 5), were analysed by scRNA-Seq (Drop-Seq). h UMAP of scRNA-Seq profiles (dots) colored by cell type. i UMAP plots showing expression of ACSL4 in scRNA-Seq profiles. j Representative images of immunohistochemical analysis for ACSL4 (red signal indicated by arrowheads, hematoxylin counterstained, scale bar 25 μm) in lung sections from WT and Prmt7+/− mice exposed to FA or CS for 4 months (n = 4–5 per group). k Quantification of alveolar epithelial cells positive for ACSL4 from (j) (n = 5 for WT FA, Prmt7+/ FA, Prmt7+/− CS and n = 4 for WT CS). l, m Mouse AT2 cells (MLE12) were treated with RSL3 (250 nM), or conditioned medium from control macrophages (MФ, RAW264.7 cells) or those polarized to a pro-inflammatory (IFNγ + LPS) or anti-inflammatory (IL4) phenotype for 48 h, representative data shown from a single experiment repeated twice. l Representative image showing PI uptake at 24 h (Scale bar 50 µm). m Number of dead AT2 cells at the time indicated, data shown from a single experiment repeated twice. n BODIPY oxidation in AT2 cells (MLE12) at 6 h after treatment with RSL3 (250 nM, n = 3) or conditioned medium from control macrophages (n = 2) or those polarized to a pro-inflammatory (n = 6) or anti-inflammatory (n = 3) phenotype. o Number of dead AT2 cells (MLE12) by PI uptake at the time indicated following treatment with RSL3 (250 nM), or conditioned medium from macrophages (MФ, RAW264.7 cells) polarized to pro-inflammatory (IFNγ + LPS) plus 20 μM zVAD or 10 μM necrostatin-1s (Nec1-s), representative data shown from a single experiment repeated twice. p Western blot analysis of ACSL4 in AT2 cells (MLE12) treated for 24 h with conditioned medium from control macrophages (n = 11) or those polarized to a pro-inflammatory (n = 10) or anti-inflammatory (n = 5) phenotype, normalized to β-actin and shown relative to control macrophages. q Western blot analysis of ALOX5 at 72 h in control macrophages (n = 11) or those polarized to a pro-inflammatory (n = 11) or anti-inflammatory (n = 11) phenotype, normalized to β-actin and shown relative to control macrophages. r Western blot analysis of ACSL4 in AT2 cells (MLE12) treated for 24 h with conditioned medium from control macrophages or those polarized to a pro-inflammatory phenotype that were treated with siRNA against Alox5, normalized to β-actin and shown relative to control macrophages, from individual experiments (n = 3). Data shown mean ± SD, P values shown in charts determined by unpaired two-tailed Student’s t-test (c, n), two-tailed Mann–Whitney test (e), one-way ANOVA Bonferroni’s multiple comparisons test (k, p, q). Source data are provided as a Source Data file.

References

    1. Hogg JC, et al. The nature of small-airway obstruction in chronic obstructive pulmonary disease. N. Engl. J. Med. 2004;350:2645–2653. - PubMed
    1. John-Schuster G, et al. Cigarette smoke-induced iBALT mediates macrophage activation in a B cell-dependent manner in COPD. Am. J. Physiol. Lung Cell. Mol. Physiol. 2014;307:L692–L706. - PubMed
    1. Rabe KF, Watz H. Chronic obstructive pulmonary disease. Lancet. 2017;389:1931–1940. - PubMed
    1. Conlon, T. M. et al. Inhibition of LTβR signalling activates WNT-induced regeneration in lung. Nature10.1038/s41586-020-2882-8 (2020). - PMC - PubMed
    1. Barnes PJ. Inflammatory mechanisms in patients with chronic obstructive pulmonary disease. J. Allergy Clin. Immunol. 2016;138:16–27. - PubMed