. 2022 Mar 14;13(1):1326.
doi: 10.1038/s41467-022-28933-1.

βIV-spectrin as a stalk cell-intrinsic regulator of VEGF signaling

Affiliations

βIV-spectrin as a stalk cell-intrinsic regulator of VEGF signaling

Eun-A Kwak et al. Nat Commun. .

Abstract

Defective angiogenesis underlies over 50 malignant, ischemic and inflammatory disorders yet long-term therapeutic applications inevitably fail, thus highlighting the need for greater understanding of the vast crosstalk and compensatory mechanisms. Based on proteomic profiling of angiogenic endothelial components, here we report βIV-spectrin, a non-erythrocytic cytoskeletal protein, as a critical regulator of sprouting angiogenesis. Early loss of endothelial-specific βIV-spectrin promotes embryonic lethality in mice due to hypervascularization and hemorrhagic defects whereas neonatal depletion yields higher vascular density and tip cell populations in developing retina. During sprouting, βIV-spectrin expresses in stalk cells to inhibit their tip cell potential by enhancing VEGFR2 turnover in a manner independent of most cell-fate determining mechanisms. Rather, βIV-spectrin recruits CaMKII to the plasma membrane to directly phosphorylate VEGFR2 at Ser984, a previously undefined phosphoregulatory site that strongly induces VEGFR2 internalization and degradation. These findings support a distinct spectrin-based mechanism of tip-stalk cell specification during vascular development.


Conflict of interest statement

The authors declare no competing interests.

Figures

Fig. 1
Fig. 1. βIV-spectrin expression in ECs and its regulation of vascular sprouting.
A Western blot and densitometry quantification show endogenous βIV-spectrin expression in MEECs at the designated cell densities, where n = 3 independent experiments. Each densitometry value was normalized by the mean value of the 30% mean and then expressed as a fold change over the 30% value. Error bars represent SEM and type 2 t-test results show: *p = 0.04, **p = 0.02 relative to 30% cell density. Source data are provided as a Source data file. B Western blot shows endogenous βIV-spectrin expression and its knockdown using two distinct shRNA target sequences in human microvascular EC 1 (HMEC1) and human umbilical vein EC (HUVEC) along with MEEC and primary mouse aortic ECs (MAEC) ECs. C Representative images of transwell migration using WT (control scrambled) and stable knockdown βIV-shRNA MEECs where n = 9 regions of interest from 3 independent experiments. Scale bar: 100 μm. Data are presented as normalized to the WT ± SEM. Type 2 t-test results show relative to control: *p = 0.00001. Source data are provided as a Source data file. D Crystal violet assay shows comparison of proliferation between WT and βIV-shRNA MEECs over 48 h. Graph represents normalized average from three independent experiments. Error bars represent SEM and type 2 t-test results show relative to control: *p = 2.77E−9. Source data are provided as a Source data file. E Matrigel-induced angiogenesis assay shows EC differentiation and branching in WT versus βIV-shRNA MEECs 20 h upon plating. Scale bar: 100 μm. Data representative of n = 5 regions of interest from 3 independent experiments presented as normalized values to the control. Error bars represent SEM and type 2 t-test results show: *p = 0.000081 relative to control. Source data are provided as a Source data file.
Fig. 2
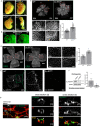
Fig. 2. EC-specific βIV-spectrin deletion in mice results in partial embryonic lethality and defective sprouting angiogenesis.
A Representative images of control and βIV-ECKO mouse embryos at E12.5 upon tamoxifen injection at E8.5. Compared to WT (control-Cdh5-creERT2), βIV-ECKO embryos display hemorrhaging, bulging hindbrain (white arrows), or resorption. Scale bar: 1000 μm. B Fluorescence images show tamoxifen-treated WT and βIV-ECKO embryos harvested at E12.5 and stained for CD31 (green). Significantly greater vessel sprouting is observed in βIV-ECKO (red arrows). C Images show IB4 staining (red) of WT and βIV-ECKO neonatal retina (P5) upon tamoxifen treatment at P1 and P3. Inset images (a–d) show vessel branching upon βIV-spectrin depletion. Data are presented as mean values ± SEM normalized to the control. Type 2 t-test results show: *p = 1.3E−15 relative to WT (n = 37 of at least 6 mice retina per group). Source data are provided as a Source data file. D Images show ERG staining (green) of WT and βIV-ECKO neonatal retina (P5) upon tamoxifen treatment at P1 and P3. Inset (1–4) and graph demonstrate EC-specific counts. Data representative of n = 14 measurements from 3 separate mouse retina per group represented as a mean value ± SEM and normalized to the WT. A Type 2 t-test results show: *p = 1.01E−8 relative to WT. Source data are provided as a Source data file. E Representative image of βIV-spectrin staining (red) in WT and βIV-ECKO neonatal retina (P5). Inset image shows βIV-spectrin concentrated along the periphery of the vascular plexus in WT whereas staining is significantly diminished in βIV-ECKO. Data representative of 8 retina per group. F Biochemical analysis shows nearly 90% depletion of endogenous βIV-spectrin in primary ECs isolated from control and βIV-ECKO mice at P5. Data are presented as mean values ± SEM of 4 independent analyses normalized to the WT values. Type 2 t-test results show *p = 0.05 over WT. Source data are provided as a Source data file. G Confocal Z-stack images acquired with ×63 oil objective show cross-sections of the WT P5 mouse retinal capillaries near the leading edge of vascular expansion co-stained for βIV-spectrin (green) and IB4 (red). White arrows indicate the patches of co-localization (yellow).
Fig. 3
Fig. 3. βIV-spectrin regulates VEGFR2 expression and downstream signaling.
A Heat map based on MS-based quantitative proteomics shows differential expression of proteins found in WT versus βIV-shRNA MEECs. N = 3 biological replicates per group. B Representative western blots show comparison of total VEGFR2 and activated receptor levels in WT and βIV-shRNA MEECs based on pan-antibody and phosphor-Tyr-specific sites as indicated. Data representative of three independent experiments. C, D Representative western analysis of VEGFR2 and downstream signaling in control versus βIV-shRNA MEECs or primary βIV-ECKO ECs. Data representative of three independent experiments. E Graph shows relative VEGFR2 mRNA levels in control vs βIV-shRNA MEECs, where n = 3 independent experiments. A Type 2 t-test results show relative to WT: *p = 0.01. Source data are provided as a Source data file. F Representative western and densitometry quantification graph demonstrate VEGFR2 levels at indicated time points upon chloroquine treatment (50 μM). Data are presented as mean values ± SEM of three independent experiments. A Type 2 t-test results show: *p is 0.045 or lower relative to 0 h time point in WT. Source data are provided as a Source data file. G Representative western images of VEGFR2 and βIV-spectrin levels upon ectopic expression of human βIV-spectrin construct in WT and βIV-shRNA MEECs. Graph shows normalized densitometry quantification of three independent experiments as mean values ± SEM. A Type 2 t-test results show *p = 0.049, **p = 0.001, ***p = 0.015 compared to WT or as indicated. Source data are provided as a Source data file. H Immunofluorescence images show VEGFR2 levels in P5 retina of WT and βIV-ECKO mice, where n = 39 regions of interest for CTCF in 3 separate mouse retina per group in the WT and n = 42 regions of interest for CTCF in 3 separate mouse retina per group in βIV-ECKO. Graph shows relative fluorescence of VEGFR2 as quantified by CTCF (corrected total cell fluorescence). A Type 2 t-test results show: *p = 3.87E−14 over WT. Data are presented as mean values ± SEM. Source data are provided as a Source data file. I Immunofluorescence co-staining of VEGFR2 (green) and IB4 (red) demonstrates concentrated receptor expression along the radial front of vascular expansion (white arrows) in βIV-ECKO retina. Data representative of n = 8 retina per group. Source data are provided as a Source data file. J Confocal Z-stack images acquired with 63X oil objective show cross-sections of the WT P5 mouse retinal capillaries near the leading edge of vascular expansion co-stained for VEGFR2 (green) and IB4 (red). White arrows indicate the patches of co-localization (yellow).
Fig. 4
Fig. 4. βIV-spectrin recruits CaMKII to form a trimeric complex with VEGFR2 to promote VEGFR2 turnover.
A Confocal Z-stack image analysis shows endogenous βIV-spectrin localization in punctate clusters (green) that localize at the basolateral membrane (yellow arrows and clustered staining correspond to basolateral polarity in topology heat map). EEA1 (red) shows both membrane and cytoplasmic localization as indicated by green and yellow arrows and topology heat map. B Schematic of WT and βIV-spectrin mutant, qv4J, which lacks the C-terminal domain containing CaMKII-binding site. The peptide sequence showing the precise CaMKII-binding site is conserved. C Western analysis of total VEGFR2 and CaMKII expression in control and βIV-shRNA MEECs upon transfection with vector control or CaMKIIα. Densitometry quantification representative of three independent experiments, where data is presented as mean values ± SEM. A Type 2 t-test results show: *p = 0.03, **p = 0.01 relative to vector control. Source data are provided as a Source data file. D Western analysis shows total VEGFR2 levels in WT and βIV-shRNA MEECs upon treatment with KN-93 (8 μM) or chloroquine (50 μM) for 2 h. Densitometry quantification represented as mean values ± SEM of three independent experiments. A Type 2 t-test results show: *p = 0.03 or lower, relative to no treatment control. Source data are provided as a Source data file. E Endogenous immunoprecipitation of βIV-spectrin results in co-IP of endogenous VEGFR2 and CaMKII in control but not βIV-shRNA MEECs. Mouse IgG used as negative control. F Immunofluorescence tri-staining shows endogenous βIV-spectrin (red), VEGFR2 (green), and CaMKII (blue) and merged (white) in MEECs. White arrows indicate sites of co-localization. Quantification based on Pearsons correlation coefficient. Graph represents the average of three independent experiments where at least 12 cells were quantified per group per experiment presented as a mean value ± SEM. A Type 2 t-test results show: *p = 2.27E−17 over control cells. Source data are provided as a Source data file. G Representative biochemical experiment in which endogenous βIV-spectrin is immunoprecipitated and probed for endogenous VEGFR2 and CaMKII upon treatment with VEGF (50 ng/mL) for the indicated time points (0–120 min). Graph represents densitometry quantification of n = 3 independent experiments. Data are presented as a mean value ± SEM normalized to 0 min time point. A Type 2 t-test results show: *p = 0.04 or lower relative to 0 min. Source data are provided as a Source data file.
Fig. 5
Fig. 5. βIV-spectrin mediates CaMKII-induced VEGFR2 internalization and turnover.
A Immunofluorescence images indicate cell surface levels of endogenous VEGFR2 in nonpermeabilized control and βIVqv4J ECs upon treatment with KN-93 (2 μM for 4 h). Scale bar: 20 μm. Data is presented as a mean normalized value ± SEM, where n = 22, 32, 26, 25 cells based on 3 independent experiments for WT No treatment, WT CaMKII inhibitor, βIVqv4J VEGF treatment, and βIVqv4J CaMKII inhibitor, respectively. A Type 2 t-test results show: *p = 0.0001, **p = 0.0001 or lower compared to WT. Source data are provided as a Source data file. B Western analysis shows immunoprecipitation of total ubiquitin followed by immunoblotting for VEGFR2 in WT versus βIV-shRNA MEECs upon treatment with KN-93 (2 μM 4 h). Data representative of three independent experiments. C VEGFR2 immunofluorescence staining of P5 WT and βIV-ECKO retina upon simultaneous tamoxifen induction and KN-93 treatment via IP injection at P1 and P3. Graph quantification based on average normalized CTCF values ± SEM, where n = 39, 13, 42, 18 regions of interest in 3 separate mouse retinas for WT control, WT KN-93, βIV-ECKO control, βIV-ECKO KN-93, respectively. A Type 2 t-test results show: *p = 5.34E−7 or lower compared to P5 WT. Source data are provided as a Source data file.
Fig. 6
Fig. 6. βIV-spectrin recruits CaMKII to the membrane to promote phosphorylation-induced VEGFR2 turnover.
A Schematic shows βIV-spectrin-mediated CaMKII potentially targeting one or more of its consensus R/K-X-X-S/T phosphorylation motifs present on VEGFR2. B Representative western shows total VEGFR2 and CaMKII levels in MEECs transiently overexpressing either WT, VEGFR2 point mutant S984A, or S1235A with CaMKII. Graph densitometry quantification indicates mean values  ± SEM of where n = 3 independent experiments. A Type 2 t-test results show: *p = 0.005 or lower and **p = 0.01 or lower when compared to the control or as indicated. Source data are provided as a Source data file. C Immunofluorescence images show cell surface levels of ectopic expression of VEGFR2 WT, S984A or S1235A (red) in the presence or absence of CaMKII (green) in nonpermeabilized MEECs. Scale bar: 50 μm. Graph indicates average normalized CTCF values ± SEM, where n = 35, 28, 26, 40, 21, 29 cells per experiment for WT (−), S984A, S1235A, WT + CaMKII, S984 + CaMKII and S1235A + CaMKII, respectively, derived from 3 independent experiments. A Type 2 t-test results show: *p = 1.62E−15 or lower when compared to WT (−). Source data are provided as a Source data file.
Fig. 7
Fig. 7. βIV-spectrin acts as a Notch-independent regulator of tip-cell properties in stalk cells.
A Representative westerns show comparative levels of tip and stalk cell markers in control versus βIV-shRNA MEECs. Graph quantifications represented as mean values ± SEM of 3 independent experiments. A Type 2 t-test results show: *p = 0.04 relative to control. Source data are provided as a Source data file. B Immunofluorescence analysis indicates CD34 + staining counts in control versus βIV-shRNA ECs in the presence or absence of VEGF stimulation for 4 h. Scale bar: 20 μm. Graph shows the percentage of total CD34 + counts per 100 cells in each group presented as mean value ± SEM. A Type 2 t-test results show: *p = 5.77E−15, **p = 7.96E−8 relative to control no treatment. Source data are provided as a Source data file. C Immunofluorescence analysis demonstrates the formation of filopodial projections in control versus βIV-shRNA ECs upon VEGF stimulation for 2 h. Scale bar: 5 μm. Graph indicates average number of filopodial projections per CD34 + cells ± SEM, where n = 7, 8, 9, 8 regions of interest in 3 separate mouse retinas for the Control (−), Control+ VEGF, βIV-shRNA (−), and βIV-shRNA+ VEGF, respectively. A Type 2 t-test results show: *p = 0.03 relative to control no treatment, **p = 0.01 as indicated. Source data are provided as a Source data file. D Immunofluorescence images show CD34 staining in P5 retina of WT and βIV-ECKO mice. Graph quantification based on normalized CTCF values ± SEM, where n = 34 and 41 for WT and βIV-ECKO, respectively, from 6 separate mice retinas per group. A Type 2 t-test results show: *p = 0.01 relative to WT. Source data are provided as a Source data file. E Higher magnification imaging of CD34 shows filopodial projections at the leading edge of the vascular plexus of WT and βIV-ECKO retina at P5. Graph represents percentage of filopodial counts normalized to WT ± SEM, where n = 28 and 25 for WT and βIV-ECKO, respectively from 5 separate mouse retinas. A Type 2 t-test results show: *p = 1.87E−5. Source data are provided as a Source data file. F Immunofluorescence co-staining reveals that βIV-spectrin expression is excluded from the leading-edge tip cells (white dotted line and arrows in magnified image). G Representative immunofluorescence images and graph indicate greater CD34 punctate staining in βIV-ECKO than WT embryos at E12.5. Each value was normalized by the mean value of the WT value and data are presented as mean values ± SEM, where n = 10 regions of interest from 4 separate embryos. A Type 2 t-test results show: *p = 0.01 relative to WT. Source data are provided as a Source data file.

References

    1. Carmeliet P, Jain RK. Molecular mechanisms and clinical applications of angiogenesis. Nature. 2011;473:298–307. - PMC - PubMed
    1. Welti J, Loges S, Dimmeler S, Carmeliet P. Recent molecular discoveries in angiogenesis and antiangiogenic therapies in cancer. J. Clin. Invest. 2013;123:3190–3200. - PMC - PubMed
    1. Yang J, Yan J, Liu B. Targeting VEGF/VEGFR to modulate antitumor immunity. Front. Immunol. 2018;9:978. - PMC - PubMed
    1. Wu JB, Tang YL, Liang XH. Targeting VEGF pathway to normalize the vasculature: an emerging insight in cancer therapy. Onco Targets Ther. 2018;11:6901–6909. - PMC - PubMed
    1. Allen E, Missiaen R, Bergers G. Trimming the vascular tree in tumors: metabolic and immune adaptations. Cold Spring Harb. Symp. Quant. Biol. 2016;81:21–29. - PMC - PubMed

Publication types

MeSH terms

Substances

LinkOut - more resources