. 2022 Mar 14;13(1):1311.
doi: 10.1038/s41467-022-28873-w.

Texture is encoded in precise temporal spiking patterns in primate somatosensory cortex

Affiliations

Texture is encoded in precise temporal spiking patterns in primate somatosensory cortex

Katie H Long et al. Nat Commun. .

Abstract

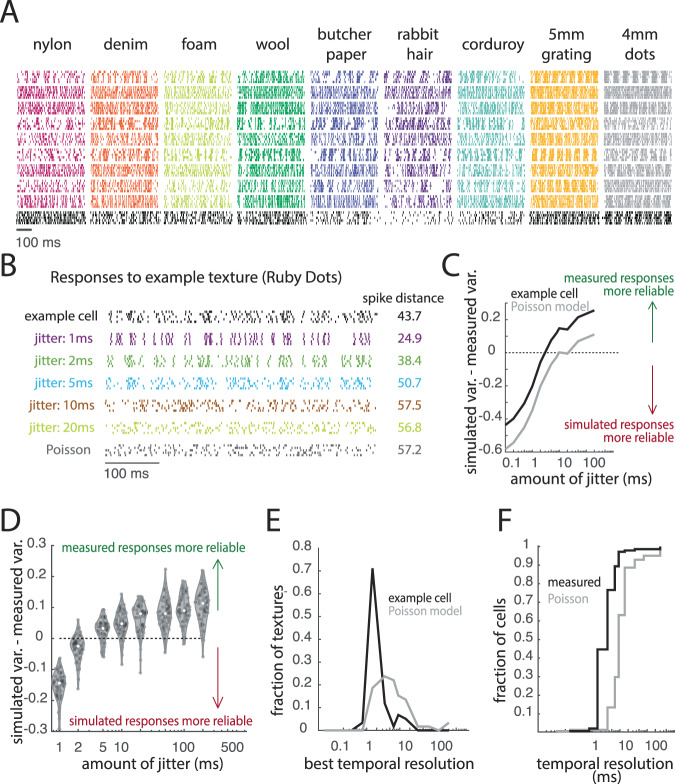
Humans are exquisitely sensitive to the microstructure and material properties of surfaces. In the peripheral nerves, texture information is conveyed via two mechanisms: coarse textural features are encoded in spatial patterns of activation that reflect their spatial layout, and fine features are encoded in highly repeatable, texture-specific temporal spiking patterns evoked as the skin moves across the surface. Here, we examined whether this temporal code is preserved in the responses of neurons in somatosensory cortex. We scanned a diverse set of everyday textures across the fingertip of awake macaques while recording the responses evoked in individual cortical neurons. We found that temporal spiking patterns are highly repeatable across multiple presentations of the same texture, with millisecond precision. As a result, texture identity can be reliably decoded from the temporal patterns themselves, even after information carried in the spike rates is eliminated. However, the combination of rate and timing is more informative than either code in isolation. The temporal precision of the texture response is heterogenous across cortical neurons and depends on the submodality composition of their input and on their location along the somatosensory neuraxis. Furthermore, temporal spiking patterns in cortex dilate and contract with decreases and increases in scanning speed, respectively, and this systematic relationship between speed and patterning may contribute to the observed perceptual invariance to speed. Finally, we find that the quality of a texture percept can be better predicted when these temporal patterns are taken into consideration. We conclude that high-precision spike timing complements rate-based signals to encode texture in somatosensory cortex.


Conflict of interest statement

The authors declare no competing interests.

Figures

Fig. 1
Fig. 1. Responses in somatosensory cortex are temporally precise.
A Responses of ten example neurons to five repeated presentations of nine (of 59) textures. Each color denotes a different texture, each row denotes the response of an individual neuron across five repeated presentations of that texture. The bottom row of responses, colored in black, is from the example cell used in (BF) of this figure. For more example responses, see Supplemental Fig. 7. B Response of one example neuron to 5 repeated presentations of one texture (an upholstery fabric). The asterisk indicates the trial response (trial #2) that was used to generate the simulated (jittered) responses. Colored rasters represent rate-matched simulated responses with different amounts of jitter. The gray raster is a rate-matched response from a Poisson model. Spike distances represent mean pairwise values across the five measured or simulated responses. C To assess the match in the variability of measured and simulated responses, we first divide the spike distance by the mean firing rate across repetitions and subtract this value from its counterpart calculated from the simulated response. The point at which this line crosses the x-intercept represents the point at which the measured responses become more temporally reliable than their simulated counterparts. The black trace is derived from the measured response of the neuron and the gray trace is derived from a rate-matched Poisson model to ‘Ruby Dots’. D The difference in the variability of the measured and simulated responses as a function of jitter for all textures. Each point is one texture. For most textures, measured responses are more reliable than simulated responses with jitter set to 5 ms. E Histogram of the resolutions estimated from the responses to all repeated presentations of all 59 textures of the example neuron (black) and its rate-matched Poisson counterpart (gray). F Cumulative distribution of the temporal resolutions, determined using the methods shown in (BE), of all neurons (measured, black) and their rate-matched Poisson models (Poisson, gray).
Fig. 2
Fig. 2. Temporal spiking patterns in somatosensory cortex carry texture information.
A Classification performance (percentage of textures correctly classified from the full texture set, comprising 59 unique textures) is best at high temporal resolutions (1–5 ms). The temporal resolution denotes the standard deviation of the Gaussian filter used to smooth the neuronal response. Performance derived from example neurons is shown in black and dark gray, mean performance across all cortical neurons is shown in blue, mean performance from rate-matched Poisson simulated neurons is shown in light gray. Simulated Poisson responses, which do not carry texture information in their timing, yield chance classification performance (1/59 textures ~ 2%). Shaded area denotes the standard error of the mean. B Single-cell classification performance for all 141 neurons for rate (red), timing (blue), and their optimal combination (purple). Dark points denote the example neurons shown in panel A. Violin plots show all values. Boxplots indicate median (center), interquartile range (boxes), and maximum and minimum (whiskers). C Mean classification performance with neuronal populations of different sizes; shaded area denotes standard deviation across 1000 iterations at each sample size. Timing-based classification (blue) yields better performance than does its rate-based counterpart (rate) for very small groups of cells, but timing-based performance levels off at a much lower level than does rate-based performance. Rate is nearly perfect with even a small population of 50–100 cells, but a combination of rate and timing (purple) is better for neuronal populations of any size and reaches 90% performance with only 13 cells (as compared to rate, which requires 29 cells).
Fig. 3
Fig. 3. Informativeness of spike timing is related to the submodality composition of a neuron’s input.
A Mean classification performance for individual PC-like neurons (orange, n = 12), SA1-like neurons (green, n = 25), and RA-like neurons (blue, n = 12). PC-like and RA-like responses allow for better classification than do SA1-like responses, and all are better than rate-matched simulated Poisson responses (dashed lines). Shaded regions denote the standard error of the mean across neurons. B Cumulative distribution of the peak temporal resolution for individual neurons. CF Population classification using rate (red), timing (blue), and both (purple) for SA1-like neurons (C), PC-like neurons (D), RA-like neurons (E), or the remaining 92 unclassified cells (F). Shaded regions denote the standard deviation across 200 iterations.
Fig. 4
Fig. 4. Differences in the informativeness of temporal patterns across cortical fields.
A Mean timing-based classification for individual neurons in areas 3b (n = 35, blue), 1 (n = 81, red), and 2 (n = 25, yellow). Shaded area represents standard error of the mean across neurons. Dashed lines on the right denote the mean classification performance based on firing rates for each area. B Cumulative distribution of the best decoding resolutions separated for nerve fibers (dashed lines; PC: orange, SA1: green, RA: blue) and cortical neurons (solid lines, 3b: blue, 1: red, 2: yellow).
Fig. 5
Fig. 5. Temporal spiking patterns depend on scanning speed.
A Responses of three example neurons to two different textures (City Lights, a fabric with fine textural features and coarse ridges, as well as a dot pattern). Colors denote scanning speed, with darker colors corresponding to faster speeds. On the left, spikes are plotted across time. On the right, spikes times are “warped” such that each spike is plotted per mm of the texture rather than ms in time (by multiplying inter-spike intervals by scanning speed). B Timing-based classification of texture when trained on responses to textures presented at one speed (60, 80, 100, or 120 mm/s, n = 49 cells) and tested either within speed (cyan) or across speeds (dark blue). On the right, spike times are warped as in (A), and classifiers are trained and tested on these warped spike trains. Chance performance is 10% (dashed line). C Mean classification based on timing (blue) or rate (red), within and across speeds. Two cross-speed classifiers were assessed; light bars represent unwarped (spikes/ms), dark bars represent warped (spikes/mm) spike trains. Boxes show the median and interquartile range and the whiskers show the full range across 49 neurons and speed combinations (within speed, n = 4 speeds; across speeds, n = 12 combinations). D Mean cross-speed population classification based on rate (unwarped, red), timing (warped, blue), and an averaged combination of both (purple). Shaded regions denote standard deviation across 1000 iterations of randomly sampled populations of neurons.
Fig. 6
Fig. 6. Temporal patterns predict texture perception.
A The correlation between the temporal spiking patterns evoked by texture pairs in PC-like neurons is negatively correlated with perceived dissimilarity of those same texture pairs. Each point represents the mean value for one pair of textures. Z-scored timing correlation represents the max cross-correlation of a pair of textures, z-scored across all texture pairs for a given cell, and averaged across all PC-like cortical cells. B Mean squared error (MSE) of the prediction of perceived dissimilarity derived from a linear combination of rate and timing differences of increasing-size populations of SA1-like, PC-like, and RA-like cells. Red and teal lines indicates a three-factor model that includes either rate (red) or timing (teal) with each factor in the model derived from the mean across subpopulations of each submodality type (PC-like, RA-like, and SA1-like). The black line indicates a six-factor model including rate and timing from PC-like, SA1-like, and RA-like subpopulations. C Accuracy of the complete model (average n = 10 population response) in predicting perceived dissimilarity. Each circle represents one texture pair (78 unique pairs, rated by 10 human subjects).

Similar articles

Cited by

References

    1. Saal HP, Wang X, Bensmaia SJ. Importance of spike timing in touch: an analogy with hearing? Curr. Opin. Neurobiol. 2016;40:142–149. - PMC - PubMed
    1. Birznieks I, Vickery R. Spike timing matters in novel neuronal code involved in vibrotactile frequency perception: current biology. Curr. Biol. 2017;27:1485–1490. - PubMed
    1. Mackevicius EL, Best MD, Saal HP, Bensmaia SJ. Millisecond precision spike timing shapes tactile perception. J. Neurosci. 2012;32:15309–15317. - PMC - PubMed
    1. Talbot WH, Darian-Smith I, Kornhuber HH, Mountcastle VB. The sense of flutter-vibration: comparison of the human capacity with response patterns of mechanoreceptive afferents from the monkey hand. J. Neurophysiol. 1968;31:301–334. - PubMed
    1. Harvey MA, Saal HP, Dammann JF, Bensmaia SJ. Multiplexing stimulus information through rate and temporal codes in primate somatosensory cortex. PLoS Biol. 2013;11:e1001558. - PMC - PubMed

Publication types