. 2022 Mar 14;13(1):1330.
doi: 10.1038/s41467-022-29094-x.

High-resolution population estimation using household survey data and building footprints

Affiliations

High-resolution population estimation using household survey data and building footprints

Gianluca Boo et al. Nat Commun. .

Abstract

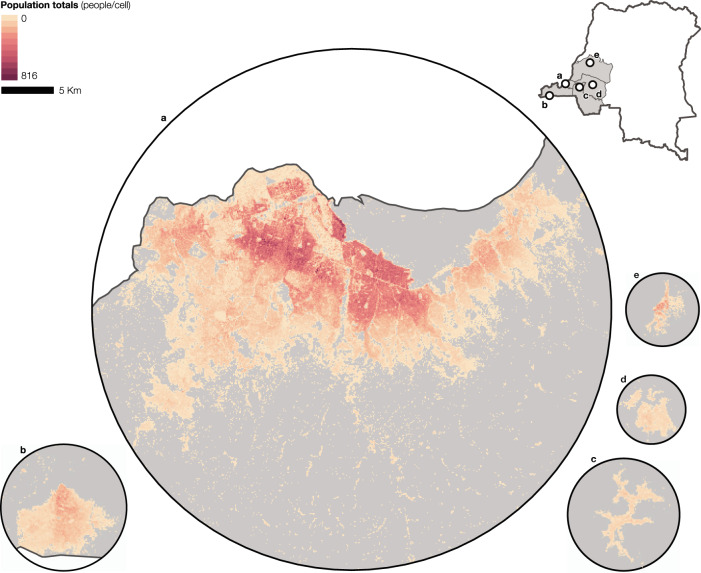
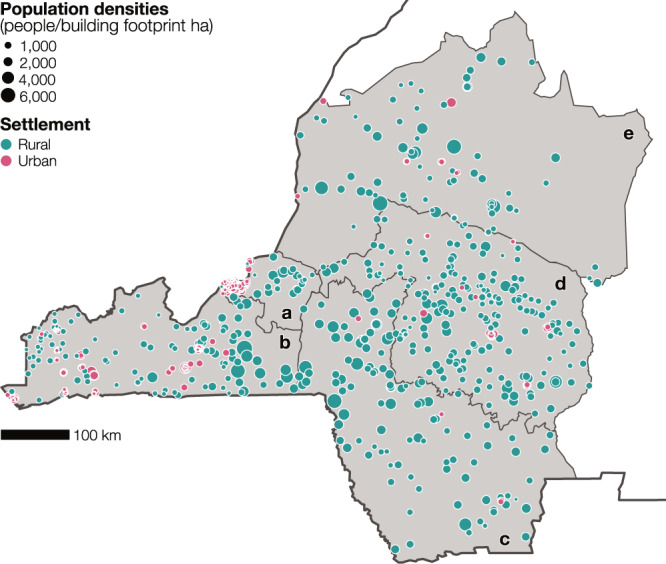
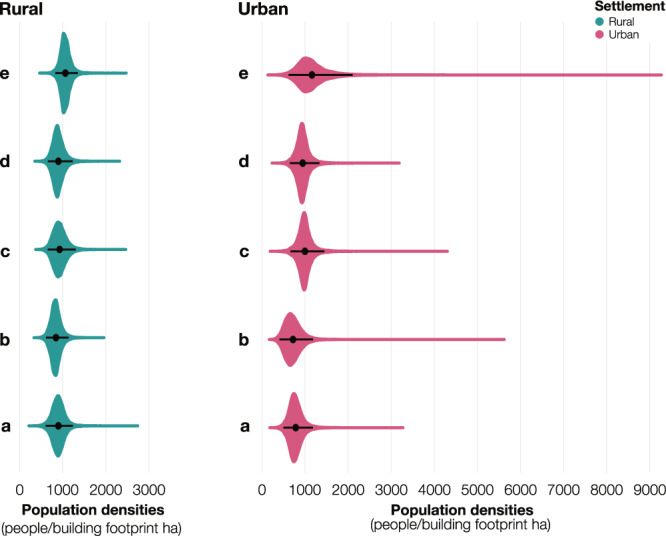
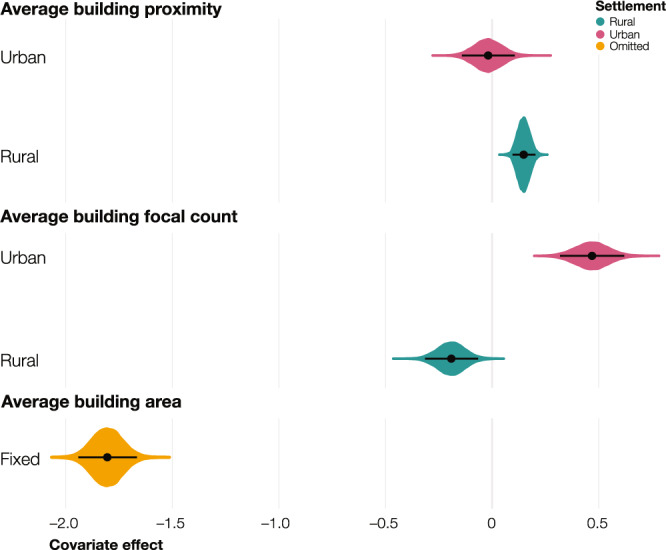
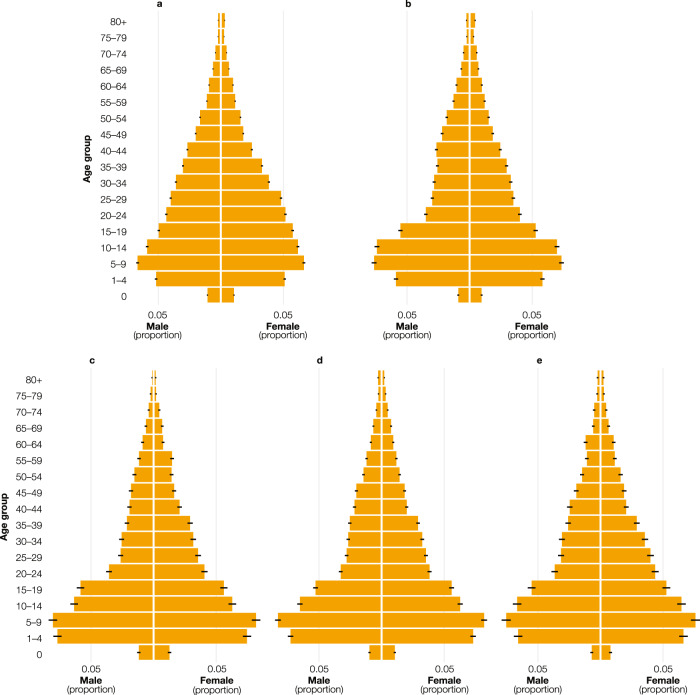
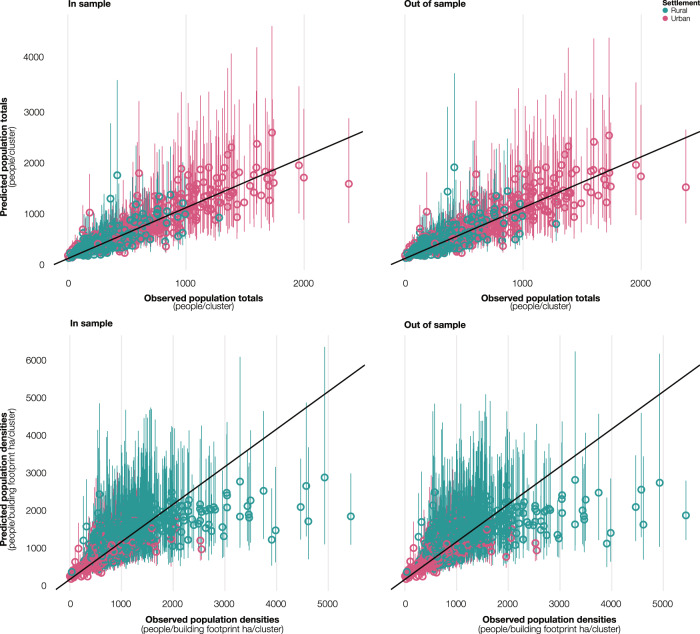
The national census is an essential data source to support decision-making in many areas of public interest. However, this data may become outdated during the intercensal period, which can stretch up to several decades. In this study, we develop a Bayesian hierarchical model leveraging recent household surveys and building footprints to produce up-to-date population estimates. We estimate population totals and age and sex breakdowns with associated uncertainty measures within grid cells of approximately 100 m in five provinces of the Democratic Republic of the Congo, a country where the last census was completed in 1984. The model exhibits a very good fit, with an R2 value of 0.79 for out-of-sample predictions of population totals at the microcensus-cluster level and 1.00 for age and sex proportions at the province level. This work confirms the benefits of combining household surveys and building footprints for high-resolution population estimation in countries with outdated censuses.


Conflict of interest statement

The authors declare no competing interests.

Figures

Fig. 1
Fig. 1. Gridded population estimates in selected cities.
Estimated population totals (people/cell) in the capital cities of the provinces of (a) Kinshasa (Kinshasa), (b) Kongo Central (Matadi), (c) Kwango (Kenge), (d) Kwilu (Bandundu), and (e) Mai-Ndombe (Inongo). The estimates represent the mean of the posterior distribution (n = 10,000). The map of the DRC shows the extent of the five provinces defining the study region in gray.
Fig. 2
Fig. 2. Microcensus clusters location and associated population densities.
Observed population densities (people/building footprint ha) across the microcensus clusters (n = 905 clusters) in the provinces of (a) Kinshasa (n = 26 rural and n = 254 urban clusters), (b) Kongo Central (n = 113 rural and n = 109 urban clusters), (c) Kwango (n = 111 rural and n = 6 urban clusters), (d) Kwilu (n = 182 rural and n = 23 urban clusters), and (e) Mai-Ndombe (n = 69 rural and n = 12 urban clusters). The microcensus clusters are classified according to the settlement type (urban in pink and rural in turquoise).
Fig. 3
Fig. 3. Model intercepts.
Posterior probability distributions of the random intercepts (people/building footprint ha) by settlement type (urban in pink and rural cluster in turquoise) across the provinces of (a) Kinshasa, (b) Kongo Central, (c) Kwango, (d) Kwilu, and (e) Mai-Ndombe. The black dots show the mean of the distributions and the horizontal black lines show the 95% credible intervals derived from the posterior distribution (n = 10,000). Source data are provided with this paper.
Fig. 4
Fig. 4. Covariates effect.
Posterior probability distribution of the random effect by settlement type (urban in pink and rural in purple) for the covariates average building proximity and average building focal count and the fixed effect (in orange) for the covariate average building area. The black dots show the mean of the distributions and the horizontal black lines show the 95% credible intervals derived from the posterior distribution (n = 10,000). Source data are provided with this paper.
Fig. 5
Fig. 5. Predicted age and sex structures.
Population pyramids presenting the means of the posterior distribution (n = 10,000) for each age and sex proportion for the provinces of (a) Kinshasa, (b) Kongo Central, (c) Kwango, (d) Kwilu, and (e) Mai-Ndombe. The horizontal black lines show the 95% credible intervals derived from the respective posterior distribution (n = 10,000). Source data are provided with this paper.
Fig. 6
Fig. 6. Predicted versus observed population totals and densities.
Observed population totals (people/cluster) and densities (people/building footprint ha/cluster) versus in-sample and out-of-sample mean posterior predictions (colored dots) with 95% credible intervals (colored vertical lines) derived from the respective posterior distribution (n = 10,000). Population totals and densities are classified according to the settlement type (urban in pink and rural in turquoise). The diagonal black lines show a perfect relationship between observations and predictions. Source data are provided with this paper.

References

    1. Findlay, A. M. Doing development research (SAGE Publications, 2021).
    1. Moultrie, T. A. et al. Tools for demographic estimation (International Union for the Scientific Study of Population (IUSSP), 2013).
    1. United Nations Department of Economic and Social Affairs (UN DESA) — Population Division. World population prospects 2019: methodology of the United Nations population estimates and projections (United Nations, 2019).
    1. Wardrop NA, et al. Spatially disaggregated population estimates in the absence of national population and housing census data. Proceedings of the National Academy of Sciences of the United States of America. 2018;115:3529–3537. doi: 10.1073/pnas.1715305115. - DOI - PMC - PubMed
    1. Weber EM, et al. Census-independent population mapping in northern Nigeria. Remote Sensing of Environment. 2018;204:786–798. doi: 10.1016/j.rse.2017.09.024. - DOI - PMC - PubMed

Publication types